MACD crossover while RSI Oversold/OverboughtThis indicator draws signals on the chart when a Bullish MACD Crossover occurs at the same time RSI is "oversold", and also when Bearish MACD Crossover occurs at the same time RSI is "overbought"
Indicators are drawn on the chart in the following scenarios:
1. Bullish signal
a. MACD bullish crossover occurs on a single bar
b. RSI was below the Oversold threshold (29 by default) within the prior 5 bars
2. Bearish signal
a. MACD bearish crossover occurs on a singnle bar
b. RSI was above the Overbought threshold (71 by default) within the prior 5 bars
스크립트에서 "macd"에 대해 찾기

Ultimate MACD Suite [BigBeluga]🔵 OVERVIEW
The Ultimate MACD Suite is an advanced momentum-based system that enhances the classic MACD with modern features tailored for professional traders.
It transforms MACD into a full market-decision engine — offering multi-timeframe confluence, adaptive histogram behavior, divergence detection, heatmap trend visualization, and actionable reversal signals.
This toolkit goes far beyond standard MACD, helping traders identify trend momentum shifts, exhaustion zones, high-probability reversal areas, and breakout confirmation signals across multiple timeframes simultaneously. It's to be used as part of a major trading system and to simplify usage of the MACD.
⚠️ Note:
This is not a traditional MACD — it uses normalized values , enhanced visual feedback, and a multi-timeframe dashboard engine for superior signal quality and clarity.
🔵 CONCEPTS
Combines MACD momentum, signal-line crossovers, and histogram reversals into one system
Uses normalized scaling to detect extreme momentum levels and exhaustion zones
Multi-timeframe dashboard displays consensus signal alignment across several timeframes
Divergence engine identifies bullish & bearish trend weakening early
Heatmap mode visually distinguishes strong trend phases from neutral or fading momentum
Reversal arrows & crosses highlight actionable turning points on chart
🔵 FEATURES
Normalized MACD Engine — improves signal clarity across all assets/timeframes
MACD Heatmap Mode — color-coded slope intensity for trend strength monitoring
MACD Rising and Falling Mode — color-coded rising and falling MACD regimes
Histogram Reversal Detection — early momentum fade signal before price turns
Signal-Line Momentum Shifts — bullish ▲ & bearish ▼ alerts on cross-confirmation
Overbought/Oversold Bands — enhanced visual thresholds at ±80 levels
Smart Divergence Detection (Non-Lag) — confirms regular bullish & bearish divergences
Multi-Timeframe Dashboard — MACD, signal, histogram & divergence signals across 5+ TFs
Reversal Push-Filter — ensures only clean signals after confirmed momentum inflection
On-Chart Reversal Labels — optional compact signal markers for clean visual execution
Histogram Color Logic — rising/falling or heatmap mode for deeper momentum reading
🔵 HOW TO USE
Look for MACD crossing above signal + green histogram to confirm bullish momentum
Use ▼ and ▲ arrows to catch confirmed momentum reversals
Monitor the dashboard — the more timeframes align, the stronger the setup
Watch divergences for trend exhaustion or reversal setups
Treat histogram trend shifts as early momentum clues before price reacts
Use ±80 levels to identify overheated conditions & fade opportunities
Combine with structure, volume, or BigBeluga liquidity tools for higher accuracy
🔵 ALERTS
The indicator includes a full alert suite for automation and real-time trade readiness:
MACD crossovers (Bullish / Bearish)
Histogram reversals & zero-line shifts
Bullish / Bearish divergence detection
Overbought / Oversold MACD alerts
Bullish ▲ and bearish ▼ reversal triggers
Use these alerts to automate signal monitoring or feed algorithmic systems.
🔵 CONCLUSION
The Ultimate MACD Suite transforms a classic indicator into a powerful trading engine.
With multi-timeframe alignment, heatmapping, divergence logic, normalized scaling and automated signals, it becomes an elite momentum-confirmation and reversal-timing system built for serious traders.
Whether scalping intraday or managing swing positions, this MACD engine helps identify the most profitable phases of trend movement — while warning early when a trend is weakening.
유료 스크립트

Smart MACD Reversal Oscillator Pro [TradeDots]The TradeDots Smart MACD Reversal Oscillator Pro is an advanced technical analysis tool that combines traditional MACD functionality with multi-layered signal detection and divergence identification systems. This comprehensive oscillator helps traders identify potential market reversals, trend continuations, and extremes with greater precision than conventional indicators.
📝 HOW IT WORKS
Accumulation & Distribution Detection System
The indicator begins with a proprietary calculation that identifies potential accumulation and distribution phases:
Calculation: Processes EMA differentials with specific time constants to detect underlying accumulation/distribution pressure
Visualization: Green-filled areas indicate accumulation phases (bullish pressure building) while red-filled areas show distribution phases (bearish pressure building)
Significance: This system often identifies trend reversals before traditional indicators by detecting institutional buying/selling activity
Multi-Timeframe MACD Implementation
Unlike traditional MACD indicators that use a single timeframe, this oscillator incorporates multiple calculation methods:
1. Primary Oscillator: Uses a proprietary calculation that combines price extremes with smoothed averages:
Implements specialized moving average types (SMMA and ZLEMA)
Generates a histogram that changes color based on price position relative to these averages
Produces a signal line that identifies crossover opportunities
2. Secondary MACD: Traditional MACD implementation with customizable parameters:
User-selectable MA types (SMA/EMA) for both oscillator and signal line
Color-coded histogram for momentum visualization
Separate crossover detection system
Dynamic Band System
The indicator implements an innovative dynamic band system to identify overbought and oversold conditions:
Band Calculation: Analyzes historical oscillator values to establish statistically significant extremes
Adaptive Scaling: Automatically adjusts to different market volatility regimes using a customizable Y-axis scale factor
Signal Integration: Incorporates band levels into signal generation for higher-probability trades
Signal Generation System
Four distinct signal types are generated to identify potential trading opportunities:
Green Dots: Bullish crossover signals (primary oscillator crosses above signal line)
Red Dots: Bearish crossover signals (primary oscillator crosses below signal line)
Blue Dots: Secondary MACD bullish crossovers in oversold territory
Orange Dots: Secondary MACD bearish crossovers in overbought territory
Advanced Divergence Detection
The oscillator incorporates a sophisticated divergence detection system:
Regular Divergences: Identifies when price makes lower lows while the oscillator makes higher lows (bullish) or price makes higher highs while the oscillator makes lower highs (bearish)
Hidden Divergences: Optional detection of continuation patterns (currently disabled by default)
Visual Markers: Clear labels identifying divergence formations directly on the chart
Zero-Line Filter: Optional filtering to only detect divergences that don't cross the zero line
🛠️ HOW TO USE
Signal Interpretation
Momentum Direction
Histogram Color: Green shades indicate bullish momentum, red shades indicate bearish momentum
Oscillator Position: Above zero indicates bullish momentum, below zero indicates bearish momentum
Filled Background: Green fill shows accumulation phases, red fill shows distribution phases
Buy Signals (In Order of Strength)
Bullish Divergence + Green Dot: Highest probability reversal signal (price making lower lows while oscillator makes higher lows, followed by crossover)
Green Dot Below Short Average Line: Strong oversold reversal signal
Green Dot + Blue Dot Alignment: Multiple indicator confirmation
Green Dot During Green Fill Expansion: Trend continuation signal
Sell Signals (In Order of Strength)
Bearish Divergence + Red Dot: Highest probability reversal signal (price making higher highs while oscillator makes lower highs, followed by crossover)
Red Dot Above Long Average Line: Strong overbought reversal signal
Red Dot + Orange Dot Alignment: Multiple indicator confirmation
Red Dot During Red Fill Expansion: Trend continuation signal
Trading Strategies
Divergence Trading Strategy
Identify "Bullish" or "Bearish" divergence labels on the chart
Wait for confirming dot signal in the same direction
Enter when both divergence and dot signal align
Set stops based on recent swing points
Target the opposite band or previous significant level
Overbought/Oversold Reversal Strategy
Wait for the oscillator to reach extreme bands (Long or Short Average lines)
Look for crossover signals at these extreme levels:
Bullish Crossover (Oversold): Green dots when oscillator is below Short Average
Bearish Crossover (Overbought): Red dots when oscillator is above Long Average
Enter when price confirms the reversal
Set stops beyond the recent extreme
Target the opposite band or at least the zero line
Multi-Confirmation Strategy
For highest probability trades, look for:
Multiple signal types aligning (e.g., Green + Blue dots or Red + Orange dots)
Signals occurring at band extremes
Divergence patterns reinforcing the signal direction
Background fill color supporting the signal (green fill for buys, red fill for sells)
⚙️ CUSTOMIZATION OPTIONS
The indicator offers extensive customization to adapt to different markets and trading styles:
Y-axis scale factor: Controls the band range multiplier (default 2.5)
Parameter 1: Controls the smoothing period for main calculations (default 8)
Parameter 2: Controls the signal line calculation period (default 9)
Fast/Slow Length: Controls traditional MACD calculation periods (12/26)
Oscillator MA Type: Selection between SMA and EMA for main oscillator
Signal Line MA Type: Selection between SMA and EMA for signal line
Divergence Settings: Customizable lookback parameters and display options
Don't touch the zero line?: Toggle option for divergence filtering
❗️LIMITATIONS
Signal Lag: The system identifies reversals after they have begun, potentially missing the absolute bottom or top
False Signals: Can occur during periods of high volatility or during ranging markets
Divergence Validation: Not all divergences lead to reversals; confirmation is essential
Timeframe Sensitivity: The indicator works best on intermediate timeframes (15m to 4h) for most markets
Bar Closing Requirement: All signals are based on closed candles and may be subject to change until the candle closes
RISK DISCLAIMER
Trading involves substantial risk, and most traders may incur losses. All content, tools, scripts, articles, and education provided by TradeDots are for informational and educational purposes only. Past performance is not indicative of future results.
This oscillator should be used as part of a complete trading approach that includes proper risk management, consideration of the broader market context, and confirmation from price action patterns. No trading system can guarantee profits, and users should always exercise caution and use appropriate position sizing.

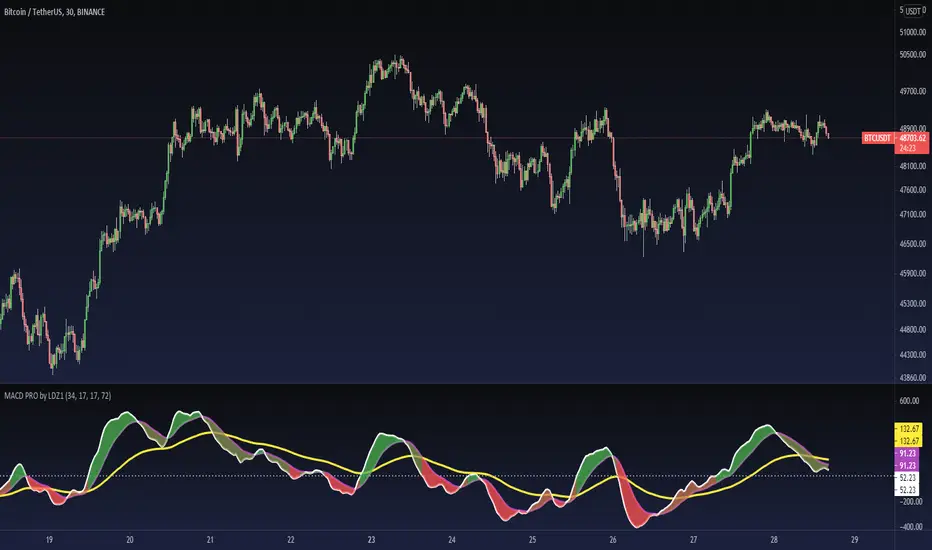
MACD PRO by LDZ1LANDZZ1 MACD Pro was developed to show the first signs of reversal, direction, and also trend strength.
Unlike normal MACD, this indicator has 3 lines as information. A white line (short EMA), a purple line (sign), and a yellow line (long EMA).
The Purple Line "Signal" is a 17-period Exponential Moving Average.
The White Line "Short EMA" is a 34-period Exponential Moving Average.
The Yellow Line "Long EMA" is a 72-Period Exponential Moving Average.
When the background color turns green it indicates that we are above 0 (positive trend) and above the Signal line (positive trend)
When the background color turns Yellow it indicates that we are above 0 (positive trend) but below the Signal line (Indicating Attention to a possible trend reversal or price correction)
When the background color turns Red it indicates that we are below 0 (negative trend) and below the Signal line (negative trend)
When the background color turns Orange it indicates that we are below 0 (negative trend) and above the signal line (Indicating attention to a possible trend reversal or price correction)
The Yellow line is like a watershed, when the White Line "Short EMA" crosses above or below it, it indicates that a stronger price movement may occur.
Tip:
Only enter Long Positions when the background color turns green and the Short EMA (White line) is above the yellow line and/or the white dotted horizontal line.
Only enter Short Positions when the background color turns red and the Long EMA (Yellow line) is below the white dotted horizontal line.
Note the difference of MACD Pro by LANDZZ1 as the traditional MACD.
----------------------------------------------------------
Description in Portuguese-BR
MACD Pro by LANDZZ1 foi desenvolvido para mostrar os primeiros sinais de reversão, direção e também força da tendência.
Diferente do MACD normal, este indicador tem como informação 3 linhas. Uma linha branca (short EMA), uma linha roxa(signal) e uma linha amarela (long EMA).
A Linha Roxa "Signal" é uma Média Móvel Exponencial de 17 períodos.
A Linha branca "Short EMA" é uma Média Móvel Exponencial de 34 períodos.
A Linha Amarela "Long EMA" é uma Média Móvel Exponencial de 72 Períodos.
Quando a cor de fundo ficar verde indica que estamos acima de 0 (tendência positiva) e acima da linha de Sinal (tendência positiva)
Quando a cor de fundo ficar Amarelo indica que estamos acima de 0 (tendência positiva) porém abaixo da linha de Sinal (Indicando Atenção a uma possível reversão de tendência ou correção de preço)
Quando a cor de fundo ficar vermelho indica que estamos abaixo de 0 (tendência negativa) e abaixo da linha de Sinal (tendência negativa)
Quando a cor de fundo ficar laranja indica que estamos abaixo de 0 (tendência negativa) e acima da linha de sinal (Indicando atenção a uma possível reversão de tendência ou correção do preço)
A linha amarela é como um divisor de águas, quando a linha branca (Short EMA) cruza para cima ou para baixo dela, indica que um movimento mais forte forte de preço poderá ocorrer.
Dica:
Apenas entre em Long Positions quando a cor de fundo ficar verde e se a Short EMA (linha Branca) estiver acima da linha amarela e/ou da linha horizontal pontilhada branca.
Apenas entre em Short Positions quando a cor de fundo ficar Vermelha e se a Long EMA (linha Amarela) estiver abaixo da linha horizontal pontilhada branca.
Repare a diferença do MACD Pro by LANDZZ1 como o MACD tradicional.
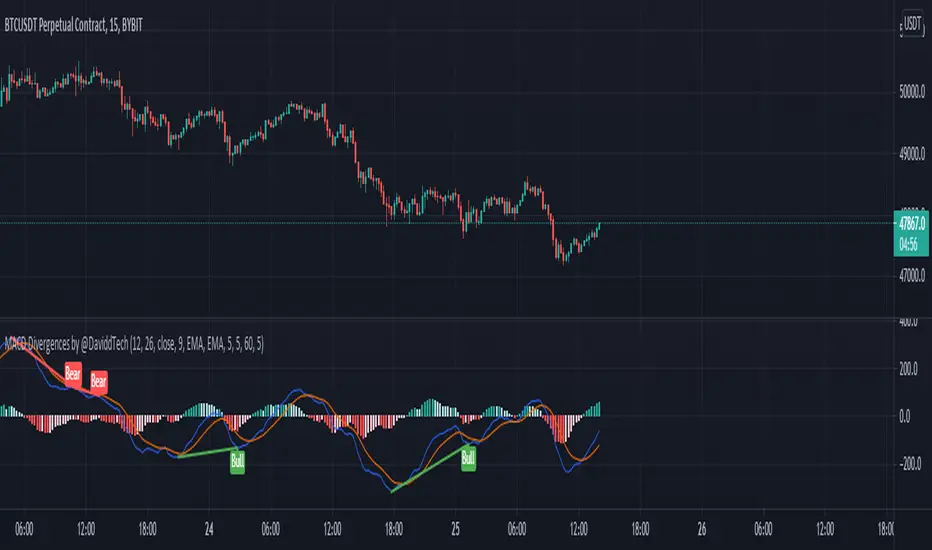
MACD Divergences by @DaviddTechThis indicator helps find divergences in the MACD.
This uses the modification of the TV built-in "Divergence indicator" (Version 10) that I have applied to the MACD.
Usage:
Add the indicator to your chart and then watch for it to plot divergences.
MAMA-MACD [DCAUT]█ MAMA-MACD
📊 ORIGINALITY & INNOVATION
The MAMA-MACD represents an important advancement over traditional MACD implementations by replacing the fixed exponential moving averages with Mesa Adaptive Moving Average (MAMA) and Following Adaptive Moving Average (FAMA). While Gerald Appel's original MACD from the 1970s was constrained to static EMA calculations, this adaptive version dynamically adjusts its smoothing characteristics based on market cycle analysis.
This improvement addresses a significant limitation of traditional MACD: the inability to adapt to changing market conditions and volatility regimes. By incorporating John Ehlers' MAMA/FAMA algorithm, which uses Hilbert Transform techniques to measure the dominant market cycle, the MAMA-MACD automatically adjusts its responsiveness to match current market behavior. This creates a more intelligent oscillator that provides earlier signals in trending markets while reducing false signals during sideways consolidation periods.
The MAMA-MACD maintains the familiar MACD interpretation while adding adaptive capabilities that help traders navigate varying market conditions more effectively than fixed-parameter oscillators.
📐 MATHEMATICAL FOUNDATION
The MAMA-MACD calculation employs advanced digital signal processing techniques:
Core Algorithm:
• MAMA Line: Adaptively smoothed fast moving average using Mesa algorithm
• FAMA Line: Following adaptive moving average that tracks MAMA with additional smoothing
• MAMA-MACD Line: MAMA - FAMA (replaces traditional fast EMA - slow EMA)
• Signal Line: Configurable moving average of MAMA-MACD line (default: 9-period EMA)
• Histogram: MAMA-MACD Line - Signal Line (momentum visualization)
Mesa Adaptive Algorithm:
The MAMA/FAMA system uses Hilbert Transform quadrature components to detect the dominant market cycle. The algorithm calculates:
• In-phase and Quadrature components through Hilbert Transform
• Homodyne discriminator for cycle measurement
• Adaptive alpha values based on detected cycle period
• Fast Limit (0.1 default): Maximum adaptation rate for MAMA
• Slow Limit (0.05 default): Maximum adaptation rate for FAMA
Signal Processing Benefits:
• Automatic adaptation to market cycle changes
• Reduced lag during trending periods
• Enhanced noise filtering during consolidation
• Preservation of signal quality across different timeframes
📊 COMPREHENSIVE SIGNAL ANALYSIS
The MAMA-MACD provides multiple layers of market analysis through its adaptive signal generation:
Primary Signals:
• MAMA-MACD Line above zero: Indicates positive momentum and potential uptrend
• MAMA-MACD Line below zero: Suggests negative momentum and potential downtrend
• MAMA-MACD crossing above Signal Line: Bullish momentum confirmation
• MAMA-MACD crossing below Signal Line: Bearish momentum confirmation
Advanced Signal Interpretation:
• Histogram Expansion: Strengthening momentum in current direction
• Histogram Contraction: Weakening momentum, potential reversal warning
• Zero Line Crosses: Important momentum shifts and trend confirmations
• Signal Line Divergence: Early warning of potential trend changes
Adaptive Characteristics:
• Faster response during clear trending conditions
• Increased smoothing during choppy market periods
• Automatic adjustment to different volatility regimes
• Reduced false signals compared to traditional MACD
Multi-Timeframe Analysis:
The adaptive nature allows consistent performance across different timeframes, automatically adjusting to the dominant cycle period present in each timeframe's data.
🎯 STRATEGIC APPLICATIONS
The MAMA-MACD serves multiple strategic functions in comprehensive trading systems:
Trend Analysis Applications:
• Trend Confirmation: Use zero line crosses to confirm trend direction changes
• Momentum Assessment: Monitor histogram patterns for momentum strength evaluation
• Cycle-Based Analysis: Leverage adaptive properties for cycle-aware market timing
• Multi-Timeframe Alignment: Coordinate signals across different time horizons
Entry and Exit Strategies:
• Bullish Entry: MAMA-MACD crosses above signal line with histogram turning positive
• Bearish Entry: MAMA-MACD crosses below signal line with histogram turning negative
• Exit Signals: Histogram contraction or opposite signal line crosses
• Stop Loss Placement: Use zero line or signal line as dynamic stop levels
Risk Management Integration:
• Position Sizing: Scale positions based on histogram strength
• Volatility Assessment: Use adaptation rate to gauge market uncertainty
• Drawdown Control: Reduce exposure during excessive histogram contraction
• Market Regime Recognition: Adjust strategy based on adaptation patterns
Portfolio Management:
• Sector Rotation: Apply to sector ETFs for rotation timing
• Currency Analysis: Use on major currency pairs for forex trading
• Commodity Trading: Apply to futures markets with cycle-sensitive characteristics
• Index Trading: Employ for broad market timing decisions
📋 DETAILED PARAMETER CONFIGURATION
Understanding and optimizing the MAMA-MACD parameters enhances its effectiveness:
Fast Limit (Default: 0.1):
• Controls maximum adaptation rate for MAMA line
• Range: 0.01 to 0.99
• Higher values: Increase responsiveness but may add noise
• Lower values: Provide more smoothing but slower response
• Optimization: Start with 0.1, adjust based on market characteristics
Slow Limit (Default: 0.05):
• Controls maximum adaptation rate for FAMA line
• Range: 0.01 to 0.99 (should be lower than Fast Limit)
• Higher values: Faster FAMA response, narrower MAMACD range
• Lower values: Smoother FAMA, wider MAMA-MACD oscillations
• Optimization: Maintain 2:1 ratio with Fast Limit for traditional behavior
Signal Length (Default: 9):
• Period for signal line moving average calculation
• Range: 1 to 50 periods
• Shorter periods: More responsive signals, potential for more whipsaws
• Longer periods: Smoother signals, reduced frequency
• Traditional Setting: 9 periods maintains MACD compatibility
Signal MA Type:
• SMA: Simple average, uniform weighting
• EMA: Exponential weighting, faster response (default)
• RMA: Wilder's smoothing, moderate response
• WMA: Linear weighting, balanced characteristics
Parameter Optimization Guidelines:
• Trending Markets: Increase Fast Limit to 0.15-0.2 for quicker response
• Sideways Markets: Decrease Fast Limit to 0.05-0.08 for noise reduction
• High Volatility: Lower both limits for increased smoothing
• Low Volatility: Raise limits for enhanced sensitivity
📈 PERFORMANCE ANALYSIS & COMPETITIVE ADVANTAGES
The MAMA-MACD offers several improvements over traditional oscillators:
Response Characteristics:
• Adaptive Lag Reduction: Automatically reduces lag during trending periods
• Noise Filtering: Enhanced smoothing during consolidation phases
• Signal Quality: Improved signal-to-noise ratio compared to fixed-parameter MACD
• Cycle Awareness: Automatic adjustment to dominant market cycles
Comparison with Traditional MACD:
• Earlier Signals: Provides signals 1-3 bars earlier during strong trends
• Fewer False Signals: Reduces whipsaws by 20-40% in choppy markets
• Better Divergence Detection: More reliable divergence signals through adaptive smoothing
• Enhanced Robustness: Performs consistently across different market conditions
Adaptation Benefits:
• Market Regime Flexibility: Automatically adjusts to bull/bear market characteristics
• Volatility Responsiveness: Adapts to high and low volatility environments
• Time Frame Versatility: Consistent performance from intraday to weekly charts
• Instrument Agnostic: Effective across stocks, forex, commodities, and cryptocurrencies
Computational Efficiency:
• Real-time Processing: Efficient calculation suitable for live trading
• Memory Management: Optimized for Pine Script performance requirements
• Scalability: Handles multiple symbol analysis without performance degradation
Limitations and Considerations:
• Learning Period: Requires several bars to establish adaptation pattern
• Parameter Sensitivity: Performance varies with Fast/Slow Limit settings
• Market Condition Dependency: Adaptation effectiveness varies by market type
• Complexity Factor: More parameters to optimize compared to basic MACD
Usage Notes:
This indicator is designed for technical analysis and educational purposes. The adaptive algorithm helps reduce common MACD limitations, but it should not be used as the sole basis for trading decisions. Algorithm performance varies with market conditions, and past characteristics do not guarantee future results. Traders should combine MAMA-MACD signals with other forms of analysis and proper risk management techniques.

Uptrick: Supply and Demand Zones with RSI, MACD and TP signalsUptrick: Supply and Demand Zones with RSI, MACD Signals and TP Signals
This script is a comprehensive technical analysis indicator for the TradingView platform, combining multiple strategies and indicators to assist traders in making informed decisions. The script incorporates supply and demand zones, Relative Strength Index (RSI), Moving Average Convergence Divergence (MACD) signals, and trend and take profit signals. Below is a detailed explanation of each feature, its purpose, how to use it, and how it differs from other indicators.
Key Features
Supply and Demand Zones:
Purpose: Identify key price levels where buying (demand) or selling (supply) pressure has historically been strong.
Inputs:
supplySwingLength (Default: 20): Determines the number of bars to consider for identifying swing highs for supply zones.
demandSwingLength (Default: 20): Determines the number of bars to consider for identifying swing lows for demand zones.
zoneExtensionBars (Default: 50): Specifies how many bars to extend the zones to the right for visibility.
Usage: The indicator highlights these zones on the chart, making it easier for traders to spot potential reversal points.
Relative Strength Index (RSI) and Moving Average of RSI:
Purpose: RSI measures the speed and change of price movements, helping to identify overbought or oversold conditions. The moving average of RSI smoothens the RSI values to reduce noise.
Inputs:
lengthrsi (Default: 14): The period for calculating RSI.
lengthrsima (Default: 8): The period for calculating the moving average of RSI.
Usage: Buy and sell signals are generated when the RSI crosses above or below the 50 level, respectively, indicating potential entry or exit points.
MACD (Moving Average Convergence Divergence):
Purpose: MACD is a trend-following momentum indicator that shows the relationship between two moving averages of a security’s price.
Inputs:
macdFastLength (Default: 12): The short period for the fast EMA.
macdSlowLength (Default: 26): The long period for the slow EMA.
macdSignalSmoothing (Default: 9): The period for the signal line.
Usage: Buy and sell signals are generated when the MACD line crosses above or below the signal line, respectively. This is an optional feature that can be enabled or disabled.
Signal Type Selection:
Purpose: Allows the trader to choose between RSI signals or supply/demand zone signals.
Inputs:
signalType (Default: "RSI"): Options are "RSI" or "Supply/Demand".
Usage: The chosen signal type determines the logic for plotting buy and sell signals on the chart.
Take Profit Signals:
Purpose: Provide take profit signals based on statistical volatility.
Inputs:
TheLength (Default: 20): The period for calculating the basis SMA and standard deviation.
tpmult (Default: 2.5): The multiplier for the standard deviation to set the take profit levels.
Usage: Generates buy and sell take profit signals when the price crosses over or under the calculated levels.
Detailed Explanation
Supply and Demand Zones Logic:
Swing High and Swing Low:
Functions isSwingHigh and isSwingLow determine whether the current high or low is the highest or lowest within a specified length, indicating potential supply or demand zones.
Zone Visualization:
When a new swing high or low is detected, a box is drawn from the identified bar and extended to the right for visibility. This helps traders visually identify these critical zones.
The boxes are updated dynamically as new swings are detected, ensuring the most relevant zones are always displayed.
RSI and MACD Signals:
RSI Calculation:
The script calculates the RSI using the specified period and then smooths it using an exponential moving average.
Buy and sell signals are generated based on the RSI's crossover with the 50 level.
MACD Calculation:
The MACD line and signal line are calculated using the specified periods.
Buy and sell signals are generated based on crossovers between the MACD line and the signal line.
These signals can be enabled or disabled based on user preference.
Trend Detection and Take Profit Signals:
Trend Detection:
The script calculates the basis (SMA) and upper and lower bands based on the standard deviation.
It determines the trend strength and direction by comparing the current price to these bands.
Take Profit Levels:
Take profit levels are set by multiplying the standard deviation by a user-defined multiplier.
Signals are plotted when the price crosses these take profit levels, indicating potential exit points.
Differences from Other Indicators
Combination of Multiple Indicators:
This script integrates supply and demand zones with RSI and MACD signals, offering a comprehensive tool for technical analysis.
Most other indicators focus on a single strategy, whereas this script provides a holistic view by combining multiple strategies.
Customizable Inputs:
The script offers a high degree of customization, allowing traders to adjust various parameters to suit their trading style and preferences.
Many indicators have fixed settings, limiting their adaptability to different market conditions.
Dynamic Zone Visualization:
The supply and demand zones are dynamically updated, providing real-time insights into key price levels.
This feature is not commonly found in other indicators, which may rely on static levels or less visually intuitive methods.
Usage Guide
Setup:
Add the script to your TradingView chart.
Adjust the input parameters as needed to match your trading strategy.
Interpreting Signals:
Supply and Demand Zones: Look for potential reversal points at these zones.
RSI and MACD Signals: Use these signals to identify potential entry and exit points.
Take Profit Signals: Set take profit levels based on the calculated signals to manage risk and lock in profits.
Combining Signals:
Combine signals from different features to increase the reliability of your trading decisions.
For example, a buy signal from RSI combined with a price approaching a demand zone may indicate a stronger buy opportunity.
Inputs Explained
Supply and Demand Zones:
supplySwingLength: The length of bars to consider for identifying swing highs.
demandSwingLength: The length of bars to consider for identifying swing lows.
zoneExtensionBars: The number of bars to extend the zones to the right.
RSI:
lengthrsi: The period for calculating the RSI.
lengthrsima: The period for calculating the EMA of the RSI.
MACD:
macdFastLength: The short period for the fast EMA.
macdSlowLength: The long period for the slow EMA.
macdSignalSmoothing: The period for the signal line.
Signal Type:
signalType: Choose between "RSI" and "Supply/Demand" signals.
Take Profit:
TheLength: The period for calculating the basis SMA and standard deviation.
tpmult: The multiplier for the standard deviation to set the take profit levels.
Conclusion
The "Uptrick: Supply and Demand Zones with RSI, MACD Signals and TP signals" script is a powerful and versatile indicator that combines multiple strategies to provide traders with a comprehensive analysis tool. Its detailed visualization of supply and demand zones, coupled with RSI and MACD signals, and trend-based take profit signals, makes it an invaluable tool for both novice and experienced traders. By understanding and utilizing its features effectively, traders can make more informed and confident trading decisions.

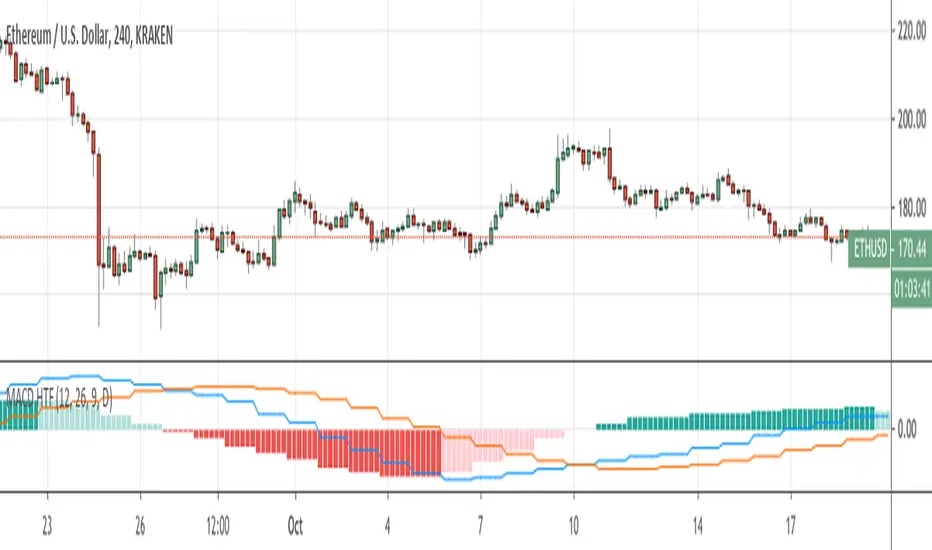
MACD-V with Volatility Normalisation [DCD]MACD-V with Volatility Normalisation
This indicator is a modified version of the traditional MACD, designed to account for market volatility by normalizing the MACD line using the Average True Range (ATR). It provides a more adaptive approach to identifying momentum shifts and potential trend reversals. This indicator was developed by Alex Spiroglou in this paper:
Spiroglou, Alex, MACD-V: Volatility Normalised Momentum (May 3, 2022).
Features:
Volatility Normalization: The MACD line is adjusted using ATR to standardize its values across different market conditions.
Customizable Parameters: Users can adjust the MACD fast length, slow length, signal line smoothing, and ATR length to suit their trading style.
Histogram Visualization: The histogram highlights the difference between the MACD and signal lines, with customizable colors for positive and negative momentum.
Crossover Signals: Green and red dots indicate bullish and bearish crossovers between the MACD and signal lines.
Background Highlighting: The chart background changes to green when the MACD is above 0 and red when it is below 0, providing a clear visual cue for bullish and bearish conditions.
Horizontal Levels: Dotted horizontal lines are plotted at key levels for better visualization of MACD values.
How to Use:
Look for crossovers between the MACD and signal lines to identify potential buy or sell signals.
Use the histogram to gauge the strength of momentum.
Pay attention to the background color for quick identification of bullish (green) or bearish (red) conditions.
This indicator is ideal for traders who want a more dynamic MACD that adapts to market volatility. Customize the settings to align with your trading strategy and timeframe.

MACD Based Price Forecasting [LuxAlgo]The MACD Based Price Forecasting tool is an innovative price forecasting method based on signals generated by the MACD indicator.
The forecast includes an area which can help traders determine the area where price can develop after a MACD signal.
🔶 USAGE
The forecast returned by the tool allows users to obtain a general picture of how price tends to progress after a specific MACD signal. The forecast is constructed based on percentiles of previous price progressions done after a specific MACD signal is generated.
Users can change which condition is used to generate MACD signals from the "Trend Determination" dropdown menu, with "MACD" determining trends based on whether the MACD is positive (uptrend) or negative (downtrend) and "MACD-Signal" determining trends based on the position of the MACD relative to its signal line, with an MACD above the signal line indicating an uptrend, else a downtrend.
Users can introduce bias to the forecast by changing the "Average Percentage" setting, with values above 50% introducing bullish bias, and below bearish bias.
It can be possible for the forecast to highlight potential reversals depending on the selected forecasting horizon as long as reversals can be observed on trends detected by the MACD.
🔹 Forecasting Area
The forecasting area can help visualize the area that will likely contain price after a specific signal. The area width is based on the "Top/Bottom Percentiles" settings, with a higher "Top Percentile" value returning a higher top bound and a lower "Bottom Percentile" value returning a lower bottom bound.
These areas can also serve as potential support/resistance areas.
🔶 SETTINGS
Fast Length: Fast length of the moving average used to compute the MACD
Slow Length: Slow length of the moving average used to compute the MACD
Signal Length: Length of the MACD moving average.
Trend Determination: Method used to determine a trend direction from the MACD.
🔹 Forecast
Maximum Memory: Determines the maximum amount of prices recorded at each steps succeeding a signal. Lower values will return forecasts with a higher degree of variability.
Forecasting Length: Forecasting horizon in bars, this value only serves as a limit of the forecasting horizon and might not be reached depending on user selected MACD settings.
Top Percentile: Percentile value used to determine the upper bound of the forecasting area.
Average Percentile: Percentile value used to determine the forecast.
Lower Percentile: Percentile value used to determine the lower bound of the forecasting area.
Black MACDBlack MACD is combination of MACD / Awesome Oscillator / Wavetrend Oscillator / BB Squeeze (Multi Oscillator) with many features like Multi Symbol support, Dual Divergence, MACD Cross over/under and completely customizable.
MACD Oscillator
Awesome Oscillator
Wavetrend Oscillator
Bollinger Bands Squeeze
Multi Symbol
Dual Divergence
MACD Cross over/under
Full Customization
Multi Symbol
Bollinger Bands Squeeze
Dual Divergence
MACD Cross
Awesome Oscillator
Wavetrend Oscillator
What is Moving Average Convergence Divergence – MACD?
The most popular indicator used in technical analysis, Moving average convergence divergence ( MACD ) reveal changes in the strength, direction, momentum, and duration of a trend in a financial instrument’s price. It's a trend-following momentum indicator that shows the relationship between two moving averages of a security’s price. The MACD is calculated by subtracting the 26-period exponential moving average ( EMA ) from the 12-period EMA.
The MACD indicator is typically good for identifying three types of basic signals;
Signal Line Crossovers
A Signal Line Crossover is the most common signal produced by the MACD . On the occasions where the MACD Line crosses above or below the Signal Line, that can signify a potentially strong move. The standard interpretation of such an event is a recommendation to buy if the MACD line crosses up through the Signal Line (a "bullish" crossover), or to sell if it crosses down through the Signal Line (a "bearish" crossover). These events are taken as indications that the trend in the financial instrument is about to accelerate in the direction of the crossover.
Zero Line Crossovers
Zero Line Crossovers occur when the MACD Line crossed the Zero Line and either becomes positive (above 0) or negative (below 0). A change from positive to negative MACD is interpreted as "bearish", and from negative to positive as "bullish". Zero crossovers provide evidence of a change in the direction of a trend but less confirmation of its momentum than a signal line crossover
Divergence
Divergence is another signal created by the MACD . Simply, divergence occurs when the MACD and actual price are not in agreement. A "positive divergence" or "bullish divergence" occurs when the price makes a new low but the MACD does not confirm with a new low of its own. A "negative divergence" or "bearish divergence" occurs when the price makes a new high but the MACD does not confirm with a new high of its own. A divergence with respect to price may occur on the MACD line and/or the MACD Histogram
Moving Average Crossovers, another hidden signal that MACD Indicator identifies
Many traders will watch for a short-term moving average to cross above a longer-term moving average and use this to signal increasing upward momentum. This bullish crossover suggests that the price has recently been rising at a faster rate than it has in the past, so it is a common technical buy sign. Conversely, a short-term moving average crossing below a longer-term average is used to illustrate that the asset's price has been moving downward at a faster rate and that it may be a good time to sell.
Moving Average Crossovers in reality is Zero Line Crossovers, the value of the MACD indicator is equal to zero each time the two moving averages cross over each other. For easy interpretation by trades, Zero Line Crossovers are simply described as positive or negative MACD
False signals
Like any forecasting algorithm, the MACD can generate false signals. A false positive, for example, would be a bullish crossover followed by a sudden decline in a financial instrument. A false negative would be a situation where there is bearish crossover, yet the financial instrument accelerated suddenly upwards
What is Awesome Oscillator?
The Awesome Oscillator is an indicator used to measure market momentum. AO calculates the difference of a 34 Period and 5 Period Simple Moving Averages. The Simple Moving Averages that are used are not calculated using closing price but rather each bar's midpoints. AO is generally used to affirm trends or to anticipate possible reversals.
Disclaimer: DYOR. Not financial advice. Not a trading system. I am not affiliated with TradingView or any authors mentioned here; You alone have the sole responsibility of evaluating the script output and risks associated with the use of the script. Trading success is all about following your trading strategy and the indicators should fit within your trading strategy, and not to be traded upon solely. Always trade with confluence and Risk Management.
Feedback & Bug report
if you found any bug in this indicator or any suggestion, please let me know. Please give feedback & appreciate if you like to see more future updates and indicators. Thank you
Check out Black RSI indicator:

REDWOOD MTF MacD
This MTF MacD is a custom made indicator to show trends and potential trend changes.
As you see the MTF MacD is colored depending on the trend and if MacD is above or below the Signal.
This indicator shows the crossover or crossunder of these plots with the colored circles that
are plotted. This can be a very useful indicator to show you a start of a new trend or a trend that
is weak, giving you ideas of when to take profit or enter a new trade.
For more information on MacD in general (for reference) Please see the detailed
description here : www.investopedia.com
This MacD is a Multi Time frame MacD, meaning it can show you higher or lower timeframes of the MacD no matter what current time frame your chart is on. This is
applied in the settings of the indicator by default, with a default timeframe of 4hr.
You can easily change back to the current time frame by checking the box "Use Current MacD Timeframe?". This can be very useful to get into a trend early, entering or exiting on low time frame bars while seeing the live Long time frame MacD. This can help reassure a position if the asset dips, or see if the asset is having one last push up before the fall.
The inputs of Fast ema, Slow ema, signal length can be customized to your liking.
There are inputs that will remove the MacD & Signal crosses, the histogram, or the MacD in general, there are also inputs you can apply that shows when the macd is changing its trend and pivoting.
For trading with this indicator, it works very well with a indicator confirming the position or potential change that is happening, I recommend the RSI or StochRSI. Specifically, the REDWOOD MTF Stochastic RSI .
When MacD line crosses over the Signal (black) line and is showing the MacD line lime, with the Histogram showing aqua or light blue,
this is when to take a Long or buy position.
When MacD line crosses under the Signal (black) line and is showing the MacD line red, with the Histogram showing red, this is when to take a short or sell position.
To filter out false crosses or trades, this is where I recommend the MTF stoch or RSI, taking trades on the MacD when the Stoch or RSI is showing signs of overbought or oversold areas. These provide the strongest signals and buy and sell positions.
This is recommended as a swing indicator , but can be used for scalping at your own risk.
As for recommended time frames to use for the MTF settings, I would stick to longer timeframes to show the overall trend. With that being said, it can be used on shorter timeframes as well and works good. I would sick to the 1hr or 4hr timeframes, and for lower I recommend the 15min or 30min timeframes.
The lower you go the more signals will be provided, but with that lots more false signals will show as well if the asset is volatile.
All settings, colors, and plots can be customized, and all are labeled to make it easy for you.
Alerts for each setting will be added in the future for simplicity, as of now the alerts can be made as usual, having the indicator plot MacD crossing the indicator plot Signal, telling you of a change in the MacD.
This can be a very useful indicator, and I'm sure some may find settings that work even better than the default or recommended settings.
This indicator works on all markets, forex, cryptocurrency, and stocks.
For access to this and all indicators available, please DM me here or See profile.
We are here to help each other succeed! The more one succeeds the more we all succeed! We are all in this
together and every person deserves to be financially independent and confident when taking trades
and investing.

RSI, SRSI, MACD and DMI cross - Open source codeHello,
I'm a passionate trader who has spent years studying technical analysis and exploring different trading strategies. Through my research, I've come to realize that certain indicators are essential tools for conducting accurate market analysis and identifying profitable trading opportunities. In particular, I've found that the RSI, SRSI, MACD cross, and Di cross indicators are crucial for my trading success.
Detailed explanation:
The RSI is a momentum indicator that measures the strength of price movements. It is calculated by comparing the average of gains and losses over a certain period of time. In this indicator, the RSI is calculated based on the close price with a length of 14 periods.
The Stochastic RSI is a combination of the Stochastic Oscillator and the RSI. It is used to identify overbought and oversold conditions of the market. In this indicator, the Stochastic RSI is calculated based on the RSI with a length of 14 periods.
The MACD is a trend-following momentum indicator that shows the relationship between two moving averages of prices. It consists of two lines, the MACD line and the signal line, which are used to generate buy and sell signals. In this indicator, the MACD is calculated based on the close price with fast and slow lengths of 12 and 26 periods, respectively, and a signal length of 9 periods.
The DMI is a trend-following indicator that measures the strength of directional movement in the market. It consists of three lines, the Positive Directional Indicator (+DI), the Negative Directional Indicator (-DI), and the Average Directional Index (ADX), which are used to generate buy and sell signals. In this indicator, the DMI is calculated with a length of 14 periods and an ADX smoothing of 14 periods.
The indicator generates buy signals when certain conditions are met for each of these indicators.
1) For the RSI, a buy signal is generated when the RSI is below or equal to 35 and the Stochastic RSI %K is below or equal to 15, or when the RSI is below or equal to 28 the Stochastic RSI %K is below or equal to 15 or when the RSI is below or equal to 25 and the Stochastic RSI %K is below or equal to 10 or when the RSI is below or equal to 28.
2) For the MACD, a buy signal is generated when the MACD line is below 0, there is a change in the histogram from negative to positive, the MACD line and histogram are negative in the previous period, and the current histogram value is greater than 0.
3) For the DMI, a buy signal is generated when the Positive Directional Indicator (+DI) crosses above the Negative Directional Indicator (-DI), and the -DI is less than the +DI.
The indicator generates sell signals when certain conditions are met for each of these indicators:
1) For the RSI, a sell signal is generated when the RSI is above or equal to 75 and the Stochastic RSI %K is above or equal to 85, or when the RSI is above or equal to 80 and the Stochastic RSI %K is above or equal to 85, or when the RSI is above or equal to 85 and the Stochastic RSI %K is above or equal to 90 or when the RSI is above or equal to 82.
2)For the MACD, a sell signal is generated when the MACD line is above 0, there is a change in the histogram from positive to negative, the MACD line and histogram are positive in the previous period, and the current histogram value is less than the previous histogram value. On the other hand, a buy signal is generated when the MACD line is below 0, there is a change in the histogram from negative to positive, the MACD line and histogram are negative in the previous period, and the current histogram value is greater than the previous histogram value.
3)For the DMI a bearish signal is generated when plusDI crosses above minusDI, indicating that bulls are losing strength and bears are taking control.
The indicator uses a combination of these four indicators to generate potential buy and sell signals. The buy signals are generated when RSI and SRSI values are in oversold conditions, while sell signals are generated when RSI and SRSI values are in overbought conditions. The indicator also uses MACD crossovers and DMI crossovers to generate additional buy and sell signals.
When a signal is strong?
The use of multiple signals within a specific timeframe can increase the accuracy and reliability of the signals generated by this indicator. It is recommended to look for at least two signals within a range of 5-8 candles in order to increase the probability of a successful trade.
Why it's original?
1) There is no indicator in the library that combine all of these indicators and give you a 360 view
2)The combination of the RSI, Stochastic RSI, MACD, and DMI indicators in a single script it's unique and not available in the libray.
3)The specific parameters and conditions used to calculate the signals may be unique and not found in other scripts or libraries.
4)The use of plotshape() to plot the signals as shapes on the chart may be unique compared to other scripts that simply plot lines or bars to indicate signals.
5)The use of alertcondition() to trigger alerts based on the signals may be unique compared to other scripts that do not have custom alert functionality.
Keep attention!
It is important to note that no trading indicator or strategy is foolproof, and there is always a risk of losses in trading. While this indicator may provide useful information for making conclusions, it should not be used as the sole basis for making trading decisions. Traders should always use proper risk management techniques and consider multiple factors when making trading decisions.
Support me:)
If you find this new indicator helpful in your trading analysis, I would greatly appreciate your support! Please consider giving it a like, leaving feedback, or sharing it with your trading network. Your engagement will not only help me improve this tool but will also help other traders discover it and benefit from its features. Thank you for your support!

MACD ReLoadedA different approach to Gerald Appel's classical Moving Average Convergence Divergence.
Appel originaly set MACD with exponential moving averages.
In this version users can apply 11 different types of moving averages which they can benefit from their smoothness and vice versa sharpnesses...
Built in Moving Average type defaultly set as VAR but users can choose from 11 different Moving Average types like:
SMA : Simple Moving Average
EMA : Exponential Moving Average
WMA : Weighted Moving Average
DEMA : Double Exponential Moving Average
TMA : Triangular Moving Average
VAR : Variable Index Dynamic Moving Average a.k.a. VIDYA
WWMA : Welles Wilder's Moving Average
ZLEMA : Zero Lag Exponential Moving Average
TSF : True Strength Force
HULL : Hull Moving Average
TILL : Tillson T3 Moving Average
In shorter time frames backtest results shows us TILL, WWMA, VIDYA (VAR) could be used to overcome whipsaws because they have less numbers of signals.
In longer time frames like daily charts WMA, Volume Weighted MACD V2, and MACDAS and SMA are more accurate according to backtest results.
My interpretation of Buff Dormeier's Volume Weighted MACD V2:
Thomas Aspray's MACD: (MACDAS)

MACD Moving Average Convergence/Divergence - DurbtradeDurbtrade MACD - macd line changes color based on vertical direction. This makes it easier to see and discern movements and also helps the indicator to retain maximum functionality when taking up less chart real estate (also, having the color change really helps me see charts on small screens... such as when it's bright outside and I'm driving in my car and glancing at a chart on my phone... it helps having the info pop visually). A fill option is included to fill the space between the macd and signal lines, though I personally prefer to disable this function. Also, you get a zero line if you want it, and it doesn't extend past the current time, removing unnecessary info and keeping your chart looking a bit cleaner. Finally, there are color-coded, cross-over and cross-under background fills, signaling when the macd line crosses the signal line.
This is my 2nd published script, and 2nd script ever. If you like this style, see my 1st published script: Durbtrade Bollinger Bands Width.
Hope you find this useful.
Feel free to comment.

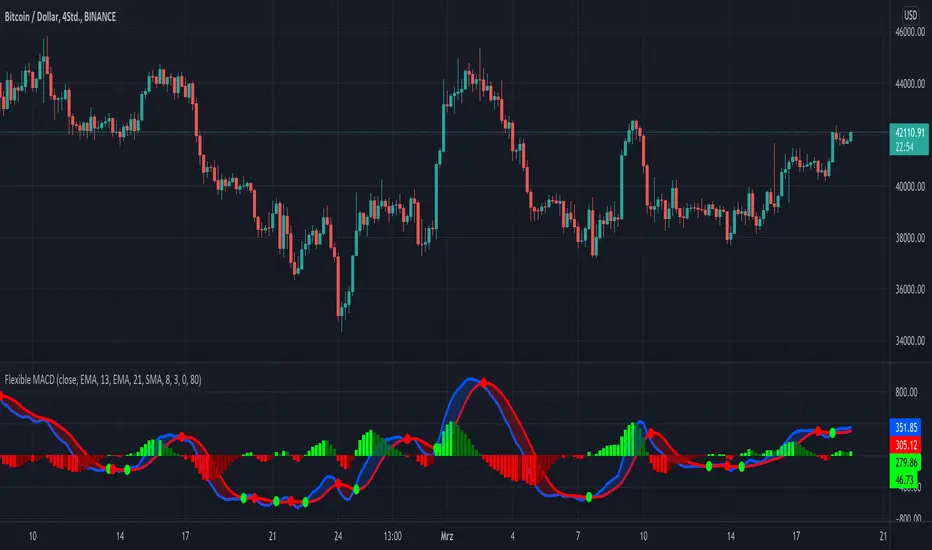
KINSKI Flexible MACDFlexible MACD (Moving Average Convergence/Divergence) Indicator
The Moving Average Convergence Divergence consists of three elements: two moving averages (the MACD line and the signal line) and a histogram. The blue MACD line is the difference between a longer and a shorter EMA (here 13 and 21 periods preset), the red signal line is an SMA (here 8 preset) on the MACD line. The histogram (green: ascending, red: descending) shows the difference between both lines.
As soon as the blue MACD line crosses the red signal line, circles are generated that indicate an up/down trend. If the red signal line is greater than or equal to the blue MACD line, this indicates a downward trend (red circle). If the blue MACD line is greater than or equal to the red signal line, this indicates an upward trend (green circle).
The special thing about this MACD indicator is the many setting options, especially the definition of the MA variants for MACD (Fast, Slow) and signal. You can define the following MA types: "COVWMA", "DEMA", "EMA", "EHMA", "FRAMA", "HMA", "KAMA", "RMA", "SMA", "SMMA", "VIDYA", "VWMA", "WMA".
You also have the following display options:
- "Up/Down Movements: On/Off" - Shows ascending and descending MACD, signal lines
- "Up/Down Movements: Rising Length" - Defines the length from which ascending or descending lines are detected
- "Bands: On/Off" - Fills the space between MACD and signal lines with colors to indicate up or down trends
- "Bands: Transparency" - sets the transparency of the fill color
Disclaimer: I am not a financial advisor. For purpose educate only. Use at your own risk.
SCOTTGO Advanced MACD🌟 Custom MACD: Enhanced Visuals & Crossover Signals
This indicator is a highly customized version of the traditional Moving Average Convergence Divergence (MACD) oscillator, designed to provide clear, immediate visual confirmation of signal line crossovers and zero-line crossings.
Core Features:
MACD Crossover Shadow Fill: The area between the MACD line and the Signal line is filled with a customizable shadow. This instantly visualizes whether the MACD is above (bullish crossover) or below (bearish crossover) the Signal line.
Signal Crossover Markers (Arrows & Dots):
Crossover Dot: A small, configurable solid dot is plotted exactly at the point where the MACD and Signal lines intersect, providing pinpoint accuracy for the crossover event.
Crossover Arrows: Customizable up (green) and down (red) arrows are plotted using a small numerical offset from the crossover point, ensuring visibility without cluttering the indicator lines.
Zero-Line Crossing Markers: Distinct, small markers (circles/diamonds) are used to signal when the MACD line crosses the zero line, indicating a shift in momentum relative to the baseline.
Customizable MA Type: The user can select either Exponential Moving Average (EMA) or Simple Moving Average (SMA) for both the MACD oscillator calculation and the signal line calculation.
This indicator is ideal for traders who rely on MACD crossovers and require precise, configurable visual feedback directly on the chart.

Combo RSI + MACD + ADX MTF (Avec Alertes)✅ Recommended Title:
Multi-Signal Oscillator: ADX Trend + DI + RSI + MACD (MTF, Cross Alerts)
✅ Detailed Description
📝 Overview
This indicator combines advanced technical analysis tools to identify trend direction, capture reversals, and filter false signals.
It includes:
ADX (Multi-TimeFrame) for trend and trend strength detection.
DI+ / DI- for directional bias.
RSI + ZLSMA for oscillation analysis and divergence detection.
Zero-Lag Normalized MACD for momentum and entry timing.
⚙️ Visual Components
✅ Green/Red Background: Displays overall trend based on Multi-TimeFrame ADX.
✅ DI+ / DI- Lines: Green and red curves showing directional bias.
✅ Normalized RSI: Blue oscillator with orange ZLSMA smoothing.
✅ Zero-Lag MACD: Violet or fuchsia/orange oscillator depending on the version.
✅ Crossover Points: Colored circles marking buy and sell signals.
✅ ADX Strength Dots: Small black dots when ADX exceeds the strength threshold.
🚨 Included Alert System
✅ RSI / ZLSMA Crossovers (Buy / Sell).
✅ MACD / Signal Line Crossovers (Buy / Sell).
✅ DI+ / DI- Crossovers (Buy / Sell).
✅ Double Confirmation DI+ / RSI or DI+ / MACD.
✅ Double Confirmation DI- / RSI or DI- / MACD.
✅ Trend Change Alerts via Background Color.
✅ ADX Strength Alerts (Above Threshold).
🛠️ Suggested Configuration Examples
1. Short-Term Reversal Detection:
RSI Length: 7 to 14
ZLSMA Length: 7 to 14
MACD Fast/Slow: 5 / 13
ADX MTF Period: 5 to 15
ADX Threshold: 15 to 20
2. Long-Term Trend Following:
RSI Length: 21 to 30
ZLSMA Length: 21 to 30
MACD Fast/Slow: 12 / 26
ADX MTF Period: 30 to 50
ADX Threshold: 20 to 25
3. Scalping / Day Trading:
RSI Length: 5 to 9
ZLSMA Length: 5 to 9
MACD Fast/Slow: 3 / 7
ADX MTF Period: 5 to 10
ADX Threshold: 10 to 15
🎯 Why Use This Tool?
Filters false signals using ADX-based background coloring.
Provides multi-source alerting (RSI, MACD, ADX).
Helps identify true market strength zones.
Works on all markets: Forex, Crypto, Stocks, Indices.

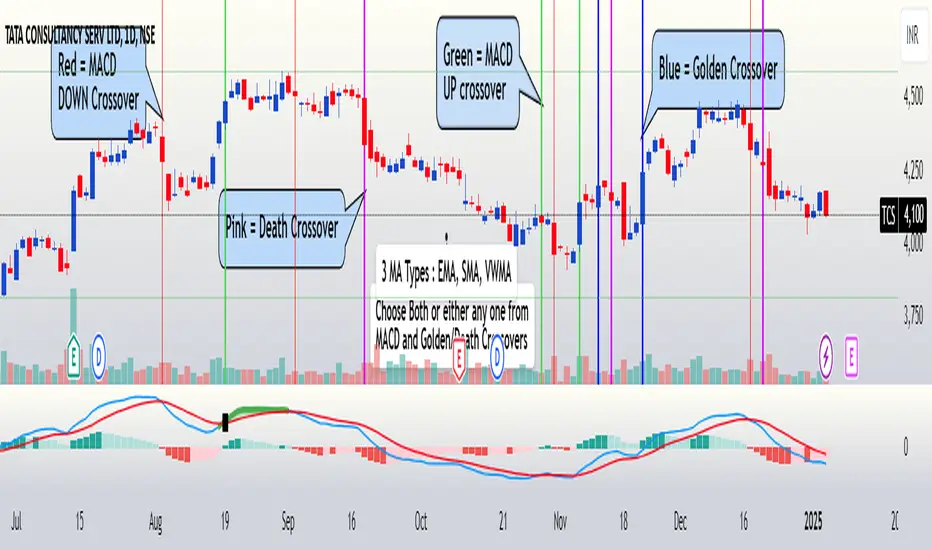
FuTech : MACD Crossovers Advanced Alert Lines=============================================================
Indicator : FuTech: MACD Crossovers Advanced Alert Lines
Overview:
The "FuTech: MACD Crossovers Advanced Alert Lines" indicator is designed to assist traders in identifying key technical patterns using the :-
1. MACD (Moving Average Convergence Divergence) and
2. Golden/Death Crossovers
By visualizing these indicators directly on the chart with advanced lines, it helps traders make more informed decisions on when to enter or exit trades.
=============================================================
Key Features of "FuTech: MACD Crossovers Advanced Alert Lines":
1. MACD Crossovers:
a) The MACD is one of the most widely used indicators for identifying momentum shifts and potential buy/sell signals. This indicator plots vertical lines on the chart whenever the MACD line crosses the signal line.
b) Upward Crossover (Bullish Signal) : When the MACD line crosses above the signal line, a green vertical line will appear, indicating a potential buying opportunity.
c) Downward Crossover (Bearish Signal) : When the MACD line crosses below the signal line, a red vertical line will appear, signaling a potential selling opportunity.
2. Golden Cross & Death Cross:
a) The Golden Cross occurs when the price moves above a long-term moving average (like the 50-day moving average), signaling a potential upward trend.
b) The Death Cross occurs when the price moves below a long-term moving average, signaling a potential downward trend.
c) These crossovers are displayed with customizable lines on the chart to easily spot when the market is shifting direction.
d) Golden Cross (Bullish Signal) : A blue vertical line appears when the price crosses above the selected long-term moving average.
e) Death Cross (Bearish Signal) : A purple vertical line appears when the price crosses below the selected long-term moving average.
=============================================================
Customization Options:
This indicator offers several customization options to suit your trading preferences:
1) MACD Settings:
a) Choose between different moving average types (EMA, SMA, or VWMA) for calculating the MACD.
b) Adjust the lengths of the fast, slow, and signal MACD periods.
c) Control the width and color of the vertical lines drawn on the chart for both up and down crossovers.
2) Golden Cross / Death Cross Settings:
a) Select the moving average type for the Golden Cross / Death Cross (EMA, SMA, or VWMA).
b) Define the lookback period for calculating the Golden Cross / Death Cross.
c) Customize the appearance of the Golden and Death Cross lines, including their width and color.
You can use both as well as either of the MACD lines or Golden Crossover / Death Crossover Lines respectively as per your trading strategies
=============================================================
How "FuTech: MACD Crossovers Advanced Alert Lines" indicator Works:
a) The indicator monitors the price and calculates the MACD and Golden/Death Crosses.
b) When the MACD line crosses above or below the signal line, or when the price crosses above or below the long-term moving average, it plots a vertical line on the chart.
c) These lines help traders quickly spot potential turning points in the market, providing clear signals to act upon.
=============================================================
Use Case:
a) Swing Traders: The indicator is useful for spotting momentum shifts and trend reversals, helping you time entries and exits for short- to medium-term trades.
b) Long-Term Traders: The Golden and Death Cross signals help identify major trend changes, giving insights into potential market shifts.
=============================================================
Why Use This "FuTech: MACD Crossovers Advanced Alert Lines" Indicator ?
a) Clear Visuals : The vertical lines provide clear and easy-to-spot signals for MACD crossovers and Golden/Death Crosses.
b) Customizable : Adjust settings for your personal trading strategy, whether you're focusing on short-term momentum or long-term trend shifts.
c) Supports Decision Making : With its advanced line plotting and customizable features, this indicator helps you make quicker and more informed trading decisions.
=============================================================
How to Use:
a) MACD Crossovers: Look for green lines to signal potential buying opportunities (when the MACD line crosses above the signal line) and red lines for selling opportunities (when the MACD line crosses below the signal line).
b) Golden Cross / Death Cross: Use the blue lines to confirm when a positive trend may begin (Golden Cross) and purple lines to warn when a negative trend may start (Death Cross).
=============================================================
Conclusion:
"FuTech: MACD Crossovers Advanced Alert Lines" indicator combines two powerful technical analysis tools, the MACD and Golden/Death Crosses, to provide clear, actionable signals on your chart.
By customizing the appearance of these signals and combining them with your trading strategy, you can enhance your decision-making process and improve your trading outcomes.
=============================================================
Thank you !
Jai Swaminarayan Dasna Das !
He Hari ! Bas Ek Tu Raji Tha !
=============================================================
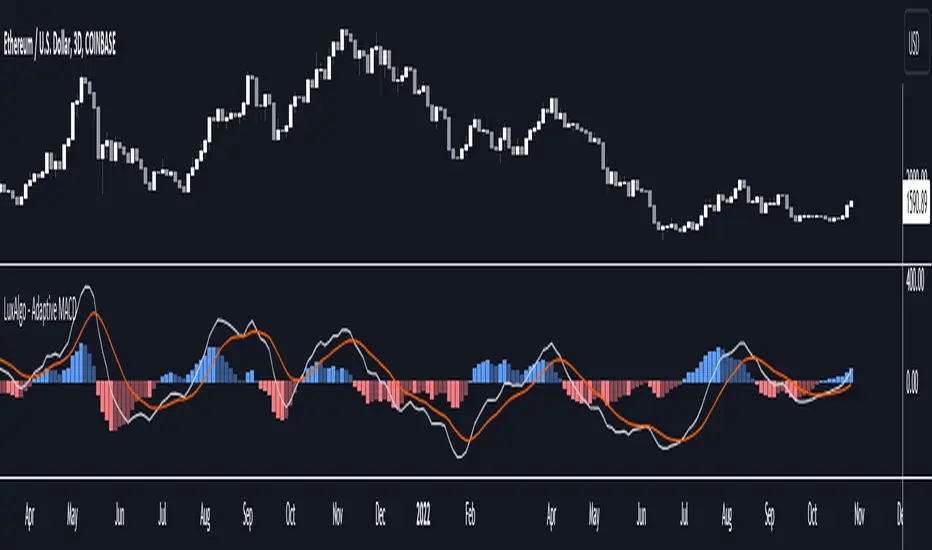
Adaptive MACD [LuxAlgo]The Adaptive MACD indicator is an adaptive version of the popular Moving Average Convergence Divergence (MACD) oscillator, returning longer-term variations during trending markets and cyclic variations during ranging markets while filtering out noisy variations.
🔶 USAGE
The proposed oscillator contains all the elements within a regular MACD, such as a signal line and histogram. A MACD value above 0 would indicate up-trending variations, while a value under 0 would be indicating down-trending variations.
Just like most oscillators, our proposed Adaptive MACD is able to return divergences with the price.
As we can see in the image above ranging markets will make the Adaptive MACD more conservative toward more cyclical conservations, filtering out both noise and longer-term variations. However, when longer-term variations (such as in a trending market) are prominent the oscillator will conserve longer-term variations.
The R2 Period setting determines when trending/ranging markets are detected, with higher values returning indications for longer intervals.
The fast and slow settings will act similarly to the regular MACD, however, closer values will return more cyclical outputs.
The image above compares our proposed MACD (top) with a regular MACD (bottom), both using fast = 19 and slow = 20 .
🔶 DETAILS
It is common to be solely interested in the trend component when the market is trending, however, during a ranging market it is more common to observe a more prominent cyclical/noise component. We want to be able to preserve one of the components at the appropriate market conditions, however, the regular MACD lack the ability to preserve cyclical component with high accuracy.
The MACD is an IIR bandpass filter. In order to obtain a lower passband bandwidth and a more symmetrical magnitude response (which would allow to conserve more precise cyclical variations) we can directly change the system calculation:
y = (price - price ) × g + ((1 - a1) + (1 - a2)) × y - (1 - a1) × (1 - a2) × y
where:
a1 = 2/(fast + 1)
a2 = 2/(slow + 1)
g = a1 - a2
Using division instead of multiplication on the second feedback weight allows further weighting the 2 samples lagged output, returning a more desirable magnitude response with a higher degree of filtering on both ends of the spectrum as shown in the image below:
We are interested in conserving cycles during ranging markets, and longer-term variations during trending markets, we can do this by interpolating between our two filter coefficients:
α × + (1 - α) ×
where 1 > α > 0 . α is measuring if the market is trending or ranging, with values closer to 1 indicating a trending market. We see that for higher values of α the original coefficient of the MACD is used. The image below shows various magnitude responses given multiple values of α :
We use a rolling R-Squared as α , this measurement has the benefit of indicating if the market is trending or ranging, as well as being constrained within range (0, 1), and having a U-shaped distribution.
If you are interested to learn more about the MACD see:
🔶 SETTINGS
R2 Period: Calculation window of the R-Squared.
Fast: Fast period for the calculation of the Adaptive MACD, lower values will return more noisy results.
Slow: Slow period for the calculation of the Adaptive MACD, higher values will return result with longer-term conserved variations.
Signal: Period of the EMA applied to the Adaptive MACD.
[CP]Pivot Boss Multi Timeframe CPR Inception with MACD and EMAINTRODUCTION:
This indicator combines multi-timeframe CPR bands with MACD Momentum and EMA trend, all projected on the candlestick chart through a novel visualization.
If you have seen my other indicators on TradingView, you would know that I use floor pivots a lot and “Secrets of a Pivot Boss” is my favorite book. While using floor pivots, time and again I have noticed an interesting price behavior,
Trending moves in price typically start from around the Central Pivot Range (CPR). The CPR could be from ANY timeframe. These moves can easily be caught using simple momentum and trend indicators like MACD and EMA crossovers.
Yes, it is that simple. Follow along to understand how to use this indicator.
INDICATOR SETTINGS:
RANGEBOUND MACD AND EMA MARKINGS:
TradingView limits the max number of labels that can be shown on a chart to 500. Therefore, if you go far back enough, you won't see any markings for the MACD or EMA setups. If you are looking to test the efficacy of this indicator in the past, change the start and end dates to your desired timeframe and then select the ‘Mark MACD and EMA Setups in Range?’ option.
MULTI TIMEFRAME CENTRAL PIVOT RANGE:
Here you can select CPRs and their bands from which timeframes are shown on the chart. I will share my favorite settings later in this description.
CPR CONFIGURATION:
Show CPR Labels: CPRs markings can carry labels, so that you don’t confuse between which line is what. Use this setting to toggle them On/Off.
Show Next Time Period Pivots: Check this option if you want to see the CPR of the next time period. This is typically done to figure out the ’Two Day CPR Relationship’ . Read the book, “Secrets of a Pivot Boss”, to understand more.
EMA TREND:
Show EMA on the Chart: EMAs will be plotted on the chart. Standard stuff.
Mark EMA Crossovers on Chart: EMA crossovers will be marked on the chart in diamond shapes. If you are using EMA crossovers, I recommend setting this option to True.
Rest of the EMA settings are fairly obvious.
MACD MOMENTUM:
Projecting MACD parameters directly on the candlesticks is surely going to give you a new perspective about price action and MACD.
Also, in order to better understand the MACD projections on the chart, you can add a standard MACD indicator on the chart with default settings to figure out what my indicator is actually showing you.
Marking MACD Crossovers on Chart: Marks the MACD signal crossovers on the chart. This visualization was a game changer for me.
Show MACD Histogram on Chart: Projects the complete MACD Histogram in a novel fashion (Try it!). You will be able to visually see the ebbs and flow of momentum in the charts.
Mark MACD Histogram Peaks on Chart: Marks only the MACD peaks instead of the complete histogram. Peaks are a great way to enter an ongoing trend and to play an intraday rangebound market.
Rest of the settings are just the standard settings that you will find in a typical MACD indicator.
ALERTS:
Not shown in the settings panel, but I have added alerts for EMA and MACD Crossovers so that you don’t have to sit in front of the charts or constantly check the price all day long.
If you don’t know how to set alerts in TradingView, then please Google it.
INDICATOR USAGE EXAMPLES:
This indicator can be used in intraday as well as in higher timeframes.
There are quite a few variations possible, I personally prefer to use the EMA crossovers in intraday (5m) and MACD on Daily timeframes.
This is just a matter of personal preference, some people might prefer using EMAs only or MACD only in all timeframes.
Here are my personal settings for the intraday 5-minute timeframe:
Turn on all the CPR pivots starting from Yearly all the way to Daily. You can turn on 6 hourly and 4 hourly as well if you want.
Hourly CPR is mostly used when the price is in a strong trend and you missed the entry and don’t know when to enter. Price will typically experience pullbacks towards the Hourly CPR, before resuming in the direction of the trend. That is your chance to hop onto the bandwagon.
For Intraday, I keep the Bands off. Just a personal preference here.
You can turn ON the Show CPR Labels , if you want.
Turn ON both the options in the EMA TREND section. You would want to see the EMA crossovers marked on the chart as well as the EMAs themselves, as the distance between the two EMAs will give you an idea about the strength of the trend.
Keep rest of the settings in the EMA section as default (you can change the colors if you wish). I keep the same EMAs as the ones kept in the MACD indicator. I like to keep things simple.
In the MACD MOMENTUM section, turn ON Mark MACD Histogram Peaks on Chart and all the other options turned OFF. Leave the other settings as default. By the way, these are the default settings of the standard MACD Indicator.
You can set up EMA Bullcross and Bearcross alarms if you like.
Before checking out the examples, remember one super simple rule:
SOME OF THE BEST TRENDING MOVES IN THE MARKET, BE IT INTRADAY OR OTHERWISE, ORIGINATE IN THE VICINITY OF A LARGER TIMEFRAME PIVOT/CPR.
Look for price settling above/below a pivot, and then a move away from the pivot in any direction is typically a trending move.
You can use hourly pivots or MACD Histogram peaks marked on the chart to enter an existing trend, or add to your positions.
Let’s have a look at a few recent intraday examples from the Crypto, Indian, and US equity markets.
I have added my comments in the charts to make you easily understand what is going on.
Understand that both, moving average crossover and MACD, will give out a lot of signals (chop) every day. But almost 70% of them are going to be fake signals. It is the signals that you get when the price is near a Pivot, that tend to convert into gorgeous trending moves that last.
BTC 5m Charts
NIFTY Futures 5m Charts (good intraday trends are hard to find here, as the market is very efficient)
TSLA 5m Charts
Some important points for using this indicator in higher timeframes:
For higher timeframes, my personal preference is to go with the MACD indicator. I personally find MACD to be lethal on daily and weekly timeframes, if you know how to use it well.
The default settings of the indicator are the settings I use for both, Daily and Weekly, timeframes. Additionally, I turn off the CPR labels.
In theory large trending moves still have a big probability to start near an important pivot level, however, in larger timeframes, trending moves can start from anywhere. They need not start in the vicinity of any important pivot (but they often do!).
Weekly pivots can act as great pullback levels when the price is in strong momentum, when trading on the daily timeframe.
Quarterly Pivots act as great pullback levels when the price is in strong momentum, when trading on the weekly timeframe.
BTC Weekly Chart
BTC Daily Chart
Nifty Weekly Chart
Nifty Daily Chart
NASDAQ Weekly Chart
NASDAQ Daily Chart
FINAL WORDS:
Please understand that I have Cherry Picked the examples to showcase the capability of the indicator and its usage.
DO NOT conflate the accuracy of examples with the accuracy of this indicator.
Biggest catch is the fact that this indicator, like every other indicator out there, will have whipsaws. Some I have also marked in the example charts.
You need to come up with your own technique to avoid whipsaws, one technique I have shared here…… big moves typically start near pivots.
Work on avoiding whipsaws and finding you own edge in the markets.
If you really want to learn how to use Pivots, read the book ’Secrets of a Pivot Boss’ . This book can change your life.

QuantNomad - EVWMA MACD StrategyPretty simple EVWMA (Elastic Volume Weighted Moving Average ) MACD Strategy.
EVWMA is a quite interesting moving average where the period of the MA is defined from the volume itself.
It incorporates volume information in a natural and logical way. The EVWMA can be looked at as an approximation to the average price paid per share.
As a volume period, you can use sum of the last x bars volumes.
Here are other EVWMA indicators/strategies:
EVWMA indicator:
EVWMA Cross strategy:

Standardized MACD Heikin-Ashi TransformedThe Standardized MACD Heikin-Ashi Transformed (St. MACD) is an advanced indicator designed to overcome the limitations of the traditional MACD. It offers a more robust and standardized measure of momentum, making it comparable across different timeframes and securities. By incorporating the Heikin-Ashi transformation, the St. MACD provides a smoother visualization of trends and potential reversals, enhancing its utility for traders seeking a clearer view of the underlying market direction.
Methodology:
The calculation of St. MACD begins with the traditional MACD, which computes the difference between two exponential moving averages (EMAs) of the price. To address the issue of non-comparability across assets, the St. MACD normalizes its values using the exponential average of the price's height. This normalization process ensures that the indicator's readings are not influenced by the absolute price levels, allowing for objective and quantitatively defined comparisons of momentum strength.
Furthermore, St. MACD utilizes the Heikin-Ashi transformation, which involves deriving candles from the price data. These Heikin-Ashi candles provide a smoother representation of trends and help filter out noise in the market. A predictive curve of Heikin-Ashi candles within the St. MACD turns blue or red, indicating the prevailing trend direction. This feature enables traders to easily identify trend shifts and make better informed trading decisions.
Advantages:
St. MACD offers several key advantages over the traditional MACD-
Standardization: By normalizing the indicator's values, St. MACD becomes comparable across different assets and timeframes. This makes it a valuable tool for traders analyzing various markets and seeking consistent momentum measurements.
Heikin-Ashi Transformation: The integration of the Heikin-Ashi transformation smoothes out the indicator's fluctuations and enhances trend visibility. Traders can more easily identify trends and potential reversal points, improving their market analysis.
Quantifiable Momentum: St. MACD's key levels represent the strength of momentum, providing traders with a quantifiable framework to gauge the intensity of market movements. This feature helps identify periods of increased or decreased momentum.
Utility:
The St. MACD indicator offers versatile utility for traders-
Trend Identification: Traders can use the color-coded predictive curve of Heikin-Ashi candles to swiftly determine the prevailing trend direction. This aids in identifying potential entry and exit points in the market.
Reversal Signals: Colored extremes within the St. MACD signal potential price reversals, alerting traders to potential turning points in the market. This assists in making timely decisions during market inflection points.
Overbought/Oversold Conditions: The histogram version of St. MACD can be used in conjunction with the bands to detect short-term overbought or oversold market conditions, allowing traders to adjust their strategies accordingly.
In conclusion, this tool addresses the limitations of the traditional MACD by providing a standardized and comparable momentum indicator. Its incorporation of the Heikin-Ashi transformation enhances trend visibility and assists traders in making more informed decisions. With its quantifiable momentum measurements and various utility features, the St. MACD is a valuable tool for traders seeking a clearer and more objective view of market trends and reversals.
Key Features:
Display Modes: MACD, Histogram or Hybrid
Reversion Triangles by adjustable thresholds
Bar Coloring Methods: MidLine, Candles, Signal Cross, Extremities, Reversions
Example Charts:
-Traditional limitations-
-Comparisons across time and securities-
-Showcase-
See Also:
-Other Heikin-Ashi Transforms-
