Rage of UltronRage of Ultron - Multi-Timeframe Smart Money Trading System
Advanced Confluence-Based Trading Indicator
Rage of Ultron is a comprehensive multi-timeframe trading system that combines Smart Money Concepts (SMC) with macro market context, RSI divergences, liquidity sweeps, and volume analysis to identify high-probability setups across all markets.
Key Features
Multi-Timeframe Alignment
* Weekly Bias - Directional trend context
* Daily Structure - Order Blocks and Fair Value Gaps
* 4H Confirmation - Entry timing and execution
* Real-time MTF alignment scoring (🟢 Bull Aligned / 🔴 Bear Aligned / 🟡 Mixed)
Smart Money Concepts
* Order Blocks (OB) - Institutional entry zones with visual clarity
* Fair Value Gaps (FVG) - Price imbalances and retracement magnets
* Change of Character (CHoCH) - Market structure breaks (▲▼)
* Liquidity Sweeps - Stop hunt detection before reversals (💧)
Technical Analysis
* RSI Divergences - Regular and hidden divergences with zones (◆)
* RSI Swing Failure Patterns - Grade-A reversal setups (★)
* Automatic Fibonacci - Dynamic retracements and extensions
* Volume Impulse Detection - Weighted confirmation signals
Macro Market Radar
* DXY - Dollar strength assessment
* BTC Dominance - Crypto market risk gauge
* USDT Dominance - Stablecoin flow analysis
* Combined risk environment scoring
Confluence Scoring System (0-7)
Quantified setup quality with three alert tiers:
* Tier 1 (Score 6-7): Full confluence + sweep + volume + MTF alignment
* Tier 2 (Score 5): High confluence + volume or sweep
* Tier 3 (Score 4): Standard confluence setups
"Rage" Volume State
* 🟢 RAGE PULSE - Explosive volume spike (score 6+ trigger)
* ⚡ Active - Strong volume with good confluence
* 🟡 Stable - Moderate volume conditions
* 🔴 Dormant - Low volume, wait for confirmation
Visual Design
* Clean Zone Rendering - Persistent OB/FVG boxes with limited extension
* Signal Bar Highlighting - Colored fills and contrasting borders for instant recognition
* Dynamic Symbol Placement - ATR-based offset prevents overlap
* Comprehensive Panel - Real-time macro + trade metrics in one view
* Toggleable Legend - Learn signals, hide once familiar
How to Use
1. Set Your Timeframes - Default 1W/1D/4H works for swing trading
2. Monitor Macro Environment - Check risk-on/off context
3. Wait for Confluence ≥4 - Let multiple signals align
4. Enter on Tier 1/2 Alerts - Best probability setups
5. Use Fib Extensions for Targets - Systematic profit taking
Customizable Settings
* Multi-timeframe periods
* RSI length and divergence sensitivity
* Liquidity sweep parameters
* Fibonacci swing lookback
* Volume thresholds
* Shape offset multiplier
* Visual toggles (Fibs, extensions, legend)
Built-in Alert System
Three-tier alert structure lets you filter by setup quality. Set alerts for Tier 1 only for highest conviction trades, or include Tier 2 for more opportunities.
Best Practices
* Use on clean timeframes - 1H+ for less noise
* Combine with support/resistance - Zones near key levels = highest probability
* Respect the macro - Don't fight extreme risk-off environments
* Wait for the full stack - Best trades have 4+ aligned signals
* Practice on demo first - Learn signal behavior in your market
Works On
* Cryptocurrency (spot & futures)
* Forex pairs
* Stock indices
* Individual stocks
* Commodities
Note: This indicator identifies potential setups but does not guarantee profits. Always use proper risk management, position sizing, and stops. Past performance does not predict future results.
Created by cdotgnz | For educational purposes
스크립트에서 "gaps"에 대해 찾기

Velocity SmartMoney Engine work - Delta Exchange📈 Velocity SmartMoney Engine
Adaptive Breakout & Order Block Strategy with Dynamic Risk Control
---
🔍 Overview
The Velocity SmartMoney Engine is a next-generation trading strategy that fuses Smart Money breakout logic , Order Block structure detection , and Supertrend-based directional filtering into one precision-built system.
It identifies institutional-level breakouts , manages positions with ATR-based adaptive risk , and executes disciplined exits using stop-loss, trailing stop, and profit target logic.
Designed for swing and short-term system traders, this strategy performs excellently on BTC, ETH, NIFTY, BANKNIFTY, Gold, and major FX pairs — best on 15m to 4h timeframes .
---
⚙️ Core Components
1️⃣ Smart Money Breakout Logic
Detects real breakouts using dynamic support/resistance pivots.
Confirms entries only during strong volatility bursts.
Avoids false breakouts in sideways markets.
2️⃣ Order Block Gap Detection
Finds institutional imbalance zones (Smart Money footprints).
Bullish gaps = Long bias; Bearish gaps = Short bias.
Works with candle confirmation and momentum validation.
3️⃣ Supertrend Directional Filter
Trades only in direction of Supertrend bias.
Exits instantly when Supertrend flips.
Prevents entries against dominant trend.
4️⃣ ATR-Based Risk & Volatility Filter
Uses ATR × multiplier for adaptive stop sizing.
Volatility filter ensures trades trigger only during active markets.
Avoids whipsaw zones.
---
💰 Position Management
Stop-Loss: Adaptive ATR-based.
Take-Profit: Default 5% target (editable input).
Trailing Stop: Auto-adjusts to lock profits.
No-Exit Hold: Hold position for defined candles before exits.
Supertrend Flip Exit: Instant trend-based closure.
---
🧠 Built-In Trade Discipline
One-trade-per-bar guard prevents duplicate entries.
Volatility-weighted breakout validation.
Clean and conflict-free exit hierarchy.
---
🎯 Key Features
✅ Smart Money breakout + Order Block fusion
✅ Supertrend-based trend confirmation
✅ ATR dynamic stop + 5% profit target
✅ Adaptive trailing logic
✅ One-trade-per-bar control
✅ Works across Crypto, Indices, FX, Commodities
✅ Ideal for 1h–4h swing setups
---
📊 Recommended Settings
Parameter | Typical Value | Purpose
--- | --- | ---
Levels Period | 20 | Pivot lookback for S/R zones
Volatility Filter | 20–40 | Filters out low-momentum areas
ATR Multiplier | 1.5 | Adjust stop size by volatility
Supertrend Length | 10 | ATR period for trend bias
Supertrend Multiplier | 3.0 | Supertrend sensitivity
Target Profit | 5% | Default take-profit level
---
⚡ Suggested Use
• Best suited for swing entries on 1H / 4H charts .
• Combine with session filters or trend confluence for automation.
• Ideal as a base module for TradingView + Broker integrations .
---
🧩 Disclaimer
This script is for educational purposes only .
Past performance does not guarantee future returns.
Use responsibly. The developer assumes no liability for financial losses.
---
💬 Community & Access
Developed by: Shubham Singh
Version: Velocity SmartMoney Engine v1.0
For premium modules & automation: DM "Velocity Access" on chat to request access.
---
© 2025 Velocity SmartMoney Engine — All Rights Reserved

TitanEdge Algo Suite — 4H BTC & ETH (Delta Exchange Ready)TitanEdge Algo Suite — 4H BTC & ETH (Delta Exchange Ready)
TitanEdge Algo Suite is a next-generation trading system that fuses volatility-adaptive logic, order-block structure, SuperTrend direction filtering, and ATR-based exits into a single modular framework.
It’s engineered for 4-hour BTC and ETH swing trading, delivering institutional-grade entries, dynamic risk control, and precise exits.
⚙️ Core Features
1. Volatility Oscillator (0–100)
• Filters trades by volatility intensity.
• Uses ATR, Range, or Bollinger Band Width normalization.
• Trades trigger only when market volatility is high — filtering out sideways or weak trends.
• Ensures trades occur during real momentum expansions.
2. Breakout + Order Block Engine
• Detects pivot highs/lows to confirm authentic breakout levels.
• Identifies “smart money” gaps — institutional imbalance zones often leading to strong reversals or continuations.
• Captures both breakout continuations and order-block reversals.
• Works as a hybrid structure detector combining price action and volatility alignment.
3. SuperTrend Directional Filter
• Optional filter that only allows trades in the direction of the SuperTrend.
• Can automatically close trades when a SuperTrend flip occurs.
• Provides strong trend-following bias and helps avoid countertrend traps.
4. ATR-Based Stop & Trailing System
• Adaptive stop-loss and trailing logic that expands or tightens based on volatility.
• Supports three modes: StopOnly, TrailOnly, and StopAndTrail.
• Works in both ATR-based distance or percentage-based configuration.
• Keeps losing trades small and lets winning trades extend dynamically.
5. Volume-Based Exit Logic
• Detects low-volume exhaustion to identify momentum loss.
• Detects opposite-volume spikes as early reversal signals.
• Optional hybrid “Both” mode combines both detection methods for stronger reliability.
• Ideal for markets where volume surges indicate smart money exits or trap formations.
6. Session Filter & Anti-Churn Control
• Restrict trading hours (optional; not required for crypto).
• Prevents repeated signals and noise-based entries through minimum bars between trades.
• Cooldown logic ensures disciplined trading and avoids strategy overlap.
• Prevents multiple entries in a single bar and filters unconfirmed breakouts.
7. SmartMoney Preset Mode
• Institutional-grade configuration automatically adjusting volatility, ATR, and structural logic.
• Mimics smart money behavior by prioritizing clean structure and high liquidity volatility zones.
• Great for traders who want simplified institutional logic without manual tuning.
Optimized for 4H BTC & ETH
TitanEdge performs best on BTCUSDT and ETHUSDT pairs in the 4-hour timeframe.
The 4H chart captures high-volatility institutional swings, eliminates intraday noise, and provides clear order-block setups.
This timeframe aligns with BTC/ETH volatility cycles, providing consistent signals and cleaner trend confirmation.
Recommended settings for 4H charts:
• Levels Period: 25
• Volatility Filter: 20
• volatility oscillator Auto: disable ( it depend upon your plan test with Disable/enable)
• Volatility Method: BBWidth
• ATR Multiplier: 1.8
• ATR Stop %: 5
• SuperTrend ATR Length: 10
• SuperTrend Factor: 3
• ATR Mode: StopAndTrail
• Hold Bars: 1
• Volume Exit: Disable (Both)
• Session Filter: Off (Crypto runs 24/7)
Entry Logic
• Long Entry: Price breaks above resistance (pivot high), volatility above threshold, and optional SuperTrend confirmation.
• Short Entry: Price breaks below support (pivot low), volatility above threshold, and optional bearish SuperTrend confirmation.
• Additional Entry: Triggered by order-block gaps (smart money imbalances) in volatility expansion phases.
• Trades only when both direction and volatility align to ensure precision entries.
Exit Logic
• ATR Stop and Trail dynamically manage open trades.
• SuperTrend Flip forces exit on trend reversal.
• Volume Exit triggers when volume momentum drops or opposite spike occurs.
• Optional session close exit to flatten trades outside hours.
• Logic prevents premature exits with “Hold Bars” delay after entry.
Why You Need TitanEdge Algo Suite
• Trades only during high-volatility, strong-momentum phases — no false breakouts or choppy trades.
• ATR risk control automatically adjusts to each market’s volatility conditions.
• Identifies institutional order-blocks and clean breakouts for precise entries.
• SuperTrend filter adds directional bias, boosting win-rate consistency.
• Volume exit logic ensures profits are protected when market momentum fades.
• Works 24/7 across all major crypto pairs — fully automated and customizable.
• Built for 4H swing trades — fewer but higher-quality setups.
• Fully compatible with TradingView alerts and bot integration for hands-free execution.
How TitanEdge Makes Profit
• TitanEdge only trades during volatility expansion, when breakout continuation probability is statistically high.
• ATR dynamic stops prevent large losses by scaling protection according to real volatility.
• Trend filtering keeps positions aligned with major market flows.
• Order-block detection ensures entries are based on price structure rather than random signals.
• Volume-based exits secure profits early when momentum weakens.
• SmartMoney Preset provides optimal balance between trade frequency, accuracy, and drawdown control.
• The system compounds edge by maintaining trade discipline — fewer but stronger trades over time.
Delta Exchange Integration (TradingView Bot Ready)
TitanEdge is fully compatible with TradingView alert webhooks and can connect to Delta Exchange or any bot-supported broker.
Alert JSON message format:
{"symbol":"{{ticker}}","side":"{{strategy.order.action}}","qty":1,"trigger_time":"{{timenow}}","strategy_id":"code"}
qty 1 represent 1 lot so if you want to take trade with 5 lots or 0.05eth and write
{"symbol":"{{ticker}}","side":"{{strategy.order.action}}","qty":5,"trigger_time":"{{timenow}}","strategy_id":"code"}
Steps to automate:
Create an alert on TradingView using “Once Per Bar Close”.
Paste your bot or automation webhook URL.
Paste the JSON above as the message.
Configure your bot or API bridge (like PineConnector, AutoView, or WunderTrading) to route signals to Delta Exchange.
On Delta, use BTCUSD or ETHUSD Perpetual pairs with moderate leverage (3x–5x).
Enable Cross Margin for smooth drawdown handling.
Test first on Delta Testnet for safety.
Why 4H BTC & ETH Works Best
• 4H candles capture true volatility swings and filter lower-timeframe noise.
• Aligns with institutional liquidity cycles in BTC and ETH.
• ATR and volume-based stops perform optimally on larger bars.
• Smoother equity curve and less drawdown compared to intraday trading.
• Ideal for traders seeking structured, medium-term trades with high reward-to-risk.
Unique Edge
• Combines breakout, order-block, and volatility principles into one adaptive model.
• Incorporates volatility normalization (ATR/BBWidth) for multi-market adaptability.
• Dynamic ATR stops and trailing protect capital during unstable phases.
• Volume and trend exits create layered protection systems.
• 4H optimization eliminates noise and provides clear institutional alignment.
• SmartMoney preset auto-configures settings to mimic large-player behavior.
• Fully automated via webhooks — no manual execution required.
• Modular design lets you customize each component for different trading styles.
TradingView Bot Integration
TitanEdge is fully plug-and-play with all TradingView-compatible bots.
Each alert sends structured JSON data containing direction, symbol, and quantity, ready for execution on your connected broker.
You can route the data to:
• PineConnector (MT4/MT5 bridge)
• WunderTrading
• AutoView
• Custom Node/REST API handler
This makes TitanEdge a professional-grade strategy suitable for semi-automatic or fully automated crypto trading setups.
Professional Recommendations
• Timeframe: 4H
• Instruments: BTCUSDT, ETHUSDT
• Exchange: Delta Exchange (Perpetual Futures)
• Leverage: 3x–5x
• Session Filter: Off (crypto 24/7)
• Risk per trade: 0.5%–1% of total equity
• Alert Type: Once Per Bar Close
• Volatility Filter: 25–35 depending on market activity
• Always use realistic slippage and fees for backtests.
Summary
TitanEdge Algo Suite is a complete trading framework built to deliver institutional-quality precision with full automation support.
It captures powerful volatility expansions on 4H BTC and ETH charts using clean structure, adaptive stops, and directional trend filters.
Every feature — from entry logic to exits — is designed to protect capital and amplify performance through disciplined, volatility-aware execution.
TitanEdge is not just another script — it’s a professional-grade algorithm that combines volatility intelligence, structural precision, and adaptive risk control.
TitanEdge Algo Suite = Smart Logic × Trend Discipline × Adaptive Risk Control
Optimized for BTC & ETH on 4H charts. Built for traders who demand precision, control, and consistency.

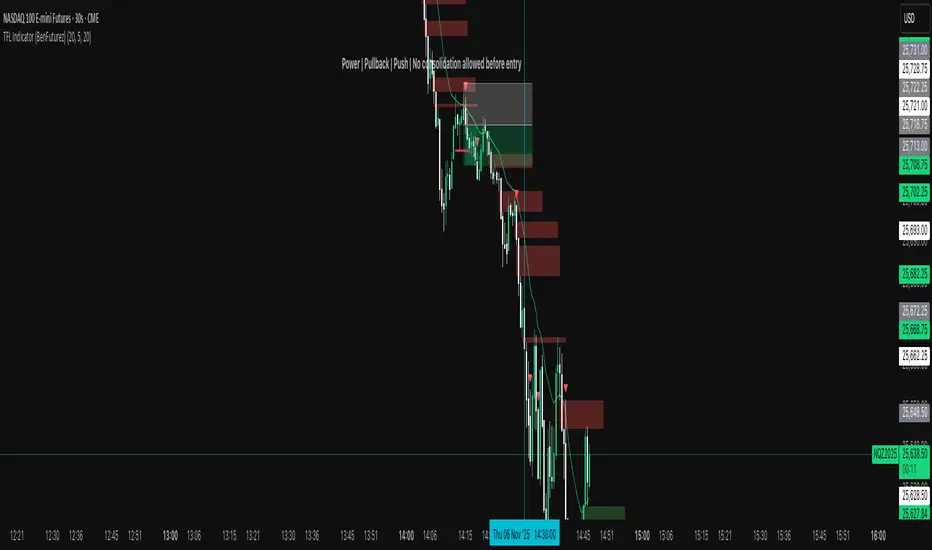
TFL Indicator (BenFuturez)Smart Fair Value Gap Trading Tool
This indicator identifies high-probability trading opportunities by combining Fair Value Gaps (FVGs) with confirmation signals and trend filtering.
KEY FEATURES:
• Automatically detects bullish and bearish Fair Value Gaps on your chart
• Generates precise entry signals based on price action confirmation
• Includes built-in trend filter using 20 EMA for higher quality setups
• Visual FVG boxes with customizable colors and extension length
• Configurable signal sensitivity with adjustable timeframe parameters
HOW IT WORKS:
The indicator marks FVG zones on your chart and monitors price behavior when these zones are tested. Entry signals appear only when multiple conditions align, including proper price structure, gap interaction, and trend direction. This multi-layered approach helps filter out low-probability trades.
SETTINGS:
• Toggle bullish/bearish FVG boxes on/off
• Adjust box colors and extension length
• Configure signal timing sensitivity
• Show/hide the 20 EMA trend filter
• Customize EMA length and color
SIGNALS:
• Green triangle = Buy signal (bullish setup confirmed)
• Red triangle = Sell signal (bearish setup confirmed)
• Built-in alerts available for all signal types
BEST PRACTICES:
• Use on lower timeframes for more signals
• Combine with proper risk management and position sizing
• Signals work best when aligned with overall market structure
• Consider multiple timeframe confirmation for best results
• Use this as a confluence to your strategy, don't just blindly follow signals!
This indicator is designed for traders who understand market structure and want a systematic approach to identifying quality entry points based on institutional order flow concepts.
Dynamic FVG & Trap Zones📘 Dynamic FVG & Trap Zones (DFTZ)
A Hybrid Model Combining Imbalance Mapping, Volume Behavior, and Trap Detection
Concept Overview
“Dynamic FVG & Trap Zones” is built to visualize real-time Fair Value Gaps (FVGs) and identify liquidity trap events inside those gaps using adaptive volume filters and wick-based logic.
Traditional FVG indicators merely mark imbalance zones between consecutive candles, but this model goes further — it measures how volume reaction and price penetration inside those zones reveal potential f alse moves or trap formations by smart money.
⚙️ How It Works
1. FVG Detection
• A Bullish FVG is detected when low > high , showing a price void left by aggressive buying.
• A Bearish FVG forms when high < low , implying a selling imbalance.
• These zones are automatically drawn as semi-transparent boxes that extend forward for 10 bars and decay once they exceed the configurable lookback window.
2. Volume Normalization & Grading
• Every bar’s volume is compared against a dynamic SMA( volLookback ) average to calculate a Volume Grade = current vol / avg vol.
• Only bars exceeding the Min Volume Grade threshold are eligible to generate valid FVG zones, ensuring that low-participation moves are ignored.
• The Trap Volume Threshold sets how quiet the reaction bar must be (relative to average volume) to qualify as a trap event.
3. Trap Detection Logic
• Each active FVG zone monitors incoming candles.
• A potential trap is triggered when price re-enters the zone (body or wick depending on settings) but fails to expand with confirming volume.
• If the event occurs inside a Bullish FVG, it marks a Bear Trap (green zone turned red).
If it happens inside a Bearish FVG, it flags a Bull Trap (red zone turned green).
• This reversal in zone color visually conveys trapped liquidity and potential directional fade.
4. Exclusivity and Cooldown Control
• To avoid signal clustering, you can choose exclusivity modes:
Allow Both, Bear over Bull, or Bull over Bear.
• A built-in per-signal cooldown timer prevents back-to-back plots of the same type, enhancing signal clarity during rapid price action.
5. Adaptive Visualization
• Wick-based vs body-based trap detection (toggleable).
• Optional cooldown filtering on shapes ensures the chart only displays validated events.
• Old FVG boxes are pruned automatically beyond the chosen lookback horizon.
🧠 Why It’s Different
Unlike static FVG detectors or simple liquidity sweep tools, DFTZ blends:
• Volume context (Smart Volume Grade filtering)
• Behavioral trap detection within imbalance zones
• Dynamic cooldown mechanics that control over-signaling
• Forward-propagating zones that self-expire gracefully
This synergy makes it a compact yet powerful tool for visualizing imbalances + liquidity traps in one framework — ideal for discretionary traders combining SMC concepts with volume analytics.
📈 How to Use
• Primary Context: Use on 15 min to 1 h charts to spot active FVG zones forming after impulsive moves.
• Trap Signal Interpretation:
• 🔴 “Trap” below bar → Bullish reversal (Bear Trap).
• 🟢 “Trap” above bar → Bearish reversal (Bull Trap).
• Combine With: Market structure breaks, VWAP, or delta volume tools to confirm true reversal intent.
• Alerts: All major events (FVG creation & trap confirmation) trigger ready-to-use alerts for automation or back-testing.
🧩 Customization
Setting Function
Max FVG Lookback Controls how long old zones remain active.
Volume SMA Period Defines the baseline for volume grading.
Min Volume Grade & Trap Volume Threshold Tune the sensitivity of trap confirmation.
Wick-Based Trap Detection Enable to capture wick rejections inside zones.
Signal Cooldown Prevents rapid multiple plots on successive bars.
⚠️ Disclaimer
This tool is designed for educational and analytical purposes only. It does not constitute financial advice or guarantee trading performance. Always conduct your own analysis and risk management before entering a position.

True Opens (TDO/TWO/NYAM etc.)+ First FVG - Milana TradesThis indicator combines multiple "True Open" levels with the visualization of the first Fair Value Gap (FVG) following key market opens.
Key Features:
True Opens (TDO, TWO, TAO, TLO, NYAM, TNY):
TDO (True Day Open): Displays the start of the trading day (00:00 NY time) with customizable line style, color, and label.
TWO (True Weekly Open): Marks the start of the week (Monday 18:00 NY time) with visual lines and optional labels.
TAO (True Asian Open): Highlights the opening of the Asian session (19:30 NY time), allowing traders to track early Asian session activity.
TLO (True London Open): Marks London session open (01:30 NY time), providing insight into the first European market activity.
NYAM (New York AM Open): Marks 09:30 NY time, often a key liquidity spike period.
TNY (True New York Open): Highlights the full New York session open (07:30 NY time), useful for pre-market and early NY session trading.
All lines are fully customizable in color, style, width, and label visibility. Lines can also be extended to the right for better visual tracking.
First FVG After Open:
Automatically detects the first Fair Value Gap (FVG) following each session open.
Supports both bullish and bearish FVGs, displayed with distinct colors and transparency.
Mitigation detection highlights gaps that have already been touched or partially filled, using a softer color for clarity.
Why the first FVG matters:
The first gap after an open often indicates the initial imbalance of the session.
These gaps can act as high-probability zones for retracement or continuation trades, providing early-session trade opportunities.
Daily & Weekly Initial Range Boxes:
Visualize daily (00:00–01:00 NY) and weekly (Monday 18:00–19:00 NY) initial ranges.
Boxes update dynamically with price movement during the session.
Optional range info in pips to quantify volatility and potential targets.
Customizable Appearance:
Choose colors for bullish, bearish, and mitigated FVGs.
Adjust line styles (solid, dashed, dotted), widths, labels, and extensions for all opens.
Transparency settings for IB boxes allow clear chart readability without clutter.
Historical Options:
Enable prior day/week visualization to analyze session behavior and recurring patterns.
Why Traders Use This Indicator:
Early session clarity: Knowing the true session opens and first FVGs helps traders spot high-liquidity zones and potential reversals.
Structure-based trading: Combines session open levels with FVGs, aligning with professional market structure strategies.

TMB Invest - Smart Money Concept StrategyEnglish:
**Quick Overview**
The "TMB_SMC_Strategy_v1.1.3" combines a classic trend filter using two EMAs with contrarian RSI entries and simple SMC elements (Fair Value Gaps & Order Blocks). Stop-loss and take-profit orders are volatility-adaptive and controlled via the ATR. An integrated dashboard displays the setup status, stop-loss/take-profit levels, entry reference, and trend, RSI, and ATR values.
---
## Operating Principle
1. **Trend Filter:** A fast EMA (default 50) is compared to a slow EMA (default 200). Trading occurs only in the direction of the trend: long in uptrends, short in downtrends.
2. **Timing via RSI:** Contrarian entries within the trend. Go long when the RSI is below a buy level (default 40); Short when the RSI is above a sell level (standard 60).
3. **Structure Check (SMC Proxy):** An "FVG Touch" serves as additional confirmation that an inefficient price zone has been tested. Order blocks are visualized for guidance but are not a direct entry trigger.
4. **Risk Management via ATR:** Stop-loss and take-profit levels are set as multipliers of the current ATR (e.g., SL = 1×ATR, TP = 2×ATR). This allows target and risk distances to adjust to market volatility.
5. **Simple Position Logic:** Only one position is held at a time (no pyramiding). After entry, stop and limit orders (bracket exit) are automatically placed.
---
## Input Values
* **EMA Fast / EMA Slow:** Lengths of the moving averages for the trend filter.
* **RSI Length / Levels:** Length of the RSI as well as buy and sell thresholds (contra signals within the trend direction).
* **Take Profit (RR) / Stop Loss (RR):** ATR multipliers for TP and SL.
* **Show FVGs & Order Blocks:** Toggles the visual SMC elements (zones/boxes) on or off.
--
## Signals & Execution
* **Long Setup:** Uptrend (fast EMA above slow EMA) **and** RSI below the buy level **and** a current FVG signal in a bullish direction.
* **Short Setup:** Downtrend (fast EMA below slow EMA) **and** RSI above the sell level **and** a current FVG touch in a bearish direction.
* **Entry & Exit:** If the setup is met, the market is entered; stop-loss/take-profit orders are placed immediately according to ATR multiples.
--
## Visualization
* **EMAs:** The fast and slow EMAs are plotted to illustrate the trend.
* **FVGs:** Fair Value Gaps are drawn as semi-transparent boxes in the trend color and projected slightly into the future.
* **Order Blocks:** Potential order block zones from the previous candle are visually highlighted (for informational purposes only).
---
## Integrated Dashboard
A compact table dashboard (bottom left) displays:
* Current **Setup Status** (Long/Short active, Long/Short ready, No Setup),
* **Stop-Loss**, **Take-Profit**, and **Entry Reference**,
* **Trend Status** (Bull/Bear/Sideways),
* **RSI Value**, and **ATR Value**.
Active long/short positions are highlighted in color (green/red).
--
## Practical Guide
1. **Place on Chart** and select the desired timeframe.
2. **Calibrate Parameters** (EMA lengths, RSI levels, ATR multipliers) to match the market and timeframe.
3. **Backtest** across different market phases; prioritize robustness over maximum curve fit.
4. **Fine-Tuning:**
* Shorter EMAs are often useful intraday (e.g., 20/100 or 34/144).
* Adjust RSI levels to market characteristics (45/55 for aggressive trading, 30/70 for conservative trading).
* Increase or decrease ATR multipliers depending on volatility/trading style.
--
## Notes, Limitations & Extensions
* **FVG Definition:** The FVG detection used here is intentionally simplified. Those who prefer a more rigorous approach can switch to a 3-candle definition and fill levels.
* **Order Blocks:** These primarily serve as a guide. Integration into entry/exit logic (e.g., retests) is possible as an extension.
* **Backtest Realism:** Fills may differ from the displayed closing price. For greater accuracy, intrabar backtests or an entry indicator based on the average position price are conceivable.
* **Alerts:** Currently, no alert conditions are defined; these can be added for long/short setups and status messages.
* **Position Management:** By default, no scaling is performed. Partial sales, trailing stops, or multiple entries can be added.
---
## Purpose & Benefits
The strategy offers a clear, modular framework: trend filter (direction), RSI contra timing (entry), SMC proxy via FVG Touch (structure), and ATR-based exits (risk adaptation). This makes it robust, easy to understand, and highly extensible—both for discretionary traders who appreciate visual SMC elements and for systematic testers who prefer a clean, parameterizable foundation.

Custom Horizontal Lines | Trade Symmetry📊 Custom Horizontal Lines
🔍 Overview
The Custom Horizontal Lines is a precision utility designed for traders who perform manual higher-timeframe analysis and want to preserve their marked price levels directly on the chart.
It doesn’t calculate or detect anything automatically — instead, it acts as your personal level memory, preserving your analyzed zones and reference prices throughout the session.
Ideal for traders who manually mark the High, Low, Open, Close, Mean Thresholds, and Quarter Levels of Order Blocks, Fair Value Gaps, Inversion Fair Value Gaps and Wicks before the trading day begins.
⚙️ Key Features
✅ Manual Level Entry — Input your analyzed price levels (OB, FVG, WICK,etc) directly into the indicator settings.
✅ Preserved Levels — Once entered, your lines stay visible and consistent — even after switching symbols, timeframes, or reloading the chart.
✅ Supports All Level Types — Store any kind of manually defined level: OB highs/lows, FVG boundaries, Wicks, Mean Thresholds, Quarter levels, or custom reference prices.
✅ Clean Visualization — Customize line color, style, and labels for easy visual organization.
✅ Session-Ready Workflow — Built for pre-market preparation — enter your HTF levels once, and trade around them all day.
✅ No Auto Calculations — 100% manual by design — ensuring only your analyzed levels are shown, exactly as you defined them.
💡 How to Use
Open the indicator’s settings and manually enter those price values.
The indicator will plot and preserve those exact levels on your chart.
Switch to your lower timeframe and observe how price reacts around them — without ever needing to redraw.
🎯 Why It’s Useful
Keeps your HTF levels organized and persistent across sessions.
Saves time by avoiding redrawing.
Fits perfectly into ICT / Smart Money trading workflows.
Ensures full manual control and precision over what’s displayed on your chart.
🧩 Ideal For
ICT and Smart Money traders
Institutional-style manual analysts
Traders marking Mean Thresholds, or Quarter Levels of OBs, FVGs, Wicks etc
Anyone who wants a clean, reliable way to preserve their manual analysis

Malama's Heat MapOverview
Malama's Heat Map is an overlay indicator that visualizes historical liquidity as a dynamic heatmap aligned with the price chart, using volume as a proxy to map activity across time (X-axis) and price levels (Y-axis). It constructs a grid of up to 5000 cells via a matrix, distributing bar volume into discrete price bins to highlight concentration zones, creating a color-graded visualization from cool (low activity) to hot (high liquidity). This aids in identifying "Type II" fair value areas, support/resistance from past volume clusters, or potential imbalances without order book access. Built for v6 compatibility with efficiency in mind—computations run solely on the last bar, includes object limit enforcement, and offers two intra-bar volume distribution methods for flexible approximation.
Core Mechanics
The indicator generates a trailing heatmap through binning, accumulation, and box-based rendering:
Grid Setup: Configurable lookback (bars back, default 100) sets horizontal time span; bins (price divisions, default 50) define vertical resolution, limited to 5000 total cells to prevent errors. Bin height dynamically = max(mintick, (lookback high - low) / bins).
Y-Axis Stabilization: Anchors boundaries to the prior bar's high/low (if available) for a flicker-free view during live bar updates. All historical bar data (high/low/close/volume) is clipped to these bounds.
Volume Distribution Proxy:
Even: Divides bar volume equally across spanned bins (straightforward uniform spread).
POC Weighted (Inverse): Treats bar close as POC proxy; applies inverse distance weighting (1/(|bin - POC bin| + 1), normalized) to emphasize volume near the estimated control point, simulating clustered intra-bar trading.
Matrix Building: On last bar only, loops backward over lookback bars (newest right-aligned). For each, computes low/high bin indices, distributes volume per selected method into the matrix (columns=time, rows=price bins from low to high).
Scaling & Palette: Extracts max matrix value for relative normalization (0-1); maps to a 5-tier stepped color scheme (user-customizable: blue 90% transp. low → red 50% transp. high) for non-linear intensity.
Rendering: Clears old boxes, then iterates matrix to draw only non-zero cells as thin boxes: X spans one bar width (left=historical index from bar_index, right=next bar), Y fills bin height. Borderless for seamless heatmap effect.
The result is a right-leaning, chart-scrolling visualization emphasizing recent liquidity buildup.
Why This Adds Value & Originality
While session-based volume profiles exist, this heatmap captures ongoing multi-bar liquidity evolution ("Type II" style), revealing horizontal value areas or gaps dynamically. Originality shines in the custom inverse-weighting for POC realism (no ta.* dependencies), matrix-driven persistence for quick redraws, and stabilization to eliminate repaints—issues plaguing similar scripts. v6 adaptations (e.g., custom clamp, matrix recreation on input change) ensure broad compatibility without bloat. It condenses complex liquidity scanning into one tool: spot red "hot" bands as magnets, blue voids as FVGs. Unlike generic heatmaps, the proxy options and limit-aware design scale across timeframes/assets (e.g., forex vs. crypto), reducing the need for layered indicators.
How to Use
Setup: Apply as overlay. Defaults suit ~4-day 1H view; tune lookback/bins (e.g., 50x100 for intraday fine-detail, but watch 5000 cap—errors auto-flag excesses). Select "POC Weighted" for nuanced clustering, "Even" for simplicity. Customize palette (e.g., desaturate for dark themes).
Reading the Heatmap:
X-Axis (Time): Left=older (fainter context), right=recent focus; tracks evolving liquidity trails.
Y-Axis (Price): Bottom=range low, top=high; vertical density shows price-level attraction.
Colors: Faint blue (sparse volume, possible inefficiencies) → vivid red (dense activity, likely SR). Horizontal streaks = sustained value zones.
Trading Insights: Price wicking into red? Anticipate fills/reversals. Blue gaps post-break? Targets for retraces. Ideal on 5M–Daily; layer with candlesticks off for purity.
Example: In BTCUSD 4H, a yellow-red band at $60K from prior consolidation → treat as dynamic support for longs on dips.
Tips
Balance settings: High bins = sharper verticals but cap lookback (e.g., 80x60=4800 cells). Test on volatile pairs first.
"POC Weighted" excels in ranging markets; switch to "Even" for trending (avoids close-bias skew).
For deeper analysis, screenshot/export or pair with divergence tools; add manual alerts via box counts if extended.
Efficiency: Last-bar only keeps it snappy; refresh on input tweaks.
Limitations & Disclaimer
Visualization is historical/proxy-based—lagging by one bar, no forward projection or tick-level precision (close-as-POC is estimate). Clipping may trim outlier wicks; low-volume bars dilute globally. Stepped colors are relative (max scales per redraw), potentially compressing extremes. Exceeds 5000 cells? Runtime error halts—no fallback resize. Not real liquidity (volume ≠ depth); best as visual aid, not quantitative. Updates post-close only. Backtest zones on specific symbols—correlation ≠ causation. Not advice; trade responsibly. Ideas in comments!

Cumulative Volume Profile DeltaThis indicator calculates the Cumulative Volume Profile Delta (CVPD). It constructs a high-resolution volume profile for each bar using intra-bar data, then derives and accumulates the delta from that profile to show net buying/selling pressure.
Key Features:
Statistical Volume Profile Engine: For each bar, the indicator builds a high-resolution volume profile on a lower 'Intra-Bar Timeframe'. Instead of simple tick counting, it uses statistical models ('PDF' allocation) to distribute volume across price levels and advanced classifiers ('Dynamic' split) to determine the buy/sell pressure before accumulation.
Periodic Accumulation: The CVPD accumulation is anchored to a user-defined 'Anchor Timeframe' (e.g., daily, weekly). This cyclical reset allows to analyze the build-up of pressure within specific trading periods.
"Delta Candle" Visualization: The periodic CVPD is shown as a candle, where:
Open: The CVPD value at the start of the period (or zero).
High/Low: Represent the peak buying (CVD High) and selling (CVD Low) pressure within that period's profile.
Close: The final net delta value (CVD) for the period.
Dual CVD & Divergence Engine: The indicator calculates two CVPDs: a Periodic one (for plotting) and a Continuous one (non-resetting). The continuous line is used as a stable source for the built-in divergence engine (detecting Regular, Hidden, and Exaggerated).
Dynamic Divergence Plotting: Divergence markers are plotted relative to the periodic (candle) CVPD. They automatically adjust their vertical position after a reset to remain visually aligned with the plotted candles.
Note on Confirmation (Lag): Divergence signals rely on a pivot confirmation method to ensure they do not repaint.
The Start of a- divergence is only detected after the confirming pivot is fully formed (a delay based on Pivot Right Bars).
The End of a divergence is detected either instantly (if the signal is invalidated by price action) or with a delay (when a new, non-divergent pivot is confirmed).
Multi-Timeframe (MTF) Capability:
MTF Output: The entire analysis (Delta Candles, Divergences) can be calculated on a higher timeframe (using the Timeframe input), with standard options to handle gaps (Fill Gaps) and prevent repainting (Wait for...).
Limitation: The Divergence detection engine (pivDiv) is disabled if a Higher Timeframe (HTF) is selected.
Integrated Alerts: Includes 18 comprehensive alerts for:
The start and end of all 6 divergence types.
The periodic CVPD crossing the zero line.
Conditions of agreement or disagreement between the delta and the main bar's direction.
Caution: Real-Time Data Behavior (Intra-Bar Repainting) This indicator uses high-resolution intra-bar data. As a result, the values on the current, unclosed bar (the real-time bar) will update dynamically as new intra-bar data arrives. This behavior is normal and necessary for this type of analysis. Signals should only be considered final after the main chart bar has closed.
DISCLAIMER
For Informational/Educational Use Only: This indicator is provided for informational and educational purposes only. It does not constitute financial, investment, or trading advice, nor is it a recommendation to buy or sell any asset.
Use at Your Own Risk: All trading decisions you make based on the information or signals generated by this indicator are made solely at your own risk.
No Guarantee of Performance: Past performance is not an indicator of future results. The author makes no guarantee regarding the accuracy of the signals or future profitability.
No Liability: The author shall not be held liable for any financial losses or damages incurred directly or indirectly from the use of this indicator.
Signals Are Not Recommendations: The alerts and visual signals (e.Example: crossovers) generated by this tool are not direct recommendations to buy or sell. They are technical observations for your own analysis and consideration.

Cumulative Volume DeltaThis Cumulative Volume Delta (CVD) indicator analyzes intra-bar volume dynamics. It introduces a periodic reset mechanism, anchoring the accumulation to a user-defined timeframe (e.g., daily, weekly) for cyclical analysis.
Key Features:
Dual CVD Calculation: The indicator computes two CVD values simultaneously:
Periodic CVD: Resets on the user-defined 'Anchor Timeframe'. This is plotted as "Delta Candles".
Continuous CVD: Accumulates volume continuously (non-resetting) and is used as the source for divergence detection.
Intra-Bar Delta Analysis: Uses a lower timeframe ('Intra-Bar Timeframe') to calculate buy/sell pressure based on the direction of the intra-bar candles.
"Delta Candle" Visualization: The periodic CVD is shown as a candle, where:
Open: The CVD value at the start of the period (or zero).
High/Low: Represent the peak buying (CVD High) and selling (CVD Low) pressure within that period.
Close: The final net delta value for that period.
Full Divergence Suite (Class A, B, C): A built-in engine automatically detects and plots Regular (A), Hidden (B), and Exaggerated (C) divergences between price and the continuous CVD line.
Dynamic Divergence Plotting: Divergence markers are plotted relative to the periodic (candle) CVD. They automatically adjust their vertical position after a reset to remain visually aligned with the plotted candles.
Note on Confirmation (Lag): Divergence signals rely on a pivot confirmation method to ensure they do not repaint.
The Start of a- divergence is only detected after the confirming pivot is fully formed (a delay based on Pivot Right Bars).
The End of a divergence is detected either instantly (if the signal is invalidated by price action) or with a delay (when a new, non-divergent pivot is confirmed).
Multi-Timeframe (MTF) Capability:
MTF Output: The entire dual-CVD analysis can be run on a higher timeframe (using the Timeframe input), with standard options to handle gaps (Fill Gaps) and prevent repainting (Wait for...).
Limitation: The Divergence detection engine (pivDiv) is disabled if a Higher Timeframe (HTF) is selected.
Integrated Alerts: Includes 18 comprehensive alerts for:
The start and end of all 6 divergence types.
The periodic CVD crossing the zero line.
Conditions of agreement or disagreement between the delta and the main bar's direction.
Caution: Real-Time Data Behavior (Intra-Bar Repainting) This indicator uses high-resolution intra-bar data. As a result, the values on the current, unclosed bar (the real-time bar) will update dynamically as new intra-bar data arrives. This behavior is normal and necessary for this type of analysis. Signals should only be considered final after the main chart bar has closed.
DISCLAIMER
For Informational/Educational Use Only: This indicator is provided for informational and educational purposes only. It does not constitute financial, investment, or trading advice, nor is it a recommendation to buy or sell any asset.
Use at Your Own Risk: All trading decisions you make based on the information or signals generated by this indicator are made solely at your own risk.
No Guarantee of Performance: Past performance is not an indicator of future results. The author makes no guarantee regarding the accuracy of the signals or future profitability.
No Liability: The author shall not be held liable for any financial losses or damages incurred directly or indirectly from the use of this indicator.
Signals Are Not Recommendations: The alerts and visual signals (e.g., crossovers) generated by this tool are not direct recommendations to buy or sell. They are technical observations for your own analysis and consideration.

Volume Profile DeltaThis indicator calculates the Volume Profile Delta (VPD). It constructs a high-resolution volume profile for each bar using intra-bar data, offering a detailed understanding of buying and selling pressure at discrete price levels.
Key Features:
Statistical Volume Profile Engine: For each bar, the indicator builds a high-resolution volume profile on a lower 'Intra-Bar Timeframe'. Instead of simple tick counting, it uses statistical models ('PDF' allocation) to distribute volume across price levels and advanced classifiers ('Dynamic' split) to determine the buy/sell pressure within that profile, providing a more nuanced delta calculation.
"Delta Candle" Visualization: The per-bar VPD is displayed as a candle, where:
Open: Always anchored at the zero line.
High/Low: Represent the peak buying (CVD High) and selling (CVD Low) pressure accumulated within that bar's profile.
Close: The final net delta value (CVD) for the bar.
Customizable Moving Average: An optional moving average of the net delta (Close) can be added. The MA type, length, and an optional Volume weighted setting are customizable.
Intra-Bar Peak Pivot Detection: Automatically identifies and plots significant turning points (pivots) in the peak buying (High) and selling (Low) pressure.
Note on Confirmation (Lag): Pivot signals are confirmed using a lookback method. A pivot is only plotted after the Pivot Right Bars input has passed, which introduces an inherent lag.
Multi-Timeframe (MTF) Capability:
MTF Output: The entire analysis (Delta Candles, MA, Pivots) can be calculated on a higher timeframe (using the Timeframe input), with standard options to handle gaps (Fill Gaps) and prevent repainting (Wait for...).
Limitation: The Pivot detection (Calculate Pivots) is disabled if a Higher Timeframe (HTF) is selected.
Integrated Alerts: Includes 8 alerts for:
The net delta crossing its moving average.
The detection of new peak buying or selling pivots.
Conditions of agreement or disagreement between the net delta and the main bar's direction.
Caution: Real-Time Data Behavior (Intra-Bar Repainting) This indicator uses high-resolution intra-bar data. As a result, the values on the current, unclosed bar (the real-time bar) will update dynamically as new intra-bar data arrives. This behavior is normal and necessary for this type of analysis. Signals should only be considered final after the main chart bar has closed.
DISCLAIMER
For Informational/Educational Use Only: This indicator is provided for informational and educational purposes only. It does not constitute financial, investment, or trading advice, nor is it a recommendation to buy or sell any asset.
Use at Your Own Risk: All trading decisions you make based on the information or signals generated by this indicator are made solely at your own risk.
No Guarantee of Performance: Past performance is not an indicator of future results. The author makes no guarantee regarding the accuracy of the signals or future profitability.
No Liability: The author shall not be held liable for any financial losses or damages incurred directly or indirectly from the use of this indicator.
Signals Are Not Recommendations: The alerts and visual signals (e.g., crossovers) generated by this tool are not direct recommendations to buy or sell. They are technical observations for your own analysis and consideration.

Volume DeltaThis indicator provides a detailed view of Volume Delta (VD) by analyzing order flow on a lower, intra-bar timeframe. For each bar on the chart, it calculates the net difference between buying and selling volume based on the direction of the intra-bar candles.
Key Features:
Intra-Bar Delta Calculation: The indicator analyzes price action on a user-defined lower timeframe ('Intra-Bar Timeframe') to construct a detailed picture of the underlying order flow for each bar on the main chart.
"Delta Candle" Visualization: The delta for each bar is shown as a candle, where:
Open: Always starts at the zero line.
High/Low: Represent the peak buying and selling pressure accumulated within the bar.
Close: The final net delta value for that bar. This visualization shows absorption, exhaustion, and conviction in a single glance.
Customizable Moving Average: An optional moving average of the net delta (Close) can be added. The MA type, length, and an optional Volume weighted setting are customizable.
Intra-Bar Peak Pivot Detection: Automatically identifies and plots significant turning points (pivots) in the peak buying (High) and selling (Low) pressure.
Note on Confirmation (Lag): Pivot signals are confirmed using a lookback method. A pivot is only plotted after the Pivot Right Bars input has passed, which introduces an inherent lag.
Multi-Timeframe (MTF) Capability:
MTF Output: The entire analysis (Delta Candles, MA, Pivots) can be calculated on a higher timeframe (using the Timeframe input), with standard options to handle gaps (Fill Gaps) and prevent repainting (Wait for...).
Limitation: The Pivot detection (Calculate Pivots) is disabled if a Higher Timeframe (HTF) is selected.
Integrated Alerts: Includes 8 alerts for:
The net delta crossing its moving average.
The detection of new peak buying or selling pivots.
Conditions of agreement or disagreement between the net delta and the main bar's direction (absolute volume).
Caution: Real-Time Data Behavior (Intra-Bar Repainting) This indicator uses high-resolution intra-bar data. As a result, the values on the current, unclosed bar (the real-time bar) will update dynamically as new intra-bar data arrives. This behavior is normal and necessary for this type of analysis. Signals should only be considered final after the main chart bar has closed.
DISCLAIMER
For Informational/Educational Use Only: This indicator is provided for informational and educational purposes only. It does not constitute financial, investment, or trading advice, nor is it a recommendation to buy or sell any asset.
Use at Your Own Risk: All trading decisions you make based on the information or signals generated by this indicator are made solely at your own risk.
No Guarantee of Performance: Past performance is not an indicator of future results. The author makes no guarantee regarding the accuracy of the signals or future profitability.
No Liability: The author shall not be held liable for any financial losses or damages incurred directly or indirectly from the use of this indicator.
Signals Are Not Recommendations: The alerts and visual signals (e.g., crossovers) generated by this tool are not direct recommendations to buy or sell. They are technical observations for your own analysis and consideration.

Volume Weighted Volatility RegimeThe Volume-Weighted Volatility Regime (VWVR) is a market analysis tool that dissects total volatility to classify the current market 'character' or 'regime'. Using a Linear Regression model, it decomposes volatility into Trend, Residual (mean-reversion), and Within-Bar (noise) components.
Key Features:
Seven-Stage Regime Classification: The indicator's primary output is a regime value from -3 to +3, identifying the market state:
+3 (Strong Bull Trend): High directional, upward volatility.
+2 (Choppy Bull): Moderate upward trend with noise.
+1 (Quiet Bull): Low volatility, slight upward drift.
0 (Neutral): No clear directional bias.
-1 (Quiet Bear): Low volatility, slight downward drift.
-2 (Choppy Bear): Moderate downward trend with noise.
-3 (Strong Bear Trend): High directional, downward volatility.
Advanced Volatility Decomposition: The regime is derived from a three-component volatility model that separates price action into Trend (momentum), Residual (mean-reversion), and Within-Bar (noise) variance. The classification is determined by comparing the 'Trend' ratio against the user-defined 'Trend Threshold' and 'Quiet Threshold'.
Dual-Level Analysis: The indicator analyzes market character on two levels simultaneously:
Inter-Bar Regime (Background Color): Based on the main StdDev Length, showing the overall market character.
Intra-Bar Regime (Column Color): Based on a high-resolution analysis within each single bar ('Intra-Bar Timeframe'), showing the micro-structural character.
Calculation Options:
Statistical Model: The 'Estimate Bar Statistics' option (enabled by default) uses a statistical model ('Estimator') to perform the decomposition. (Assumption: In this mode, the Source input is ignored, and an estimated mean for each bar is used instead).
Normalization: An optional 'Normalize Volatility' setting calculates an Exponential Regression Curve (log-space).
Volume Weighting: An option (Volume weighted) applies volume weighting to all volatility calculations.
Multi-Timeframe (MTF) Capability: The entire dual-level analysis can be run on a higher timeframe (using the Timeframe input), with standard options to handle gaps (Fill Gaps) and prevent repainting (Wait for...).
Integrated Alerts: Includes 22 comprehensive alerts that trigger whenever the 'Inter-Bar Regime' or the 'Intra-Bar Regime' crosses one of the key thresholds (e.g., 'Regime crosses above Neutral Line'), or when the 'Intra-Bar Dominance' crosses the 50% mark.
Caution: Real-Time Data Behavior (Intra-Bar Repainting) This indicator uses high-resolution intra-bar data. As a result, the values on the current, unclosed bar (the real-time bar) will update dynamically as new intra-bar data arrives. This behavior is normal and necessary for this type of analysis. Signals should only be considered final after the main chart bar has closed.
DISCLAIMER
For Informational/Educational Use Only: This indicator is provided for informational and educational purposes only. It does not constitute financial, investment, or trading advice, nor is it a recommendation to buy or sell any asset.
Use at Your Own Risk: All trading decisions you make based on the information or signals generated by this indicator are made solely at your own risk.
No Guarantee of Performance: Past performance is not an indicator of future results. The author makes no guarantee regarding the accuracy of the signals or future profitability.
No Liability: The author shall not be held liable for any financial losses or damages incurred directly or indirectly from the use of this indicator.
Signals Are Not Recommendations: The alerts and visual signals (e.g., crossovers) generated by this tool are not direct recommendations to buy or sell. They are technical observations for your own analysis and consideration.

Volume Weighted Intra Bar LR Standard DeviationThis indicator analyzes market character by providing a detailed view of volatility. It applies a Linear Regression model to intra-bar price action, dissecting the total volatility of each bar into three distinct components.
Key Features:
Three-Component Volatility Decomposition: By analyzing a lower timeframe ('Intra-Bar Timeframe'), the indicator separates each bar's volatility into:
Trend Volatility (Green/Red): Volatility explained by the intra-bar linear regression slope (Momentum).
Residual Volatility (Yellow): Volatility from price oscillating around the intra-bar trendline (Mean-Reversion).
Within-Bar Volatility (Blue): Volatility derived from the range of each intra-bar candle (Noise/Choppiness).
Layered Column Visualization: The indicator plots these components as a layered column chart. The size of each colored layer visually represents the dominance of each volatility character.
Dual Display Modes: The indicator offers two modes to visualize this decomposition:
Absolute Mode: Displays the total standard deviation as the column height, showing the absolute magnitude of volatility and the contribution of each component.
Normalized Mode: Displays the components as a 100% stacked column chart (scaled from 0 to 1), focusing purely on the percentage ratio of Trend, Residual, and Noise.
Calculation Options:
Statistical Model: The 'Estimate Bar Statistics' option (enabled by default) uses a statistical model ('Estimator') to perform the decomposition. (Assumption: In this mode, the Source input is ignored, and an estimated mean for each bar is used instead).
Normalization: An optional 'Normalize Volatility' setting calculates an Exponential Regression Curve (log-space).
Volume Weighting: An option (Volume weighted) applies volume weighting to all intra-bar calculations.
Multi-Component Pivot Detection: Includes a pivot detector that identifies significant turning points (highs and lows) in both the Total Volatility and the Trend Volatility Ratio. (Note: These pivots are only plotted when 'Plot Mode' is set to 'Absolute').
Note on Confirmation (Lag): Pivot signals are confirmed using a lookback method. A pivot is only plotted after the Pivot Right Bars input has passed, which introduces an inherent lag.
Multi-Timeframe (MTF) Capability:
MTF Analysis: The entire intra-bar analysis can be run on a higher timeframe (using the Timeframe input), with standard options to handle gaps (Fill Gaps) and prevent repainting (Wait for...).
Limitation: The Pivot detection (Calculate Pivots) is disabled if a Higher Timeframe (HTF) is selected.
Integrated Alerts: Includes 9 comprehensive alerts for:
Volatility character changes (e.g., 'Character Change from Noise to Trend').
Dominant character emerging (e.g., 'Bullish Trend Character Emerging').
Total Volatility pivot (High/Low) detection.
Trend Volatility pivot (High/Low) detection.
Caution! Real-Time Data Behavior (Intra-Bar Repainting) This indicator uses high-resolution intra-bar data. As a result, the values on the current, unclosed bar (the real-time bar) will update dynamically as new intra-bar data arrives. This behavior is normal and necessary for this type of analysis. Signals should only be considered final after the main chart bar has closed.
DISCLAIMER
For Informational/Educational Use Only: This indicator is provided for informational and educational purposes only. It does not constitute financial, investment, or trading advice, nor is it a recommendation to buy or sell any asset.
Use at Your Own Risk: All trading decisions you make based on the information or signals generated by this indicator are made solely at your own risk.
No Guarantee of Performance: Past performance is not an indicator of future results. The author makes no guarantee regarding the accuracy of the signals or future profitability.
No Liability: The author shall not be held liable for any financial losses or damages incurred directly or indirectly from the use of this indicator.
Signals Are Not Recommendations: The alerts and visual signals (e.g., crossovers) generated by this tool are not direct recommendations to buy or sell. They are technical observations for your own analysis and consideration.

Volume Weighted Intra Bar Standard DeviationThis indicator provides a high-resolution analysis of market volatility by dissecting each bar on the chart into its fundamental components. It uses data from a lower, intra-bar timeframe to separate the total volatility of a single bar into its 'directional' and 'non-directional' parts.
Key Features:
Intra-Bar Volatility Decomposition: For each bar on the chart, the indicator analyzes the underlying price action on a smaller timeframe ('Intra-Bar Timeframe') and quantifies two types of volatility:
Between-Bar Volatility (Directional): Calculated from price movements between the intra-bar candles. This component represents the directional, trending price action within the main bar.
Within-Bar Volatility (Non-Directional): Calculated from price fluctuations inside each intra-bar candle. This component represents the choppy, noisy, or ranging price action.
Dual Display Modes: The indicator offers two modes to visualize this information:
Absolute Mode: Plots the total standard deviation as a stacked column chart, showing the absolute magnitude of volatility and the contribution of each component.
Normalized Mode: Plots the components as a 100% stacked column chart (scaled from 0 to 1), focusing purely on the percentage ratio of 'between-bar' (trending) and 'within-bar' (choppy) volatility.
Calculation Options:
Statistical Model: The 'Estimate Bar Statistics' option (enabled by default) uses a statistical model ('Estimator') to perform the decomposition. (Assumption: In this mode, the Source input is ignored, and an estimated mean for each bar is used instead).
Normalization: An optional 'Normalize Volatility' setting calculates volatility in percentage terms (log-space).
Volume Weighting: An option (Volume weighted) applies volume weighting to all intra-bar volatility calculations.
Volatility Pivot Detection: Includes a built-in pivot detector that identifies significant turning points (highs and lows) in the total volatility line. (Note: This is only visible in 'Absolute Mode').
Note on Confirmation (Lag): Pivot signals are confirmed using a lookback method. A pivot is only plotted after the Pivot Right Bars input has passed, which introduces an inherent lag.
Multi-Timeframe (MTF) Capability:
MTF Analysis Lines: The entire intra-bar analysis can be run on a higher timeframe (using the Timeframe input), with standard options to handle gaps (Fill Gaps) and prevent repainting (Wait for...).
Limitation: The Pivot detection (Calculate Pivots) is disabled if a Higher Timeframe (HTF) is selected.
Integrated Alerts: Includes 6 alerts for:
Volatility character changes (e.g., 'Character Change from Choppy to Trend').
Dominant character emerging (e.g., 'Trend Character Emerging').
Total Volatility pivot (High/Low) detection.
Caution: Real-Time Data Behavior (Intra-Bar Repainting) This indicator uses high-resolution intra-bar data. As a result, the values on the current, unclosed bar (the real-time bar) will update dynamically as new intra-bar data arrives. This behavior is normal and necessary for this type of analysis. Signals should only be considered final after the main chart bar has closed.
DISCLAIMER
For Informational/Educational Use Only: This indicator is provided for informational and educational purposes only. It does not constitute financial, investment, or trading advice, nor is it a recommendation to buy or sell any asset.
Use at Your Own Risk: All trading decisions you make based on the information or signals generated by this indicator are made solely at your own risk.
No Guarantee of Performance: Past performance is not an indicator of future results. The author makes no guarantee regarding the accuracy of the signals or future profitability.
No Liability: The author shall not be held liable for any financial losses or damages incurred directly or indirectly from the use of this indicator.
Signals Are Not Recommendations: The alerts and visual signals (e.g., crossovers) generated by this tool are not direct recommendations to buy or sell. They are technical observations for your own analysis and consideration.

Volume Weighted LR Standard DeviationThis indicator analyzes market character by decomposing total volatility into three distinct, interpretable components based on a Linear Regression model.
Key Features:
Three-Component Volatility Decomposition: The indicator separates volatility based on the 'Estimate Bar Statistics' option.
Standard Mode (Estimate Bar Statistics = OFF): Calculates volatility based on the selected Source (dies führt hauptsächlich zu 'Trend'- und 'Residual'-Volatilität).
Decomposition Mode (Estimate Bar Statistics = ON): The indicator uses a statistical model ('Estimator') to calculate within-bar volatility. (Assumption: In this mode, the Source input is ignored, and an estimated mean for each bar is used instead). This separates volatility into:
Trend Volatility (Green/Red): Volatility explained by the regression's slope (Momentum).
Residual Volatility (Yellow): Volatility from price oscillating around the regression line (Mean-Reversion).
Within-Bar Volatility (Blue): Volatility from the high-low range of each bar (Noise/Choppiness).
Dual Display Modes: The indicator offers two modes to visualize this decomposition:
Absolute Mode: Displays the total standard deviation as a stacked area chart, partitioned by the variance ratio of the three components.
Normalized Mode: Displays the direct variance ratio (proportion) of each component relative to the total (0-1), ideal for identifying the dominant market character.
Calculation Options:
Normalization: An optional 'Normalize Volatility' setting calculates an Exponential Regression Curve (log-space), making the analysis suitable for growth assets.
Volume Weighting: An option (Volume weighted) applies volume weighting to all regression and volatility calculations.
Multi-Component Pivot Detection: Includes a pivot detector that identifies significant turning points (highs and lows) in both the Total Volatility and the Trend Volatility Ratio. (Note: These pivots are only plotted when 'Plot Mode' is set to 'Absolute').
Note on Confirmation (Lag): Pivot signals are confirmed using a lookback method. A pivot is only plotted after the Pivot Right Bars input has passed, which introduces an inherent lag.
Multi-Timeframe (MTF) Capability:
MTF Volatility Lines: The volatility lines can be calculated on a higher timeframe, with standard options to handle gaps (Fill Gaps) and prevent repainting (Wait for...).
Limitation: The Pivot detection (Calculate Pivots) is disabled if a Higher Timeframe (HTF) is selected.
Integrated Alerts: Includes 9 comprehensive alerts for:
Volatility character changes (e.g., 'Character Change from Noise to Trend').
Dominant character emerging (e.g., 'Bullish Trend Character Emerging').
Total Volatility pivot (High/Low) detection.
Trend Volatility pivot (High/Low) detection.
DISCLAIMER
For Informational/Educational Use Only: This indicator is provided for informational and educational purposes only. It does not constitute financial, investment, or trading advice, nor is it a recommendation to buy or sell any asset.
Use at Your Own Risk: All trading decisions you make based on the information or signals generated by this indicator are made solely at your own risk.
No Guarantee of Performance: Past performance is not an indicator of future results. The author makes no guarantee regarding the accuracy of the signals or future profitability.
No Liability: The author shall not be held liable for any financial losses or damages incurred directly or indirectly from the use of this indicator.
Signals Are Not Recommendations: The alerts and visual signals (e.g., crossovers) generated by this tool are not direct recommendations to buy or sell. They are technical observations for your own analysis and consideration.

Volume Weighted Standard DeviationThis indicator calculates the Standard Deviation and decomposes total volatility into its core components, allowing to analyze the underlying character of the market.
Key Features:
Volatility Decomposition: The indicator separates volatility based on the 'Estimate Bar Statistics' option.
Standard Mode (Estimate Bar Statistics = OFF): Calculates a simple (Volume-Weighted) Standard Deviation of the selected Source.
Decomposition Mode (Estimate Bar Statistics = ON): The indicator uses a statistical model ('Estimator') to calculate within-bar volatility (choppiness, noise) and between-bar volatility (trending moves). (Assumption: In this mode, the Source input is ignored, and an estimated mean for each bar is used instead).
Dual Display Modes: The indicator offers two modes to visualize this information:
Absolute Mode: Plots the total standard deviation as a stacked area chart, showing the proportional contribution of the 'Between' and 'Within' components.
Normalized Mode: Plots the direct ratio of each component's variance (from 0 to 1), making it easy to identify which character is dominant.
Calculation Options: The volatility calculation can be optionally Volume weighted. An optional Normalize Volatility setting performs the calculation in logarithmic space, making volatility comparable across different price scales.
Volatility Pivot Detection: Includes a built-in pivot detector that identifies significant turning points (highs and lows) in the total volatility line. (Note: This is only visible in 'Absolute Mode').
Note on Confirmation (Lag): Pivot signals are confirmed using a lookback method. A pivot is only plotted after the Pivot Right Bars input has passed, which introduces an inherent lag.
Multi-Timeframe (MTF) Capability:
MTF Volatility Lines: The volatility lines can be calculated on a higher timeframe, with standard options to handle gaps (Fill Gaps) and prevent repainting (Wait for...).
Limitation: The Pivot detection (Calculate Pivots) is disabled if a Higher Timeframe (HTF) is selected.
Integrated Alerts: Includes 6 alerts for:
Volatility character changes (e.g., 'Trend Character Emerging', 'Character Change from Trend to Choppy').
Volatility pivot (high or low) detection.
DISCLAIMER
For Informational/Educational Use Only: This indicator is provided for informational and educational purposes only. It does not constitute financial, investment, or trading advice, nor is it a recommendation to buy or sell any asset.
Use at Your Own Risk: All trading decisions you make based on the information or signals generated by this indicator are made solely at your own risk.
No Guarantee of Performance: Past performance is not an indicator of future results. The author makes no guarantee regarding the accuracy of the signals or future profitability.
No Liability: The author shall not be held liable for any financial losses or damages incurred directly or indirectly from the use of this indicator.
Signals Are Not Recommendations: The alerts and visual signals (e.g., crossovers) generated by this tool are not direct recommendations to buy or sell. They are technical observations for your own analysis and consideration.

Volume Weighted Average True RangeThis indicator calculates a customizable version of the Average True Range (ATR), a tool for measuring market volatility. It enhances the standard ATR with volume weighting, a dual-smoothing process, normalization, and volatility pivot detection.
Key Features:
Volume Weighting: An option (Volume weighted) allows for volume to be incorporated into the volatility calculation. This provides a measure of "volume-adjusted" volatility that is more responsive to significant market activity.
Dual Smoothing Process: For noise reduction, the indicator employs a two-stage smoothing process. It first calculates a smoothed True Range (TR) over a user-defined period (TR Length) before applying the final ATR moving average (ATR Length & ATR Smooth).
Normalization (Percentage Volatility): An optional 'Normalize' mode calculates the ATR as a percentage of the price. This allows for consistent volatility comparison across different assets and over long time periods.
Volatility Pivot Detection: The indicator includes a built-in pivot detector that identifies significant turning points (highs and lows) in the ATR line itself, signaling potential shifts in volatility.
Note on Confirmation (Lag): Pivot signals are confirmed using a lookback method. A pivot is only plotted after the Pivot Right Bars input has passed. This is essential for ensuring the signal is non-repainting but introduces an inherent lag.
Multi-Timeframe (MTF) Capability:
MTF ATR Line: The ATR line itself can be calculated on a different timeframe, with standard options to handle gaps (Fill Gaps) and prevent repainting (Wait for...).
Limitation: The Pivot detection (Calculate Pivots) is disabled if a Higher Timeframe (HTF) is selected.
Integrated Alerts: Includes alerts that trigger when a new volatility pivot (high or low) is detected in the ATR line.
DISCLAIMER
For Informational/Educational Use Only: This indicator is provided for informational and educational purposes only. It does not constitute financial, investment, or trading advice, nor is it a recommendation to buy or sell any asset.
Use at Your Own Risk: All trading decisions you make based on the information or signals generated by this indicator are made solely at your own risk.
No Guarantee of Performance: Past performance is not an indicator of future results. The author makes no guarantee regarding the accuracy of the signals or future profitability.
No Liability: The author shall not be held liable for any financial losses or damages incurred directly or indirectly from the use of this indicator.
Signals Are Not Recommendations: The alerts and visual signals (e.g., crossovers) generated by this tool are not direct recommendations to buy or sell. They are technical observations for your own analysis and consideration.

Volume Weighted Price OscillatorThis indicator calculates the Percentage Price Oscillator (PPO), a momentum oscillator similar to the MACD. It displays the distance between two moving averages as a percentage, making it comparable across different assets. This implementation enhances the PPO with optional volume weighting and a built-in divergence engine.
Key Features:
Customizable MA & Volume Weighting: Both the fast and slow moving averages (and the signal line) can be customized using different MA types (e.g., EMA, SMA, WMA). An option (Volume weighted) applies volume weighting to all three MAs.
MACD-Style Display: Provides the three core components: the PPO line (momentum), a signal line (trigger), and a histogram (momentum acceleration). The histogram is color-coded to show increasing or decreasing momentum.
Full Divergence Suite (Class A, B, C): A built-in divergence engine automatically detects and plots all three major divergence classes between price and the PPO line:
Regular (A): Signals potential trend reversals.
Hidden (B): Signals potential trend continuations.
Exaggerated (C): Signals weakness at double tops/bottoms.
Divergence Filtering and Visualization:
Price Tolerance Filter: Divergence detection is enhanced with a percentage-based price tolerance (pivPrcTol) to filter out insignificant market noise.
Persistent Visualization: Divergence markers are plotted for the entire duration of the signal and are visually anchored to the PPO level of the confirming pivot.
Note on Confirmation (Lag): Divergence signals rely on a pivot confirmation method to ensure they do not repaint.
The Start of a- divergence is only detected after the confirming pivot is fully formed (a delay based on Pivot Right Bars).
The End of a divergence is detected either instantly (if the signal is invalidated by price action) or with a delay (when a new, non-divergent pivot is confirmed).
Multi-Timeframe (MTF) Capability:
MTF PPO Lines: The PPO, signal line, and histogram can be calculated on a higher timeframe, with standard options to handle gaps (Fill Gaps) and prevent repainting (Wait for...).
Limitation: The Divergence detection engine (pivDiv) is disabled if a timeframe other than the chart's timeframe is selected. Divergences are only calculated on the active chart timeframe.
Integrated Alerts: Includes 18 comprehensive alerts for:
The start and end of all 6 divergence types.
The PPO line crossing its signal line.
The PPO line crossing the zero line.
The histogram changing direction (reverting).
DISCLAIMER
For Informational/Educational Use Only: This indicator is provided for informational and educational purposes only. It does not constitute financial, investment, or trading advice, nor is it a recommendation to buy or sell any asset.
Use at Your Own Risk: All trading decisions you make based on the information or signals generated by this indicator are made solely at your own risk.
No Guarantee of Performance: Past performance is not an indicator of future results. The author makes no guarantee regarding the accuracy of the signals or future profitability.
No Liability: The author shall not be held liable for any financial losses or damages incurred directly or indirectly from the use of this indicator.
Signals Are Not Recommendations: The alerts and visual signals (e.g., crossovers) generated by this tool are not direct recommendations to buy or sell. They are technical observations for your own analysis and consideration.

Volume Weighted Stochastic RSIThis indicator calculates the Stochastic RSI, enhanced with optional Volume Weighting (VWStochRSI). It measures the level of a (Volume-Weighted) RSI relative to its high-low range over a set period, providing a sensitive momentum oscillator.
Key Features:
Volume-Weighted Core: The indicator is built on a Relative Strength Index (RSI) that can be optionally volume-weighted (Volume weighted).
Customizable Smoothing: The %K and %D lines are smoothed using a customizable moving average. The MA type (Smooth Method) can be selected (e.g., EMA, SMA, WMA) and will also be volume-weighted if the main Volume weighted option is enabled.
Full Divergence Suite (Class A, B, C): The primary feature is the integrated divergence engine. It automatically detects and plots all three major types of divergences:
Regular (A): Signals potential trend reversals.
Hidden (B): Signals potential trend continuations.
Exaggerated (C): Signals weakness at double tops/bottoms.
Divergence Filtering and Visualization:
Price Tolerance Filter: Divergence detection is enhanced with a percentage-based price tolerance (pivPrcTol) to filter out insignificant market noise.
Persistent Visualization: Divergence markers are plotted for the entire duration of the signal and are visually anchored to the %K line level of the confirming pivot.
Note on Confirmation (Lag): Divergence signals rely on a pivot confirmation method to ensure they do not repaint.
The Start of a- divergence is only detected after the confirming pivot is fully formed (a delay based on Pivot Right Bars).
The End of a divergence is detected either instantly (if the signal is invalidated by price action) or with a delay (when a new, non-divergent pivot is confirmed).
Multi-Timeframe (MTF) Capability:
MTF VWStochRSI Lines: The %K and %D lines can be calculated on a higher timeframe, with standard options to handle gaps (Fill Gaps) and prevent repainting (Wait for...).
Limitation: The Divergence detection engine (pivDiv) is disabled if a timeframe other than the chart's timeframe is selected. Divergences are only calculated on the active chart timeframe.
Integrated Alerts: Includes 20 comprehensive alerts for:
The start and end of all 6 divergence types.
The %K line crossing the %D line.
The %K line crossing the Overbought, Oversold, or 50-level lines.
DISCLAIMER
For Informational/Educational Use Only: This indicator is provided for informational and educational purposes only. It does not constitute financial, investment, or trading advice, nor is it a recommendation to buy or sell any asset.
Use at Your Own Risk: All trading decisions you make based on the information or signals generated by this indicator are made solely at your own risk.
No Guarantee of Performance: Past performance is not an indicator of future results. The author makes no guarantee regarding the accuracy of the signals or future profitability.
No Liability: The author shall not be held liable for any financial losses or damages incurred directly or indirectly from the use of this indicator.
Signals Are Not Recommendations: The alerts and visual signals (e.g., crossovers) generated by this tool are not direct recommendations to buy or sell. They are technical observations for your own analysis and consideration.

Volume Weighted Relative Strength IndexThis indicator calculates the Relative Strength Index (RSI) and enhances it with optional volume weighting (VWRSI). It also includes a customizable signal line and a built-in divergence detection engine.
Key Features:
Volume-Weighted Calculation: An option (Volume weighted) allows for volume to be incorporated into the calculation of both the RSI itself and its moving average signal line, making the oscillator more sensitive to high-volume price changes.
Customizable Signal Line: Includes an optional moving average of the VWRSI, which serves as a signal line. The type of MA (Smooth Method) and its length can be customized.
Full Divergence Suite (Class A, B, C): The primary feature is the integrated divergence engine. It automatically detects and plots all three major types of divergences:
Regular (A): Signals potential trend reversals.
Hidden (B): Signals potential trend continuations.
Exaggerated (C): Signals weakness at double tops/bottoms.
Divergence Filtering and Visualization:
Price Tolerance Filter: Divergence detection is enhanced with a percentage-based price tolerance (pivPrcTol) to filter out insignificant market noise.
Persistent Visualization: Divergence markers are plotted for the entire duration of the signal and are visually anchored to the VWRSI level of the confirming pivot.
Note on Confirmation (Lag): Divergence signals rely on a pivot confirmation method to ensure they do not repaint.
The Start of a- divergence is only detected after the confirming pivot is fully formed (a delay based on Pivot Right Bars).
The End of a divergence is detected either instantly (if the signal is invalidated by price action) or with a delay (when a new, non-divergent pivot is confirmed).
Multi-Timeframe (MTF) Capability:
MTF VWRSI Line: The VWRSI and its signal line can be calculated on a higher timeframe, with standard options to handle gaps (Fill Gaps) and prevent repainting (Wait for...).
Limitation: The Divergence detection engine (pivDiv) is disabled if a timeframe other than the chart's timeframe is selected. Divergences are only calculated on the active chart timeframe.
Integrated Alerts: Includes 20 comprehensive alerts for:
The start and end of all 6 divergence types.
The VWRSI crossing its signal line.
The VWRSI crossing the Overbought, Oversold, or 50-level lines.
DISCLAIMER
For Informational/Educational Use Only: This indicator is provided for informational and educational purposes only. It does not constitute financial, investment, or trading advice, nor is it a recommendation to buy or sell any asset.
Use at Your Own Risk: All trading decisions you make based on the information or signals generated by this indicator are made solely at your own risk.
No Guarantee of Performance: Past performance is not an indicator of future results. The author makes no guarantee regarding the accuracy of the signals or future profitability.
No Liability: The author shall not be held liable for any financial losses or damages incurred directly or indirectly from the use of this indicator.
Signals Are Not Recommendations: The alerts and visual signals (e.g., crossovers) generated by this tool are not direct recommendations to buy or sell. They are technical observations for your own analysis and consideration.

Relative Distance to Moving AverageThis indicator calculates the Relative Distance to a Moving Average (RDMA), a momentum oscillator that measures how overextended a price is from its moving average baseline. It expresses this distance as a percentage, oscillating around a zero line. High positive values may indicate overbought conditions, while large negative values may suggest oversold conditions.
Key Features:
Customizable MA Baseline: The oscillator's baseline is a moving average. Users can select from a wide range of MA types (e.g., EMA, SMA, WMA) and apply volume weighting (Volume weighted) for enhanced responsiveness.
Normalization (Geometric Average): Includes an optional 'Normalize' mode. When enabled, the indicator uses a Geometric Moving Average (GMA) as its baseline and measures the percentage distance from this compound growth average, making it suitable for exponential markets.
Full Divergence Suite (Class A, B, C): The indicator's primary feature is its integrated divergence engine. It automatically detects and plots all three major divergence classes between price and the RDMA:
Regular (A): Signals potential trend exhaustion and reversals.
Hidden (B): Signals potential trend continuations during pullbacks.
Exaggerated (C): Signals weakness at double tops/bottoms.
Divergence Filtering and Visualization:
Price Tolerance Filter: Divergence detection is enhanced with a percentage-based price tolerance (pivPrcTol) to filter out insignificant market noise.
Persistent Visualization: Divergence markers are plotted for the entire duration of the signal and are visually anchored to the RDMA level of the confirming pivot.
Note on Confirmation (Lag): Divergence signals rely on a pivot confirmation method to ensure they do not repaint.
The Start of a- divergence is only detected after the confirming pivot is fully formed (a delay based on Pivot Right Bars).
The End of a divergence is detected either instantly (if the signal is invalidated by price action) or with a delay (when a new, non-divergent pivot is confirmed).
Multi-Timeframe (MTF) Capability:
MTF RDMA Line: The RDMA oscillator itself can be calculated on a higher timeframe, with standard options to handle gaps (Fill Gaps) and prevent repainting (Wait for...).
Limitation: The Divergence detection engine (pivDiv) is disabled if a timeframe other than the chart's timeframe is selected. Divergences are only calculated on the active chart timeframe.
Integrated Alerts: Includes 14 comprehensive alerts for:
The start and end of all 6 divergence types.
The RDMA oscillator crossing the zero line.
DISCLAIMER
For Informational/Educational Use Only: This indicator is provided for informational and educational purposes only. It does not constitute financial, investment, or trading advice, nor is it a recommendation to buy or sell any asset.
Use at Your Own Risk: All trading decisions you make based on the information or signals generated by this indicator are made solely at your own risk.
No Guarantee of Performance: Past performance is not an indicator of future results. The author makes no guarantee regarding the accuracy of the signals or future profitability.
No Liability: The author shall not be held liable for any financial losses or damages incurred directly or indirectly from the use of this indicator.
Signals Are Not Recommendations: The alerts and visual signals (e.g., crossovers) generated by this tool are not direct recommendations to buy or sell. They are technical observations for your own analysis and consideration.
