📱 EMA Stability Mobile + Pulse BG + Alerts (edegrano)User Manual: 📱 EMA Stability Mobile + Pulse BG + Alerts
Overview
This indicator monitors the stability of the market trend by analyzing the relative positions and gaps between the 50, 100, and 200 EMAs (Exponential Moving Averages) on a user-defined higher timeframe. It detects when the EMAs align bullishly or bearishly with a minimum gap tolerance and provides visual signals, background pulses, and alerts when such stable conditions start.
Key Features
Uses 3 EMAs (50, 100, 200) from a selectable timeframe.
Checks if EMAs are aligned in a stable bullish or bearish order with configurable minimum percentage gaps.
Confirms that price is not touching the EMA50 (to avoid instability).
Displays arrow, text status ("Bull", "Bear", or "Unst" for unstable).
Shows a strength score representing the average EMA gap relative to tolerance.
Pulses the chart background green or red when stability starts.
Sends alerts when a new bullish or bearish stability condition begins.
Displays a table summary at the top center of the chart.
Inputs
Parameter Description Default Value
EMA TF Timeframe to fetch EMA values from. "15" (15 min)
Min Gap (%) Minimum % gap required between EMAs for stability. 0.1%
Background Opacity Opacity level (0-100) for the pulse background color. 85
How It Works
The indicator fetches EMA50, EMA100, and EMA200 values from the chosen timeframe.
It calculates the percentage gap between EMA50 & EMA100 and EMA100 & EMA200.
It checks if:
For bullish stability: EMA50 > EMA100 by at least the tolerance and EMA100 > EMA200 by at least tolerance, AND current candle’s low is above EMA50.
For bearish stability: EMA50 < EMA100 by at least the tolerance and EMA100 < EMA200 by at least tolerance, AND current candle’s high is below EMA50.
When a stable bullish or bearish condition starts (i.e., it was not stable the previous bar), it triggers a pulse on the background and sends an alert.
The strength score reflects how strong the EMA gaps are relative to the minimum gap set.
A table displays key info: stability arrow, status, strength percentage, and gap percentages.
Visuals on Chart
Arrow:
▲ = Bullish Stability
▼ = Bearish Stability
• = Unstable (no stability detected)
Status Text: "Bull", "Bear", or "Unst"
Background Pulse: Green for bullish stability start, red for bearish stability start (fades based on opacity setting).
Table at top center shows:
EMA stability arrow and status
Strength score (%)
Percentage gaps between EMAs 50-100 and 100-200
Alerts
The indicator sends alerts when a new stable bullish or bearish trend begins.
Alert messages include:
📈 Bullish Stability detected on ( )
📉 Bearish Stability detected on ( )
Alerts are triggered only once per bar close on the condition's start.
Recommended Usage Tips
Adjust EMA TF to your preferred higher timeframe for trend confirmation.
Set Min Gap (%) depending on how strict you want the gap between EMAs for stability (smaller gap = more sensitive).
Use Background Opacity to make pulses subtle or prominent according to your preference.
Combine this indicator with price action or other tools for entry/exit timing.
Use alerts to be notified instantly when stable trends form.
스크립트에서 "gaps"에 대해 찾기

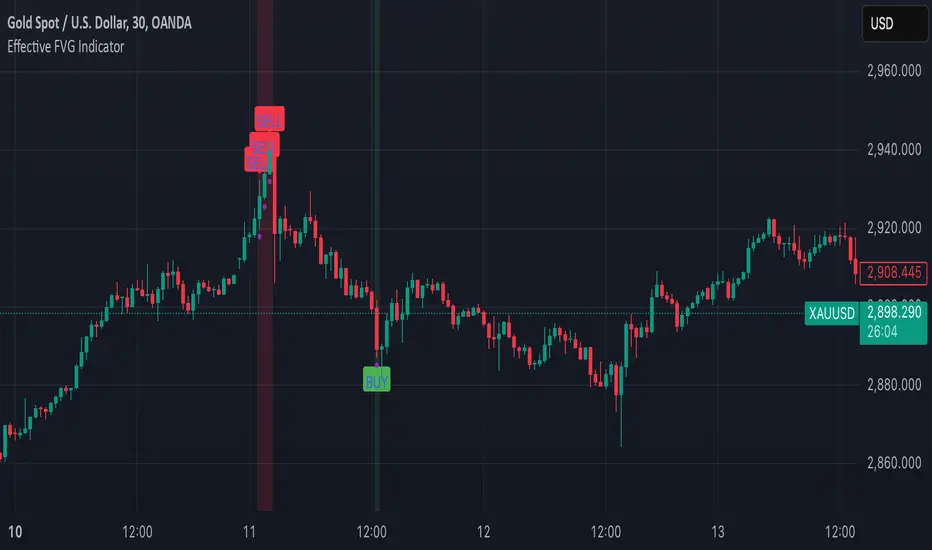
Effective FVG Indicator - ImranDescription:
The Effective FVG Indicator is a technical analysis tool designed to identify Fair Value Gaps (FVGs) in financial markets. FVGs occur when there is a significant gap between the closing price of one session and the opening price of the next session, often indicating a potential reversal point. This indicator uses volume and price movement criteria to confirm and mark these gaps effectively.
Key Features:
Fair Value Gap Detection : Identifies both bullish and bearish FVGs based on significant gaps in price.
Volume Confirmation : Confirms FVGs with high volume, ensuring that the gap is not due to a lack of liquidity.
Price Imbalance : Ensures that the gap is accompanied by a large price movement within the session, indicating strong market sentiment.
Buy/Sell Signals : Marks bullish FVGs with a green "BUY" label below the bar and bearish FVGs with a red "SELL" label above the bar.
Background Highlighting : Highlights the background with a semi-transparent green or red color when a valid FVG is detected, making it easy to spot significant gaps.
Order Block Overlapping Drawing [TradingFinder]🔵 Introduction
Technical analysis is a fundamental tool in financial markets, helping traders identify key areas on price charts to make informed trading decisions. The ICT (Inner Circle Trader) style, developed by Michael Huddleston, is one of the most advanced methods in this field.
It enables traders to precisely identify and exploit critical zones such as Order Blocks, Breaker Blocks, Fair Value Gaps (FVGs), and Inversion Fair Value Gaps (IFVGs).
To streamline and simplify the use of these key areas, a library has been developed in Pine Script, the scripting language for the TradingView platform. This library allows you to automatically detect overlapping zones between Order Blocks and other similar areas, and visually display them on your chart.
This tool is particularly useful for creating indicators like Balanced Price Range (BPR) and ICT Unicorn Model.
🔵 How to Use
This section explains how to use the Pine Script library. This library assists you in easily identifying and analyzing overlapping areas between Order Blocks and other zones, such as Breaker Blocks and Fair Value Gaps.
To add "Order Block Overlapping Drawing", you must first add the following code to your script.
import TFlab/OrderBlockOverlappingDrawing/1
🟣 Inputs
The library includes the "OBOverlappingDrawing" function, which you can use to detect and display overlapping zones. This function identifies and draws overlapping zones based on the Order Block type, trigger conditions, previous and current prices, and other relevant parameters.
🟣 Parameters
OBOverlappingDrawing(OBType , TriggerConditionOrigin, distalPrice_Pre, proximalPrice_Pre , distalPrice_Curr, proximalPrice_Curr, Index_Curr , OBValidGlobal, OBValidDis, MitigationLvL, ShowAll, Show, ColorZone) =>
OBType (string)
TriggerConditionOrigin (bool)
distalPrice_Pre (float)
proximalPrice_Pre (float)
distalPrice_Curr (float)
proximalPrice_Curr (float)
Index_Curr (int)
OBValidGlobal (bool)
OBValidDis (int)
MitigationLvL (string)
ShowAll (bool)
Show (bool)
ColorZone (color)
In this example, various parameters are defined to detect overlapping zones and draw them on the chart. Based on these settings, the overlapping areas will be automatically drawn on the chart.
OBType : All order blocks are summarized into two types: "Supply" and "Demand." You should input your Current order block type in this parameter. Enter "Demand" for drawing demand zones and "Supply" for drawing supply zones.
TriggerConditionOrigin : Input the condition under which you want the Current order block to be drawn in this parameter.
distalPrice_Pre : Generally, if each zone is formed by two lines, the farthest line from the price is termed Pervious "Distal." This input receives the price of the "Distal" line.
proximalPrice_Pre : Generally, if each zone is formed by two lines, the nearest line to the price is termed Previous "Proximal" line.
distalPrice_Curr : Generally, if each zone is formed by two lines, the farthest line from the price is termed Current "Distal." This input receives the price of the "Distal" line.
proximalPrice_Curr : Generally, if each zone is formed by two lines, the nearest line to the price is termed Current "Proximal" line.
Index_Curr : This input receives the value of the "bar_index" at the beginning of the order block. You should store the "bar_index" value at the occurrence of the condition for the Current order block to be drawn and input it here.
OBValidGlobal : This parameter is a boolean in which you can enter the condition that you want to execute to stop drawing the block order. If you do not have a special condition, you should set it to True.
OBValidDis : Order blocks continue to be drawn until a new order block is drawn or the order block is "Mitigate." You can specify how many candles after their initiation order blocks should continue. If you want no limitation, enter the number 4998.
MitigationLvL : This parameter is a string. Its inputs are one of "Proximal", "Distal" or "50 % OB" modes, which you can enter according to your needs. The "50 % OB" line is the middle line between distal and proximal.
ShowAll : This is a boolean parameter, if it is "true" the entire order of blocks will be displayed, and if it is "false" only the last block order will be displayed.
Show : You may need to manage whether to display or hide order blocks. When this input is "On", order blocks are displayed, and when it's "Off", order blocks are not displayed.
ColorZone : You can input your preferred color for drawing order blocks.
🟣 Output
Mitigation Alerts : This library allows you to leverage Mitigation Alerts to detect specific conditions that could lead to trend reversals. These alerts help you react promptly in your trades, ensuring better management of market shifts.
🔵 Conclusion
The Pine Script library provided is a powerful tool for technical analysis, especially in the ICT style. It enables you to detect overlapping zones between Order Blocks and other significant areas like Breaker Blocks and Fair Value Gaps, improving your trading strategies. By utilizing this tool, you can perform more precise analysis and manage risks effectively in your trades.

ICT Sessions_One Setup for Life [MK]The script plots the High/Low of the following trading sessions:
London - 02:00-05:00
NY AM - 09:30-12:00
New York Lunch - 12:00-13:30
New York PM - 13:30-16:00
Due to the high level of liquidity (resting orders), highs and lows of these sessions may be used as buy/sell areas and also as profit target areas. Typically, buy orders would be initiated below a session low and sell orders would be initiated above a
session high.
The script also plots 'RTH (Regular Trading Hours) Opening Gaps'. The RTH gaps are drawn from the closing price of regular trading at 16:15 (EST) to the open price of regular trading at 09:30 (EST). Gaps can be areas that traders might anticipate to be filled at some time in the future. A gap 'midline' is available if needed and yesterday RTH close line can be shown and extended to the current bar.
This script is simply a means to draw boxes around certain areas/periods on the charts. It is in no way a trading strategy and users should spend much time to study the concept and should also perform extensive back-testing before taking any trades.
By setting the lookback value to a much higher value then the default of 6, users can utilise the script to perform their own backtesting studies.
The above chart shows the default setup of the indicator. Note that the user has to choose how far (in days) to lookback and draw the sessions/gaps.
It is also possible to show the session high//low lines and extend them to the current bar time. If this is used it is advised to keep the lookback period as low as possible to ensure charts stay clean/uncluttered.
All boxes/lines styles/colors are fully customisable.

SMM - Smart Money IndicatorHello Traders,
SMM – Smart Money Indicator is a Smart Money Concepts indicator that is meant to make your trading a bit easier and take the guess work away. Our mission is to save your time with already marking up the chart for you (all automatic). This indicator will help you spot the point of interests a.k.a. Order Blocks, Supply and Demand zones and Fair Value Gaps. Our mission is to create the best Smart Money Concepts indicator on the market. For that we would like to receive your guy’s feedback on it.
Smart Money refers to the capital that institutional investors, central banks, and other professionals or financial institutions control. Market Structure is the foundation of price action trading, understanding price action is fundamental to SMC .
Market Structure based of fractals – We are using fractal-based market structure since it’s way stronger than for example an Eliot wave. So, we only get the clearest break of structure (BoS- Trend continuation) and Change of Character (CHoCH- Possible change of trend)
Features
- Changing the break type to either only the body or body and the wick
- Period of looking back to determine structure (combined with the supply and demand zones)
Multiple Time frame Supply and Demand – Displayed typically as the last up/down candle before a big move in the opposite direction. Great zones to entry from on the lower time frame, also you can target previous demand/supply zones as potential take profit areas.
Features
- Multiple time frame
- Changing the amount of candles to calculate the zones.
- Option to remove mitigated zones / change color
- Extending the HTF Box to current time. (If not mitigated)
Order Blocks – What we use for our lower time frame zones to enter from. It’s basically the same as supply and demand but then on a lower time frame. Most likely once prices come into your higher time frame Supply and Demand zones, we would scale down to the lower time frames and then wait for our pattern to entry.
Features
- Extending the LTF Box to current time. (If not mitigated)
- Options to remove mitigated zones / change color
Fair Value Gaps - Is also known as an imbalance. An FVG is an imbalance of orders for instance, for sellers to complete their trades, there must be buyers and vice versa so when a market receives to many of one kind of order buys or sells, and not enough of the order’s counterpart. When the amount is not balanced and to many orders are put in for one direction, it creates an imbalance where price likes to get back too. We have 2 different options that shows you all the imbalances but also one that only shows the structure breaking imbalances which we see as the most important one.
Features
- Plotting all Fair Value Gaps
- Plotting only structure breaking Fair Value Gaps
Previous Day High and Low – Will mark up the previous day high and low what could indicate that if price breaks out of the previous day high that it will most likely trend upwards. If it breaks below, it will most likely trend down for the upcoming time.
- Showing only the recent previous day high and low
- Showing all the previous high and lows
- Show nothing
Alerts – We’ve made possible that you can also choose to receive an alert on your device once price comes in to one of the supply and demand zones. (Must place the alerts function into your alert management tab on trading view) Only works if you add the alert on when you are on the same time frame as your supply and demand zones.
You can also choose to receive alerts when a supply or demand zone has been created.

Unfilled Gap DetectorThis indicator displays gaps on a chart within a specified range which have not been filled. It offers the ability to set the minimum gap size to detect as a multiple of the average true range (ATR), as well as the allowed distance from a gap fill for the gap to be considered filled. The use of ATR allows the gap threshold to dynamically change as the stock price and volatility change over time. Lastly, it offers the ability to show gaps which have been filled in addition to unfilled gaps.
The following describes each input's effect on the indicator.
Bars to Search Back: specifies how many bars back in the chart to search for gaps and gap fills (maximum 5000).
ATR Length: specifies the length of the ATR() function used for thresholding
Minimum ATR Multiple For Gap Detection: The minimum gap size as a multiple of the ATR
Minimum ATR Multiple For Gap Fill: The minimum distance between a bar high/low and a gap for it to be considered "filled" as a multiple of ATR

GAP based S/RThis Script is designed to show repeating pattern in the market, encountered by gaps.
Depending on the Gap, the Lines will be drawn in the selected color.
The Gap is checked from the lowest point of the old candle-body to the highest point of the new candle body for a bearish Gap and vice versa for bullish Gap.
The Script allows to:
- enable bearish gaps, bullish gaps or both
- adjust the minimum pips for the marketjump to be considered a gap
- adjust color of the bullish/bearish gap
- define how much bars should be considered in the history, where 4999 is the max value.
With this functionality and the showing patterns, it is possible to determine support and resistance zones.
When the script is used in markets/periods with many gaps and a high number of historic candles is watched, you might not see any horizontal lines at all -> please reduce the number of historical bars in order to draw an appropriate number of lines.

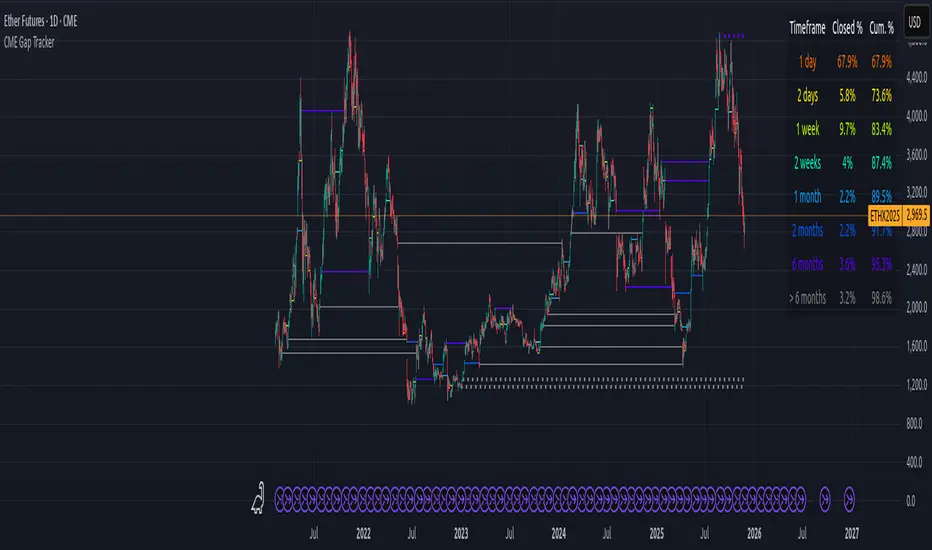
CME Gap Tracker + Live StatisticsThis script automatically finds the gaps inherent in the time data of any given chart, and displays them in color-coated buckets of how long it takes for the close of the gap to get filled. Add it on any CME Futures chart on the daily, and it will find all the weekend gaps. Set your period to an hour, and it will find the intraday gaps. Also displays a statistical calculation for each bucket.
Blitz Model
The Blitz indicator is a comprehensive market structure analysis tool designed specifically for the 4-hour timeframe. It identifies and visualizes key market movements including sweeps, fair value gaps (FVGs), and session-based liquidity levels.
1) Key Features :
A) Market Structure Analysis :
i) Sweep Detection: Identifies bullish and bearish sweeps of previous highs/lows.
ii) Double Purge Recognition: Detects when both bullish and bearish sweeps occur on the same candle.
iii) Fair Value Gap (FVG) Visualization: Displays imbalance zones with customizable box colors.
iV) Session-Based Analysis: Tracks Asian and London session highs/lows.
B) Multi-Timeframe Confirmations :
i) Layer 2 Validation System: Incorporates H1 and M15 timeframe confirmations.
ii) H1 Sweep Confirmations: Validates 4H signals with hourly sweep patterns.
iii) M15 Analysis: Includes both sweep and FVG confirmations from 15-minute timeframe.
C) Key Level Integration :
i) Daily 0.5 Level: Plots the midpoint of previous day's range with customizable styling.
ii) Session Liquidity: Identifies sweeps of Asian and London session extremes.
ii) FVG Interaction: Detects when sweeps occur near fair value gaps.
D) Customization Options :
i) Label Styling: Full control over label size, style, and colors for all signal types.
ii) Double Purge Customization: Separate styling options for double purge signals.
iii) Line Customization: Adjustable daily 0.5 line appearance (style, color, width).
iv) Display Controls: Toggle visibility for FVGs, labels, and confirmation history.
2) Technical Specifications
A) Timeframe Requirements :
i) Primary Timeframe: 4H only (indicator will show error on other timeframes).
ii) Multi-Timeframe Data: Analyzes H1 and M15 for confirmations.
iii) Session Times: Configurable start/end times.
B) Signal Validation Criteria :
Sweeps are validated when they occur at one or more of the following conditions:
i) FVG Zones: Price interaction with identified fair value gaps.
ii) Daily Midpoint: Proximity to the 50% level of previous day's range.
iii) Session Levels: Sweeps of Asian (19:00-01:00 NY) or London (02:00-05:00 NY) extremes.
C) Layer 2 Confirmation System :
i) H1 Confirmations (H1S): Sweep patterns on 1-hour charts within the 4H candle formation.
ii) M15 Sweep (M15S): 15-minute sweep confirmations.
iii) M15 FVG (M15F): 15-minute fair value gap formations.
3) Usage Guidelines :
A) Setup Instructions :
i) Apply to 4-hour charts only.
ii) Configure session times based on your analysis preferences.
iii) Customize label appearance and colors to match your chart theme.
iv) Enable/disable features based on your trading style.
B) Signal Interpretation :
i) Green Labels: Bullish sweeps with validation criteria met.
ii) Red Labels: Bearish sweeps with validation criteria met.
iii) Purple Labels: Double purge scenarios (both directions swept).
iv) Checkmark (✓): Indicates Layer 2 multi-timeframe confirmation present.
v) For double purge interpretations :
- Low & High means recent purge (just previous candle)
- Low & High means medium term purge (8H prior)
- Low & High means longer term purge (12H + prior)
4) Compatibility :
Max Objects: Supports up to 500 boxes and labels simultaneously.
5) Support & Updates :
This indicator represents educational concepts in market structure analysis. Users should thoroughly test and understand all signals before considering any practical application.
Disclaimer :
Always practice proper risk management. This is for educational purposes only and is not a financial advice.

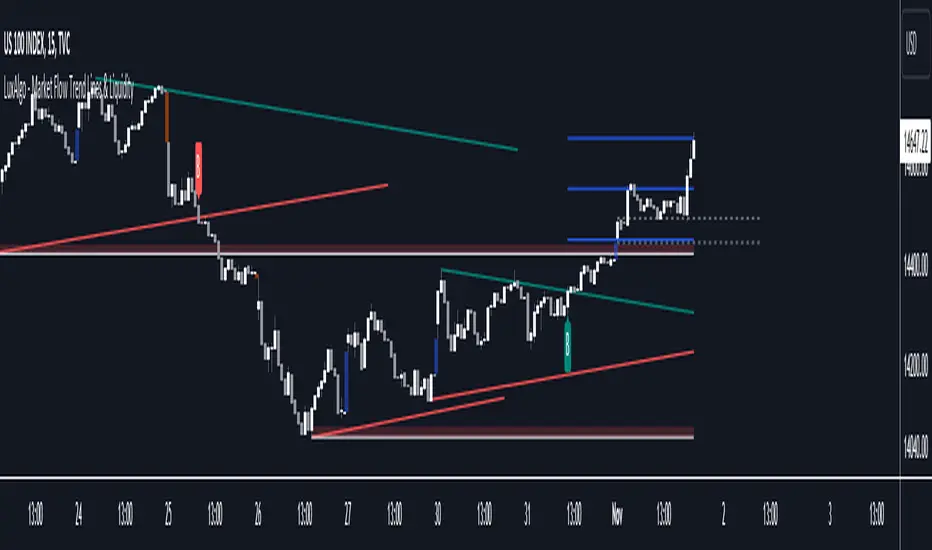
Market Flow Trend Lines & Liquidity [LuxAlgo]The Market Flow Trend Lines & Liquidity indicator is a script that aims to automate key insights such as trend lines, liquidity zones, opening ranges, & gaps on the chart. The aim of this script is to provide a functional breakout trader toolkit with various familiar tools as well as unique capabilities to further improve the user experience.
🔶 USAGE
There are various methods for using the features within this script, even with the included take profit levels users can pre-define.
The dotted lines represent an Opening Range with levels we can use as support & resistance. This opening range can be traded within the levels; however, it can also be used to tell the sentiment of price to see how it reacts to it.
In the image below, we can see after price was holding above the Opening Range whilst printing bullish trendline breakout signals, it made its way to the TP level we enabled from within the indicator to calculate a potential level for taking profits in a breakout trade.
The Market Flow Trend Lines & Liquidity indicator's key feature reside within its multi-timeframe capabilities for the main trendlines, as well as its key zones for potential entries.
In the image above we can see multiple areas where multi-timeframe (1H) trendlines on the 30m chart acted as support & resistance, alongside the Liquidity Zones & Opening Range as optimal points of interest for a breakout trader.
🔶 SETTINGS
🔹 Trendlines
Trendlines Lookback: Determines the frequency of detected tops/bottoms used to construct trendlines.
Slope: Trendlines slope, with higher values returning steeper trendlines.
Timeframe: Trendline timeframe.
🔹 Liquidity Zones
Liquidity Lookback: Determines the frequency of detected tops/bottoms used to construct liquidity zones.
🔹 Take Profits
Take profit settings. Up to 3 ATR based take profits can be enabled, with a numerical setting controlling the ATR multiplier.
🔹 Opening Range
From Time: 15min opening range starting time.
Extend: Extension length of Opening Range lines (in bars).
🔹 Gap Imbalance
Gap Up: Display upward gaps.
Gap Down: Display downward gaps.
🔹 EMA
Show EMA: Displays an EMA on the chart.
EMA Length: Length of the displayed EMA.
🔶 RELATED SCRIPTS
Liquidity Swings
Trendlines with Breaks
Time Range StatisticsA good amount of users requested a text box showing various price statistics, the following script returns various of these stats in a user-selected range, and include classical ones such as a central tendency measurement (mean), dispersion (normalized range) and percent change, but also include less common statistics such as average traded volume and number of gaps. The script also calculates the correlation between the closing price and another user-selected instrument.
The script is currently the longest one I ever made and took some efforts, as I wasn't satisfied with the statistics to be originally included. Big thx to Gael for the enormous feedback and the idea of the normalized range, to user @Cookiecrush for the feedback ( without ya I would have posted something bad you know umu ? ), and Lulidolce for the support, friendship is magic!
Selected Range
The setting Start determine the bar at which the range starts, while End determine at which bar the range end. To help you select these values, the current bar number (bar index) is displayed at the right of the indicator title in blue.
The setting evaluate to last bar will use a range starting at Start and ending at the last bar, as such you can use a full range by using Start = 0 and select evaluate to last bar
The range is highlighted by an area on the chart. By default Start = 9000 and End = 10000, you might not have this amount of data in your chart, as such use the displayed bar index to select Start and End, then set the settings as default.
Displayed Statistics
The statistics panel is displayed on the right side of the last bar, the panel has 3 sections, a title section who shows the symbol ticker, timeframe, and overall trends represented by a chart emoji, the overall trends are determined by comparing the number of higher highs with the number of lower low.
Below are displayed the date ranges with time format: year/month/day/hour:minute.
The second section shows the general statistics. The first one is the mean, also represented by the orange line in the chart, the blue line displayed represent the highest price value in the range, while the red one represents the lowest price value.
The second stat is the normalized range, and determine how spread is the price in the user-selected range, why not the standard deviation? Because the standard deviation might return results varying widely depending on the scale of the closing price, you could get measures such as 0.0156 or 16 or even 56 depending on the instrument, as such using a normalized range can be more appropriate as it lays in a range of (0,1). Lower values indicate a low degree of price variation. Note that I still want to find another measure in the future.
The percentage change (or relative change) indicates at which percentage the price has increased or decreased, and is calculated by subtracting the closing at bar Start with the price at bar End , divided by the price at bar End , the result is then multiplied by 100.
The average traded volume calculate the mean of the volume in the selected range, I used the same format used by the original volume indicator for clarity.
Finally, the last stats of the section is the number of gaps, this stat is by default hidden. An up gap is detected when the open price is superior to the previous high, while a down gap is detected when the open price is inferior to the previous low, this allow to only retain significant gaps.
The last section of the indicator panel shows the correlation between the closing price and another instrument, by default GOOG, this correlation is also calculated within the user-selected range. Positive values indicate a positive relationship, that is the two instruments tend to move in the same direction. Negative values indicate a negative relationship, both instruments tend to move in a direction opposite to each other. Values closer to 1 or -1 indicate a stronger relationship, while values closer to 0 indicate no relationship.
In Summary
The script shows various stats, each calculated within a user-selected range, in general one would be more interested in how these stats might evolve with time, but checking them in a custom range can be quite interesting.
Thx for reading. umu

Liquidity Void and Repair EngineLiquidity Void & Repair Engine
OVERVIEW
The Liquidity Void & Repair Engine is a high-fidelity institutional order flow tool designed to identify and track "Market Imbalances" or "Fair Value Gaps" (FVG). Unlike standard gap indicators that clutter the chart with every minor price jump, this engine uses Volatility-Adjusted Range Mapping to isolate high-conviction voids where price moved so rapidly that liquidity was left "unfilled."
The standout feature of this tool is its Active Repair Logic. The engine doesn't just draw static boxes; it monitors price action in real-time to determine when an imbalance has been "healed" by subsequent trading volume, providing a dynamic look at where the market has "unfinished business."
TECHNICAL LOGIC & ORIGINALITY
This script is published Open Source to contribute to the Pine Script community’s understanding of dynamic object management and order flow visualization.
ATR-Relative Filtering: To ensure only significant voids are plotted, the script uses a user-defined ATR (Average True Range) multiplier. This filters out market noise and focuses on institutional "impulse" moves.
Dynamic Box Management: Utilizing the Pine Script box array system, the script manages memory efficiently by updating existing objects rather than creating redundant ones.
The "Repair" Algorithm: The script tracks the high and low of every active void. When price action fully traverses the coordinates of a void, the script "seals" the box, visually marking the moment of liquidity equilibrium.
HOW TO USE
1. Identifying the "Magnet" (The Void)
When price moves aggressively, it leaves a "hole" in the auction.
Bullish Voids (Green): These represent areas where price surged so fast that buyers may still have unfilled orders sitting below. These act as Magnets for pullbacks.
Bearish Voids (Red): These represent areas where price plummeted, leaving a vacuum of selling pressure. These act as Magnets for relief rallies.
2. Trading the "Repair" Process
The Engine tracks how the market "repairs" these holes:
Partial Fill: If price enters a box but doesn't cross it, the "Magnet" is still active.
Full Repair: When a box is "sealed" (stops extending right), it indicates the imbalance is gone. If price "Seals" a green box and then bounces, it confirms the zone as Valid Institutional Support.
3. Confluence with the Trend
Continuation: In a strong uptrend, look for price to drop into a Green Bullish Void and find support. This is often the "Golden Entry" for trend followers.
Reversal Confirmation: If price ignores a Red Bearish Void and blasts right through it (sealing it instantly), it signals a massive shift in market regime and extreme bullish conviction.
USER SETTINGS
Lookback Period: How far back the engine searches for un-repaired gaps.
Min Gap Size (ATR %): Increase this to see only the "Major" institutional gaps; decrease it for a more granular intraday look.
Visual Styles: Fully customizable colors and transparency to match any chart theme (Dark/Light).
NOTES & DISCLAIMER
This script is a visualization of historical price imbalances and is intended for educational purposes only. It does not provide trade signals, entry/exit points, or financial advice. All trading involves risk.

S_Sigma HTF Candles (UTC Draw / NY Labels)🕯️ S_Sigma HTF Candles (UTC Draw / NY Labels)
Multi-Timeframe Overlay with Session Labels & Imbalances
S_Sigma HTF Candles is a powerful, non-repainting overlay indicator that allows you to visualize up to 6 different Higher Timeframes (HTF) directly on your current chart.
Designed specifically for traders who need context without switching tabs, this tool draws accurate HTF candles using UTC time (standard for Crypto) while labeling them with New York Timezone data (standard for Stocks/Forex). It also detects Fair Value Gaps (FVG) and Volume Imbalances automatically.
🌟 Key Features
📊 6 Independent HTF Slots
Configure up to 6 different timeframes simultaneously (e.g., 15m, 1H, 4H, 1D, 1W). Each slot is customizable and can be toggled on/off independently.
🌍 UTC Drawing + NY Labels (The "Sigma" Edge)
Drawing: Candles are calculated strictly using UTC time to ensure wicks and bodies match exchange data (perfect for BTC/ETH).
Labels: Day of the Week (Mon/Tue/Wed) and Time labels are converted to America/New_York time. Never get confused by candle closes again.
#HTF Countdown Timer**
See exactly how much time is left until the Higher Timeframe candle closes. Essential for timing entries at the "Candle Close."
📈 Smart Imbalance Detection
FVG (Fair Value Gaps): Automatically highlights 3-candle reversal gaps.
VI (Volume Imbalance): Highlights wicks that pierce previous bodies.
🏗️ Custom Session Starts
Don't like the standard Daily candle? Force the Daily candle to open at 08:30 NY or 09:30 NY (Market Open) instead of Midnight UTC.
⚙️ Customization Options
Visuals: Full control over Bull/Bear colors, borders, wicks, and opacity.
Layout: Adjust padding, width, and spacing between timeframes to prevent overlap.
Trace Lines: Optional lines tracing the Open, High, Low, and Close of the forming HTF candle.
Labels: Toggle HTF names, Timers, and Day-of-Week labels on/off.
💡 How to Use
Add to Chart: The indicator draws candles to the right of the current price (offset) to keep your chart clean.
Check Alignment: Ensure the "Daily Name" matches your expected market session (NY Time).
Spot Entries: Look for price entering an FVG (Gray box) or hitting a HTF Support/Resistance level (Wick of the HTF candle).
Time Entries: Wait for the Timer to hit 00:00 for a confirmed candle close.
Perfect for: Smart Money Concepts (SMC), ICT, Wyckoff, and Multi-Timeframe Analysis.

UK100 London Judas & IFVG SetupUK100 London Judas & IFVG Setup
Overview This indicator is a specialized trading tool designed to automate the ICT Judas Swing strategy specifically for the UK100 (FTSE 100) index during the London Market Open. It combines institutional time-based logic with price action confirmation using Inversion Fair Value Gaps (IFVG) to identify high-probability reversal setups.
How It Works The strategy is based on the concept that the initial move after the London Open is often a "fake-out" (manipulation) designed to trap retail traders and engineer liquidity before the true trend of the day begins.
Session & Opening Price:
The script marks the London Open price (default 09:00 Warsaw / 08:00 London time) with a dashed line.
This serves as the "line in the sand." Prices moving away from this line initially are monitored for manipulation.
Judas Swing (Liquidity Sweep):
If price moves BELOW the open, it is hunting Sell-Side Liquidity (trapping sellers).
If price moves ABOVE the open, it is hunting Buy-Side Liquidity (trapping buyers).
The Entry Trigger: Inversion FVG (IFVG):
The indicator scans for Fair Value Gaps (FVG) created during the manipulation phase.
BUY Signal: The price manipulates lower, creates a Bearish FVG (Red Box), but then aggressively reverses and closes ABOVE that gap. The gap is now "Inverted" (turns Green), acting as support.
SELL Signal: The price manipulates higher, creates a Bullish FVG (Green Box), but then aggressively reverses and closes BELOW that gap. The gap is now "Inverted" (turns Orange), acting as resistance.
Key Features
Automated Pattern Recognition: No need to manually draw gaps. The script detects valid FVG inversions that align with the Judas Swing logic.
Built-in Risk Calculator: The signal labels display the exact Lot Size you should use based on your account balance and risk percentage (default 0.5%). It calculates this dynamically based on the Stop Loss distance.
Institutional Targets: The indicator fetches H1 Fractals (Liquidity) from the 1-hour timeframe and plots them on your 1-minute chart as blue lines. These are your primary Take Profit (TP) levels.
Stop Loss Visualization: Automatically suggests a Stop Loss placement behind the swing high/low of the reversal structure.
How to Use
Timeframe: Set your chart to 1 Minute (1m).
Asset: UK100 (FTSE 100).
Wait: Allow the London session to open. Watch for price to move away from the opening line.
Execute: When a BUY or SELL label appears:
Enter the trade using the Lot Size shown on the label.
Set your Stop Loss at the price shown on the label.
Target the blue H1 Liquidity lines for profit taking.
Settings
Timezone: Set this to your chart/exchange timezone (Default: Europe/Warsaw).
Account Balance: Input your current trading capital (e.g., 100,000) for accurate risk calculations.
Risk Per Trade %: The percentage of your account you are willing to lose if the Stop Loss is hit (Standard: 0.5% - 1.0%).
Contract Size: The value of 1 point movement (Check your broker's specifications. Usually 1 for CFDs).
Alerts You can set a single alert in TradingView to capture all signals. Select the indicator and choose "Any alert() function call". You will receive a notification with the direction (Buy/Sell), Entry Price, and Lot Size.

KVS-Ultimate FVG & iFVG System [MTF + Distance Filter]Description: This indicator identifies Fair Value Gaps (FVG) and Inversion FVGs (iFVG) across multiple timeframes (MTF) with an advanced visualization system. Unlike standard FVG indicators, this script solves the "chart clutter" problem with a unique Distance Filter and offers a customizable Split Label System.
Key Features:
1. Unique Distance Filter (Clean Screen Mode):
When enabled, the script only shows the closest FVGs to the current price within a user-defined limit.
Keeps your chart clean while focusing on relevant price action levels.
2. Split Label System (Tabular Design):
Completely customizable label positioning, sizing, and coloring.
Separate controls for Normal FVGs and iFVGs.
Smart Label Logic: If you hide the FVG box, its label automatically hides. If an FVG breaks and becomes an iFVG (or fades), the label logic switches automatically to the iFVG settings.
3. Strict Mode Filtering:
Enabled: Checks if the candle closing price effectively breaks the previous structure (High/Low of the 1st candle), ensuring high-quality gaps.
Disabled: Detects all gaps between wicks (Standard calculation).
4. Multi-Timeframe (MTF) Support:
Monitor FVGs from up to 5 different timeframes simultaneously on a single chart.
5. Dynamic Interaction:
Choose how the script reacts when an FVG is broken: Turn it into an iFVG (Inversion) or simply fade the color (Ghost/Fade mode).
How to Use:
Use the "Distance Filter" checkbox in settings to clean up old/far blocks.
Adjust "TF1" to "TF5" to set up your multi-timeframe analysis.
Customize the Label Panel to align text perfectly with your chart style.
Disclaimer: This tool is for educational purposes and support for technical analysis.

ICS🏛️ Institutional Confluence Suite (ICS) Indicator
The Institutional Confluence Suite is a powerful and highly customizable TradingView indicator built to help traders identify key institutional trading concepts across multiple timeframes. It visualizes essential market components like Market Structures (MS), Order Blocks (OB)/Breaker Blocks (BB), Liquidity Zones, and Volume Profile, providing a confluence of institutional price action data.
📈 Key Features & Components
1. Market Structures (MS)
Purpose: Automatically identifies and labels shifts in market trends (Market Structure Shift, MSS) and continuations (Break of Structure, BOS).
Timeframe Detection: You can select detection across Short Term, Intermediate Term, or Long Term swings to match your trading horizon.
Visualization: Plots colored lines (Bullish: Teal, Bearish: Red) to mark the structures and optional text labels (BOS/MSS) for clear identification.
2. Order & Breaker Blocks (OB/BB)
Purpose: Detects and projects potential Supply and Demand zones based on recent price action that led to a swing high or low.
Block Types: Distinguishes between standard Order Blocks and Breaker Blocks (OBs that fail to hold and are traded through, often serving as support/resistance in the opposite direction).
Customization:
Detection Term: Adjusts sensitivity (Short, Intermediate, Long Term).
Display Limit: Sets the maximum number of recent Bullish and Bearish blocks to display.
Price Reference: Option to use the Candle Body (Open/Close) or Candle Wicks (High/Low) to define the block boundaries.
Visualization: Displays blocks as colored boxes (Bullish: Green, Bearish: Red) extending into the future, with a dotted line marking the 50% equilibrium level. Breaker Blocks are indicated by a change in color/line style upon being broken.
3. Buyside & Sellside Liquidity (BSL/SSL)
Purpose: Highlights areas where retail stops/limit orders are likely clustered, often represented by a series of relatively equal highs (Buyside Liquidity) or lows (Sellside Liquidity).
Detection Term: Adjustable sensitivity (Short, Intermediate, Long Term).
Margin: Uses a margin (derived from ATR) to group similar swing points into a single liquidity zone.
Visualization: Plots a line and text label marking the swing point, and a box indicating the clustered liquidity zone.
4. Liquidity Voids (LV) / Fair Value Gaps (FVG)
Purpose: Identifies areas where price moved sharply and inefficiency was created, often referred to as Fair Value Gaps or Imbalances. These are price ranges where minimal trading volume occurred.
Threshold: Uses a multiplier applied to the 200-period ATR to filter for significant gaps.
Mode: Can be set to Present (only show voids near the current price) or Historical (show all detected voids).
Visualization: Fills the price gap with colored boxes (Bullish/Bearish zones), often segmented to represent the price delivery across the gap.
5. Enhanced Liquidity Detection
Purpose: A complementary feature that uses volume and price action to highlight areas of high liquidity turnover, potentially indicating stronger Support and Resistance zones.
Calculation: Utilizes a volume-weighted approach to color-grade liquidity zones based on their significance.
Visualization: Plots shaded boxes (gradient-colored) around swing highs/lows, with text displaying the normalized volume strength.
6. Swing Highs/Lows
Purpose: Directly marks the price points identified as Swing Highs and Swing Lows based on the lookback periods.
Timeframe Detection: Can be enabled for Short Term, Intermediate Term, or Long Term swings.
Visualization: Plots a small colored dot/label (e.g., "⦁") at the swing point.
This indicator is an invaluable tool for traders employing ICT (Inner Circle Trader), Smart Money Concepts (SMC), or general price action strategies, as it automatically aggregates and displays these critical structural and liquidity elements.

Experimental Supertrend [CHE]Experimental Supertrend — Combines EMA crossovers for trend regime detection with an adaptive ATR-based hull that selects the narrowest band to contain recent highs and lows, minimizing false breaks in varying volatility.
Summary
This indicator overlays a dynamic supertrend boundary around a midline derived from dual EMAs, using EMA crossovers to switch between bullish and bearish regimes. The hull adapts by evaluating multiple ATR periods and selecting the tightest one that fully encloses price action over a specified window, which helps in creating more stable trend lines that hug price without excessive gaps or breaches. Fills between the midline and hull provide visual cues for trend strength, darkening temporarily after regime changes to highlight transitions. Alerts trigger on crossovers, and markers label entry points, making it suitable for trend-following setups where standard supertrends might whipsaw. Overall, it offers robustness through auto-adjustment, reducing sensitivity to noise while maintaining responsiveness to genuine shifts.
Motivation: Why this design?
Standard supertrend indicators often flip prematurely in choppy markets due to fixed multipliers that do not account for localized volatility patterns, leading to frequent false signals and eroded confidence in trends. This design addresses that by incorporating an EMA-based regime filter for directional bias and an auto-adaptive hull that dynamically tunes the band width based on recent price containment needs. By prioritizing the narrowest effective enclosure, it avoids over-wide bands in calm periods that cause lag or under-wide ones in volatility spikes that invite breaks, providing a more consistent trailing reference without manual tweaking.
What’s different vs. standard approaches?
- Reference baseline: Diverges from the classic ATR-multiplier supertrend, which uses a single fixed period and constant factor applied to close or high/low deviations.
- Architecture differences:
- Auto-selection from candidate ATR lengths to find the optimal period for current conditions.
- Dynamic multiplier clamped between floor and cap values, adjusted by padding to ensure reliable containment.
- Regime-gated rendering, where hull position flips based on EMA relative positioning.
- Post-transition visual fading to emphasize change points without altering core logic.
- Practical effect: Charts show tighter, more reactive bands that rarely breach during trends, reducing visual clutter from flips; the adaptive nature means less intervention across assets, as the hull self-adjusts to volatility clusters rather than applying a one-size-fits-all scale.
How it works (technical)
The indicator first computes two EMAs from close prices using lengths derived from a preset pair or manual inputs, establishing a midline as their average. This midline serves as the central reference for the hull. True range values are then smoothed into multiple ATR candidates using exponential weighting over the specified lengths. For each candidate, deviations of recent highs and lows from the midline are ratioed against the ATR to determine a required multiplier that would enclose all extremes in the containment window—the highest ratio plus padding sets the base, clamped to user-defined bounds. Among valid candidates (those with sufficient history), the one yielding the narrowest overall band width is selected. The hull boundaries are then offset from the midline by this multiplier times the chosen ATR, and further smoothed with a fixed EMA to reduce jitter. Regime direction from EMA comparison gates which boundary acts as support or resistance, with initialization seeding arrays on the first bar to handle state persistence. No higher timeframe data is used, so all logic runs on the chart's native bars without lookahead.
Parameter Guide
EMA Pair — Selects preset lengths for fast and slow EMAs, influencing regime sensitivity and midline stability. Default: "21/55". Trade-offs/Tips: Faster pairs like "9/21" increase cross frequency for scalping but raise false signals; slower like "50/200" smooths for swings, potentially missing early turns. Use Manual for fine control.
Manual Fast — Sets fast EMA length when Manual mode is active; shorter values make regime switches quicker. Default: 21. Trade-offs/Tips: Lower than 10 risks over-reactivity; pair with slow at least double for clear separation.
Manual Slow — Sets slow EMA length when Manual mode is active; longer values anchor the midline more firmly. Default: 55. Trade-offs/Tips: Above 100 adds lag in trends; balance with fast to avoid perpetual neutrality.
ATR Lengths (comma-separated) — Defines candidate periods for ATR smoothing; more options allow finer auto-selection. Default: "7,10,14,21,28,35". Trade-offs/Tips: Fewer candidates speed computation but may miss optimal fits; keep under 10 for efficiency.
Containment Window — Number of recent bars the hull must fully enclose highs/lows of; larger windows favor stability. Default: 50. Trade-offs/Tips: Shorter (under 20) adapts faster to breaks but increases breach risk; longer smooths but delays response.
Min Multiplier Floor — Lowest allowed multiplier for hull width; prevents overly tight bands in low volatility. Default: 0.5. Trade-offs/Tips: Raise to 0.75 for conservative enclosures; too low allows pinches that flip easily.
Max Multiplier Cap — Highest allowed multiplier; caps expansion in spikes to avoid wide, lagging bands. Default: 1.0. Trade-offs/Tips: Lower to 0.75 tightens overall; higher permits more room but risks detachment from price.
Padding (+) — Adds buffer to the auto-multiplier for safer containment without exact touches. Default: 0.05. Trade-offs/Tips: Increase to 0.10 in gappy markets; minimal values hug closer but may still breach on outliers.
Fill Between (Mid ↔ Supertrend) — Toggles shaded area between midline and active hull for trend visualization. Default: true. Trade-offs/Tips: Disable for cleaner charts; pairs well with transparency tweaks.
Base Fill Transparency (0..100) — Sets default opacity of fills; higher values make them subtler. Default: 80. Trade-offs/Tips: Under 50 overwhelms price action; adjust with darken boost for emphasis.
Darken on Trend Change — Enables temporary opacity increase after regime shifts to spotlight transitions. Default: true. Trade-offs/Tips: Off for steady visuals; on aids spotting reversals in real-time.
Darken Fade Bars — Duration in bars for the darken effect to ramp back to base; longer prolongs highlight. Default: 8. Trade-offs/Tips: Shorter (4-6) for fast-paced charts; longer holds attention on changes.
Darken Boost at Change (Δ transp) — Intensity of opacity reduction at crossover; higher values make shifts more prominent. Default: 50. Trade-offs/Tips: Cap at 70 to avoid blackout; tune down if fades obscure details.
Show Supertrend Line — Displays the active hull boundary as a line. Default: true. Trade-offs/Tips: Hide for fill-only views; linewidth fixed at 3 for visibility.
Show EMA Cross Markers — Places circles and labels at crossover points for entry cues. Default: true. Trade-offs/Tips: Disable in clutter; labels show "Buy"/"Sell" at absolute positions.
Alert: EMA Cross Up (Long) — Triggers notification on bullish crossover. Default: true. Trade-offs/Tips: Pair with filters; once-per-bar frequency.
Alert: EMA Cross Down (Short) — Triggers notification on bearish crossover. Default: true. Trade-offs/Tips: Use for exits; ensure broker integration.
Show Debug — Reveals internal diagnostics like selected ATR details (if implemented). Default: false. Trade-offs/Tips: Enable for troubleshooting selections; minimal overhead.
Reading & Interpretation
Bullish regime shows a green line below price as support, with upward fill from midline; bearish uses red line above as resistance, downward fill. Crossovers flip the active boundary, marked by tiny green/red circles and "Buy"/"Sell" labels at the hull level. Fills start at base transparency but darken sharply at changes, fading over the specified bars to signal fresh momentum. If the hull rarely breaches during trends, containment is effective; frequent touches without flips indicate tight adaptation. Debug mode (when enabled) overlays text or plots for selected length and multiplier, helping verify auto-choices.
Practical Workflows & Combinations
- Trend following: Enter long on green "Buy" label above prior low structure; confirm with higher high. Trail stops along the green hull line, tightening as fills stabilize post-fade.
- Exits/Stops: Conservative exit on opposite crossover or hull breach; aggressive hold until fade completes if volume supports. Use darken boost as a volatility cue—high delta suggests waiting for confirmation.
- Multi-asset/Multi-TF: Defaults suit forex/stocks on 15m-4h; for crypto, widen containment to 75 for gaps. Layer on volume oscillator for cross filters; avoid on low-liquidity assets where ATR candidates skew.
Behavior, Constraints & Performance
Closed-bar logic ensures signals confirm at bar end, with live bars updating hull adaptively but no repaints since no future data or security calls are used. Arrays persist ATR states across bars, initialized once with candidates parsed from string. Small fixed loops (over 6 lengths max, inner up to 50) run per bar, capped by max_bars_back=500 for history needs. Resources stay low with 500 labels/lines limits, but dense charts may hit on markers. Known limits include initial lag until containment history builds (50+ bars), potential wide bands on gaps, and suboptimal selections if candidates omit ideal lengths.
Sensible Defaults & Quick Tuning
Start with "21/55" pair, 50-window, 0.5-1.0 multipliers, and 80% transparency for balanced responsiveness on daily charts. For too many flips, raise min floor to 0.75 or add lengths like "42"; for sluggishness, shorten window to 30 or pick faster pair. In high-vol environments, boost padding to 0.10; for smoother visuals, extend fade bars to 12.
What this indicator is—and isn’t
This is a visualization and signal layer for trend regime and adaptive boundaries, aiding entry/exit timing in directional markets. It is not a standalone system—pair with price structure, risk sizing, and broader context. Not predictive of turns, just reactive to containment and crosses.
Disclaimer
The content provided, including all code and materials, is strictly for educational and informational purposes only. It is not intended as, and should not be interpreted as, financial advice, a recommendation to buy or sell any financial instrument, or an offer of any financial product or service. All strategies, tools, and examples discussed are provided for illustrative purposes to demonstrate coding techniques and the functionality of Pine Script within a trading context.
Any results from strategies or tools provided are hypothetical, and past performance is not indicative of future results. Trading and investing involve high risk, including the potential loss of principal, and may not be suitable for all individuals. Before making any trading decisions, please consult with a qualified financial professional to understand the risks involved.
By using this script, you acknowledge and agree that any trading decisions are made solely at your discretion and risk.
Do not use this indicator on Heikin-Ashi, Renko, Kagi, Point-and-Figure, or Range charts, as these chart types can produce unrealistic results for signal markers and alerts.
Happy trading
Chervolino

Prophet Model [TakingProphets]The Prophet Model — context pipeline (HTF PDA → Sweep → CISD → EPE) with dynamic risk
Purpose
Informational overlay for organizing institutional context in real time. It does not issue buy/sell signals and is not financial advice. Use it to structure analysis and checklist-driven execution—not to automate decisions.
What it does (modules at a glance)
Projects HTF PD Arrays (FVGs) onto your current chart and maintains only the nearest active array.
Validates directional bias using Candle Range Theory (CRT) on the same HTF.
Tracks Liquidity Sweeps (BSL/SSL) on HTF-aware pivots.
Confirms Change in State of Delivery (CISD) via displacement after a sweep.
Optionally refines entries with EPE when a local (internal) imbalance forms right after CISD.
Derives dynamic TP/BE/SL from measured displacement and recent extremes (not fixed distances).
Keeps a rules checklist (PDA tap → CRT → Sweep → CISD) and a relationships table (common HTF↔LTF pairings) to enforce process.
How it works (integration, not a mashup)
The modules are sequenced on one HTF time base so each step gates the next:
HTF PD Arrays (context zone). The model identifies valid HTF FVGs, filters tiny/weekend gaps, removes arrays that are invalidated by clean trades-through, and persists only the nearest PDA. This focuses attention on the institutional zone most likely to matter now.
CRT (directional gating). CRT on the same HTF establishes a provisional bias. No entries are implied; CRT simply permits or forbids the following steps. If CRT disagrees with the PDA context, the checklist remains incomplete.
Liquidity Sweep (event). The model tracks HTF-aware BSL/SSL pivots. A sweep only “counts” if it occurs in relation to the active PDA (tap/engagement). This prevents generic swing-high/low tags from triggering downstream logic.
CISD (confirmation). After a qualified sweep, the tool looks for displacement through the sequence open (the open of the impulsive leg beginning at or immediately after the sweep). Crossing that threshold confirms CISD, which marks a structural delivery shift consistent with the CRT bias.
EPE (refinement, optional). Immediately following CISD, the model scans for a fresh internal imbalance. If found quickly, it promotes that price area as the Easiest Point of Entry (EPE) and relabels the reference. If not, the CISD level remains primary.
Dynamic risk levels. TP/BE/SL are derived from the measured displacement around the CISD leg (e.g., BE ≈ 1× leg, TP ≈ 2.25× stretch; SL aligned to nearby structural extremes rather than a fixed pip offset). Levels update with structure and can display prices.
By chaining PDA → CRT → Sweep → CISD → (EPE) → Risk on a single HTF backbone, the tool creates a coherent workflow where later signals simply do not appear without earlier context. That’s why this is not a bundle of independent features: each module’s output is another module’s input.
Concepts & operational rules (high level)
HTF PD Arrays (FVGs)
Uses a standard three-candle gap definition on the chosen HTF, with filters for weekend/tiny gaps.
Inverse mitigation: if price trades cleanly through an array, the box is removed and internal state resets.
Nearest-PDA persistence: when multiple arrays exist, only the closest remains visible to reduce clutter.
Optional right-extension draws lingering influence X bars forward.
Candle Range Theory (CRT)
Bullish CRT: candle 2 wicks below candle 1’s low but closes back inside candle 1’s range, without taking its high.
Bearish CRT: candle 2 wicks above candle 1’s high but closes back inside candle 1’s range, without taking its low.
Role: bias validation paired to CISD when alignments match the active PDA.
Liquidity Sweeps (BSL/SSL)
Tracks candidate HTF pivots as buy-/sell-side liquidity.
A sweep registers when price takes a tracked pivot in the vicinity of the active PDA.
CISD (Change in State of Delivery)
Finds the sequence open for the impulsive leg that begins at/after the sweep.
Bearish path (after BSL sweep): CISD when close < sequence-open.
Bullish path (after SSL sweep): CISD when close > sequence-open.
On confirmation, the model plots a CISD line, checks the box in the Strategy Checklist, and triggers risk calc.
EPE (Easiest Point of Entry)
Within a short window after CISD, scans for a local imbalance; if present, promotes that level as EPE.
If no imbalance forms, CISD remains the operative reference.
Dynamic TP / BE / SL
Built from the measured leg around CISD (not fixed pip steps).
Approximate geometry: BE ≈ 1× leg, TP ≈ 2.25× leg; SL respects nearby structural extremes.
Labels and price markers are optional.
Architecture notes
Maps the current chart to a higher timeframe (e.g., 15s→M5, M1→M15, M5→H1, M15→H4, H1→D, H4→W, D→M).
Retrieves HTF OHLC/time with no lookahead so structures update intrabar until the HTF bar closes.
Periodic cleanup clears obsolete lines/labels/boxes to keep charts responsive.
Inputs (summary)
FVGs/PD Arrays: show/hide, colors, borders, label size, right-extension, nearest-only toggle.
CRT: enable/disable, label style.
Sweeps/CISD/EPE: enable/disable, line/label styles, EPE window.
Risk Levels (TP/BE/SL): enable each, price labels on/off, colors.
Tables/Checklist: strategy checklist on/off; relationships table (common HTF↔LTF pairings); text sizes and header colors.
Alerts (optional)
You may add alertconditions aligned with these events in your own workspace:
HTF PDA tap (bullish/bearish box)
CRT detected (bullish/bearish)
CISD confirmed (bullish/bearish)
EPE set/updated
Example messages:
“Prophet: CISD confirmed on {{ticker}} / {{interval}}”
“Prophet: EPE refined at {{close}} ({{time}})”
Notes & limitations
HTF values are provisional until the HTF bar closes; labels/levels can update while forming.
CISD/EPE are live conditions; they can form and later invalidate within the same HTF bar.
Liquidity relationships vary by market/regime; thin sessions and large gaps can affect clarity.
Educational tool only. No performance claims; no trade signals.
Originality & scope (for protected/invite-only publications)
A single HTF-synchronized engine sequences PDA → CRT → Sweep → CISD → (EPE) and withholds later steps unless prerequisites are met.
Nearest-PDA persistence and inverse-mitigation enforce focus on the most relevant institutional zone.
Displacement-based risk math ties TP/BE/SL to structure instead of static offsets.
Checklist + relationships table promote consistent, rules-first behavior and reduce discretionary drift.
Attribution: Concepts inspired by ICT (PD arrays/FVGs, CRT, sweeps, displacement, refined entries). Design, integration logic, and risk framework by TakingProphets.

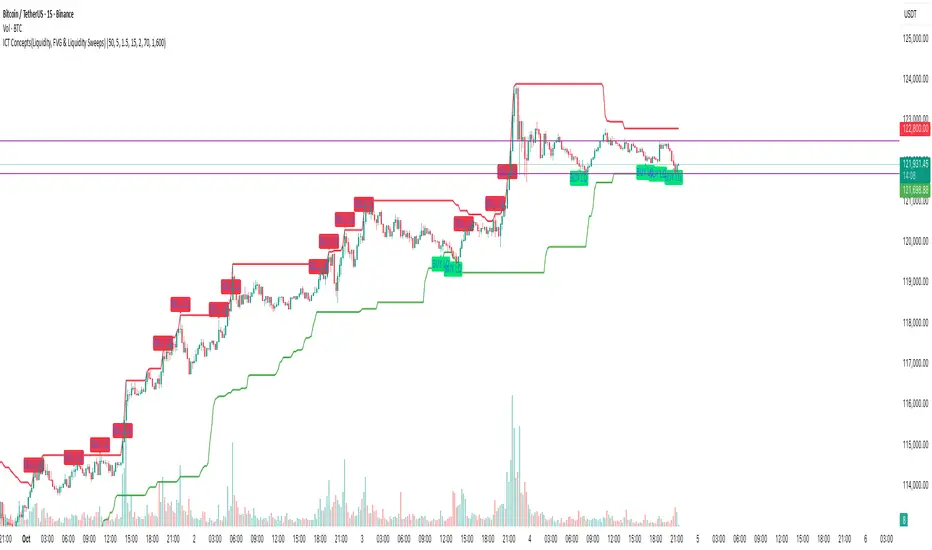
ICT Concepts(Liquidity, FVG & Liquidity Sweeps)📄 Description:
A Smart Money Concept (SMC)-based utility that blends ICT-style Liquidity Sweeps, Fair Value Gap (FVG) mapping, and Swing Structure proxies – designed for traders seeking clean precision in price imbalance analysis.
⸻
🔍 1. What This Script Does
T his indicator brings together three core Institutional Concepts:
• Liquidity Sweep Detection : Identifies buy/sell-side liquidity grabs (fakeouts) confirmed by volume spikes – a common precursor to institutional order flow shifts.
• Fair Value Gaps (FVGs) : Highlights inefficiencies between price legs using strict ICT-style 3-candle or gap-based rules. These are areas institutions often revisit.
• Swing Structure Proxy (OB Mapping) : Tracks dynamic swing highs/lows to act as proxy zones for potential order blocks and structural boundaries.
It also includes a cooldown-based signal filtering engine to prevent overfitting and noise, helping traders avoid false positives in choppy markets.
⚙️ 2. How It Works (Core Logic)
✅ A. Liquidity Sweep Engine
• Looks back N bars to find Equal Highs or Equal Lows.
• Triggers a signal only if price sweeps the level and closes on the other side with a volume spike.
• Customizable volume threshold (e.g., 1.5x average volume).
• Includes a signal cooldown period to reduce clutter and boost quality.
Bullish Sweep = Price dips below equal lows but closes higher
Bearish Sweep = Price spikes above equal highs but closes lower
Visuals: Signal arrows with alerts (BUY LQ / SELL LQ)
⸻
✅ B. Fair Value Gap (FVG) Zones
• Detects FVGs using:
• Sequential logic: Low > High (bullish), High < Low (bearish)
• Gap logic: Open gaps at bar open
• Dynamic box drawing:
• Automatically extends FVG zones until price fully closes through them.
• Different color coding for bullish (teal) and bearish (orange) gaps.
• Customizable:
• Opacity control
• Option to include/exclude gap-based FVGs
• Hide filled zones
• Limit total zones rendered (for performance)
⸻
✅ C. Swing High/Low Structure
• Uses a lookback period to find latest swing high/low levels.
• Acts as a proxy for Order Block zones or structural shift reference points.
• Plotted as red (high) and green (low) lines.
⸻
🚀 3. How to Use It
• Scalpers and Intraday Traders can use Liquidity Sweep + FVG Confluence to time reversals or catch early entries into trend continuation moves.
• Swing Traders can observe swing OB proxies and recent FVG zones to frame directional bias and target zones.
• Volume-Aware Traders benefit from the volume filter that confirms sweeps are meaningful – not just random stop hunts.
🔔 Set alerts on:
• Bullish Liquidity Sweeps
• Bearish Liquidity Sweeps
You can use this in combination with your own trend filters, or even confluence it with Order Blocks, VWAP, or EMA trend tools.
⸻
💡 What Makes It Original?
• The script doesn’t merely combine standard tools — it builds a cohesive ICT-style detection system using:
• A custom volume-confirmed liquidity sweep filter
• Dynamic FVG rendering with filled logic + performance optimization
• Visual hierarchy to avoid clutter: clean line plots, contextual boxes, and conditional signals
• Highly customizable yet lightweight, making it suitable for fast-paced decision making.
⸻
✅ Notes
• Invite-only script for serious traders interested in Smart Money and ICT concepts.
• Does not repaint signals.
• All visuals are dynamically managed for clarity and performance.
ICT Venom Trading Model [TradingFinder] SMC NY Session 2025SetupIntroduction
The ICT Venom Model is one of the most advanced strategies in the ICT framework, designed for intraday trading on major US indices such as US100, US30, and US500. This model is rooted in liquidity theory, time and price dynamics, and institutional order flow.
The Venom Model focuses on detecting Liquidity Sweeps, identifying Fair Value Gaps (FVG), and analyzing Market Structure Shifts (MSS). By combining these ICT core concepts, traders can filter false breakouts, capture sharp reversals, and align their entries with the real institutional liquidity flow during the New York Session.
Key Highlights of ICT Venom Model :
Intraday focus : Optimized for US indices (US100, US30, US500).
Time element : Critical window is 08:00–09:30 AM (Venom Box).
Liquidity sweep logic : Price grabs liquidity at 09:30 AM open.
Confirmation tools : MSS, CISD, FVG, and Order Blocks.
Dual setups : Works in both Bullish Venom and Bearish Venom conditions.
At its core, the ICT Venom Strategy is a framework that explains how institutional players manipulate liquidity pools by engineering false breakouts around the initial range of the market. Between 08:00 and 09:30 AM New York time, a range called the “Venom Box” is formed.
This range acts as a trap for retail traders, and once the 09:30 AM market open occurs, price usually sweeps either the high or the low of this box to collect stop-loss liquidity. After this liquidity grab, the market often reverses sharply, giving birth to a classic Bullish Venom Setup or Bearish Venom Setup
The Venom Model (ICT Venom Trading Strategy) is not just a pattern recognition tool but a precise institutional trading model based on time, liquidity, and market structure. By understanding the Initial Balance Range, watching for Liquidity Sweeps, and entering trades from FVG zones or Order Blocks, traders can anticipate market reversals with high accuracy. This strategy is widely respected among ICT followers because it offers both risk management discipline and clear entry/exit conditions. In short, the Venom Model transforms liquidity manipulation into actionable trading opportunities.
Bullish Setup :
Bearish Setup :
🔵 How to Use
The ICT Venom Model is applied by observing price behavior during the early hours of the New York session. The first step is to define the Initial Range, also called the Venom Box, which is formed between 08:00 and 09:30 AM EST. This range marks the high and low points where institutional traders often create traps for retail participants. Once the official market opens at 09:30 AM, price usually sweeps either the top or bottom of this box to collect liquidity.
After this liquidity grab, the market tends to reverse in alignment with the true directional bias. To confirm the setup, traders look for signals such as a Market Structure Shift (MSS), Change in State of Delivery (CISD), or the appearance of a Fair Value Gap (FVG). These elements validate the reversal and provide precise levels for trade execution.
🟣 Bullish Setup
In a Bullish Venom Setup, the market first sweeps the low of the Venom Box after 09:30 AM, triggering sell-side liquidity collection. This downward move is often sharp and deceptive, designed to stop out retail long positions and attract new sellers. Once liquidity is taken, the market typically shifts direction, forming an MSS or CISD that signals a reversal to the upside.
Traders then wait for price to retrace into a Fair Value Gap or a demand-side Order Block created during the reversal leg. This retracement offers the ideal entry point for long positions. Stop-loss placement should be just below the liquidity sweep low, while profit targets are set at the Venom Box high and, if momentum continues, at higher session or daily highs.
🟣 Bearish Setup
In a Bearish Venom Setup, the process is similar but reversed. After the Initial Range is defined, if price breaks above the Venom Box high following the 09:30 AM open, it signals a false breakout designed to collect buy-side liquidity. This move usually traps eager buyers and clears out stop-losses above the high.
After the liquidity sweep, confirmation comes through an MSS or CISD pointing to a reversal downward. At this stage, traders anticipate a retracement into a Fair Value Gap or a supply-side Order Block formed during the reversal. Short entries are taken within this zone, with stop-loss positioned just above the liquidity sweep high. The logical profit targets include the Venom Box low and, in stronger bearish momentum, deeper session or daily lows.
🔵 Settings
Refine Order Block : Enables finer adjustments to Order Block levels for more accurate price responses.
Mitigation Level OB : Allows users to set specific reaction points within an Order Block, including: Proximal: Closest level to the current price. 50% OB: Midpoint of the Order Block. Distal: Farthest level from the current price.
FVG Filter : The Judas Swing indicator includes a filter for Fair Value Gap (FVG), allowing different filtering based on FVG width: FVG Filter Type: Can be set to "Very Aggressive," "Aggressive," "Defensive," or "Very Defensive." Higher defensiveness narrows the FVG width, focusing on narrower gaps.
Mitigation Level FVG : Like the Order Block, you can set price reaction levels for FVG with options such as Proximal, 50% OB, and Distal.
CISD : The Bar Back Check option enables traders to specify the number of past candles checked for identifying the CISD Level, enhancing CISD Level accuracy on the chart.
🔵 Conclusion
The ICT Venom Model is more than just a reversal setup; it is a complete intraday trading framework that blends liquidity theory, time precision, and market structure analysis. By focusing on the Initial Range between 08:00 and 09:30 AM New York time and observing how price reacts at the 09:30 AM open, traders can identify liquidity sweeps that reveal institutional intentions.
Whether in a Bullish Venom Setup or a Bearish Venom Setup, the model allows for precise entries through Fair Value Gaps (FVGs) and Order Blocks, while maintaining clear risk management with well-defined stop-loss and target levels.
Ultimately, the ICT Venom Model provides traders with a structured way to filter false moves and align their trades with institutional order flow. Its strength lies in transforming liquidity manipulation into actionable opportunities, giving intraday traders an edge in timing, accuracy, and consistency. For those who master its logic, the Venom Model becomes not only a strategy for entry and exit, but also a deeper framework for understanding how liquidity truly drives price in the New York session.

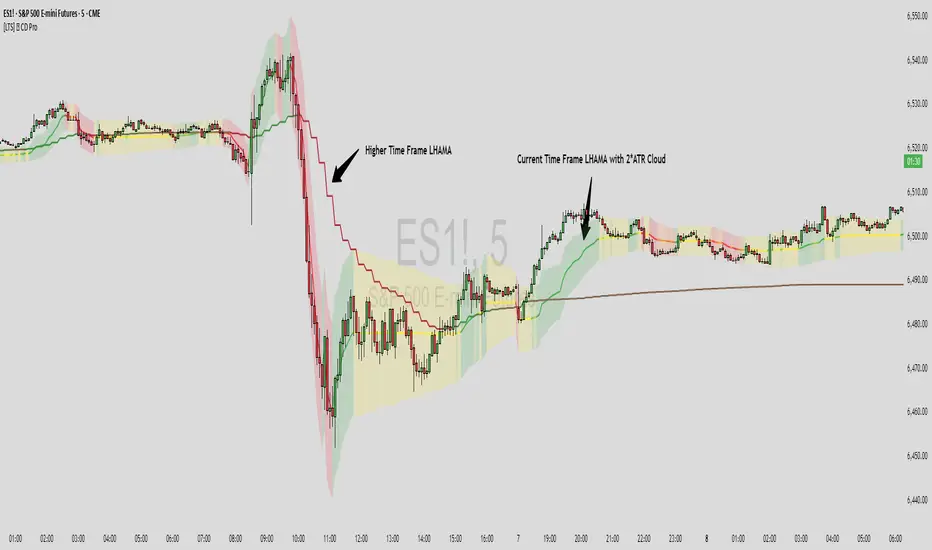
[LTS] LHAMA Consolidation Detector ProLHAMA Consolidation Detector Pro
The LHAMA (Low-High Adaptive Moving Average) Consolidation Detector Pro is an advanced technical analysis tool that displays up to 6 adaptive moving averages with automatic slope detection and visual consolidation identification. This indicator helps traders identify trending versus sideways market conditions across multiple timeframes simultaneously.
What is LHAMA?
LHAMA (pronounced "llama" 🦙) is an adaptive moving average that responds dynamically to market conditions by monitoring when price breaks above recent highs or below recent lows. Unlike traditional moving averages that use fixed smoothing factors, LHAMA increases its responsiveness during trending periods and becomes more stable during consolidation phases.
Key Features:
Up to 6 independent LHAMA lines with customizable parameters
Multi-timeframe analysis - each line can use different timeframes
Automatic slope detection and normalization (works across all instruments without manual adjustment)
Dynamic color coding: bullish (uptrend), bearish (downtrend), and flat (consolidation) states
Optional volume weighting for increased responsiveness during high-volume periods
Daily reset functionality to handle overnight gaps (useful for futures markets)
Optional cloud display around each LHAMA line for enhanced visual clarity
Optimized performance - disabled lines consume zero computational resources
How to Use:
Trend Identification: Easily identify when a move is significant by checking the color of the LHAMA line
Consolidation Detection: Even if price seems to be moving in a trend, the LHAMA line can help you determine if it is meaningful movement or just noise.
Multiple Timeframe Analysis: Enable multiple LHAMA lines with different lengths and timeframes to see trend alignment
Support/Resistance: LHAMA lines often act as dynamic support and resistance levels
Settings Explanation:
Length: Period for LHAMA calculation (shorter = more responsive, longer = smoother)
Volume Weight: Makes LHAMA more responsive during high volume periods
Color Sensitivity: Global setting that determines how quickly colors change based on slope angle. This lets you choose just how flat a "flat" line actually is.
Daily Reset: Optionally resets LHAMA to current price at specified time to avoid drift during session gaps.
Cloud Display: Shows volatility-based bands around LHAMA lines using ATR or Standard Deviation
Timeframe: Each LHAMA line can analyze a different timeframe independently.
Colors: Each LHAMA line can be customized with its own distinct colors for clean, easy visuals.
Technical Details:
The indicator uses a proprietary adaptive algorithm that:
Monitors price breakouts
Applies volume weighting when enabled
Uses slope normalization for consistent performance across all instruments
Implements efficient conditional processing to minimize computational overhead
Color Logic:
The slope detection system calculates a normalized angle of the LHAMA line. This ensures consistent color behavior whether trading stocks, forex, crypto, or futures without requiring the manual sensitivity adjustments of the basic version of this indicator.
Angles less than 5 degrees (default) are considered "flat" (consolidation)
Steeper angles transition smoothly between flat and trend colors
The Sensitivity and Length settings allow fine-tuning for different trading styles
Best Practices:
Start with LHAMA 1 enabled using default settings to understand the indicator
Enable volatility bands to help determine possible TP/SL placement
Use multiple LHAMA lines with different lengths (e.g., 14, 34, 89) or time frames for comprehensive analysis
Combine with other technical analysis tools for confirmation
Adjust the Color Sensitivity setting based on your preferred responsiveness
Enable Daily Reset for instruments with significant overnight gaps
This indicator is suitable for all markets and timeframes, providing traders with a sophisticated tool for identifying market structure and potential trading opportunities through advanced adaptive moving average technology.
FVG Ultra Assertive - Individual Filters (mtbr)FVG Ultra Assertive - Individual Filters (mtbr)
What this script offers:
This strategy detects and highlights FVGs (Fair Value Gaps) on the chart, providing traders with a visual and systematic approach to identify potential price inefficiencies. The script plots bullish and bearish FVG zones using customizable boxes and labels, allowing users to easily spot high-probability trading areas. In addition, it opens and closes simulated trades based on the detected FVGs, enabling full backtesting and strategy performance evaluation. It integrates multiple independent filters to validate the strength of each FVG signal before entering a trade.
How it works:
The script identifies:
Bullish FVGs when the current low is higher than the high of two bars ago.
Bearish FVGs when the current high is lower than the low of two bars ago.
Once an FVG is detected, it applies three optional independent filters:
GAP/ATR Filter:
Measures the FVG size relative to the Average True Range (ATR). Only gaps exceeding a user-defined multiple of ATR are considered valid.
Support/Resistance (S/R) Filter:
Uses pivot points to check if the FVG overlaps with recent high/low pivot levels within a tolerance percentage. This ensures the gap aligns with meaningful market levels.
Stochastic Filter:
Applies a stochastic oscillator to confirm momentum. Bullish FVGs are validated when stochastic values are oversold, and bearish FVGs when overbought.
After passing the selected filters, the strategy opens trades:
LONG FVG for bullish signals (buy)
SHORT FVG for bearish signals (sell)
The strategy automatically closes positions when an opposite signal appears, generating a backtest report with trades, profits, and statistics. The final bullish or bearish FVG signals are plotted as colored boxes on the chart with labels “BULL FVG” or “BEAR FVG” for immediate visual reference.
How to configure it for use:
Use GAP/ATR Filter: Enable or disable the ATR-based filter and adjust the ATR period (ATR Length) and minimum gap multiplier (Minimum Gap x ATR).
Use S/R Filter: Enable or disable the pivot-based S/R filter. Configure the pivot lookback periods (Pivot Left and Pivot Right) and the tolerance percentage (Gap Tolerance %).
Use Stochastic Filter: Enable or disable stochastic confirmation. Adjust the K and D lengths (Stoch K Length and Stoch D Length) and the overbought/oversold thresholds (Stoch Overbought and Stoch Oversold).
Colors: Customize the colors for bullish and bearish FVGs (FVG Bull and FVG Bear) to match your chart preferences.
Usage Tips:
Apply this strategy to any timeframe; shorter timeframes generate more frequent FVGs, while higher timeframes highlight stronger gaps.
Combine FVG signals with other technical analysis tools for better trade confirmation.
Use the box and label visualization to quickly scan charts for trade opportunities without cluttering the chart.
The strategy’s trades (LONG and SHORT) provide backtesting results and performance statistics for each signal.

Innotrade FVGThe Innotrade FVG indicator is a professional-grade tool designed to automatically identify, display, and manage Fair Value Gaps (FVGs).
What makes this indicator unique is its full lifecycle management. Unlike basic FVG tools that permanently clutter your chart, our script intelligently tracks an FVG from its creation to its conclusion:
ACTIVE: A new FVG is identified and drawn.
MITIGATED: The FVG changes color the moment price touches it, providing a visual confirmation.
TAKEN: The FVG is automatically removed from the chart once price has passed completely through it, keeping your analysis clean and focused on relevant market data.
This dynamic approach ensures your charts remain clear and that you are always focused on active, relevant imbalances.
█ CORE CONCEPT: WHAT IS A FAIR VALUE GAP (FVG)?
A Fair Value Gap represents a market inefficiency or imbalance. It is a three-candle pattern that occurs when price moves with significant force in one direction, leaving a gap between the first candle's high and the third candle's low (for a bullish FVG) or the first candle's low and the third candle's high (for a bearish FVG).
These gaps often act as a "magnet" for price, meaning the market has a high probability of returning to this area to "rebalance" the price action before continuing its trend.
█ KEY FEATURES
Full FVG Lifecycle Management: Automatically tracks FVGs from Active -> Mitigated -> Taken, keeping your charts pristine.
Robust Multi-Timeframe (MTF) Analysis : Detect FVGs on higher timeframes (e.g., 4H) while viewing a lower timeframe chart (e.g., 15m), allowing for high-precision entries based on key market structure.
Customizable Mitigation Alerts: Create an alert to be notified the moment price enters an FVG, so you never miss a potential trading opportunity.
Clean and Clear Visuals: Fully customizable colors for bullish, bearish, and mitigated FVGs allow you to tailor the indicator to your charting theme.
Efficient and Reliable Code: Built to handle all timeframe contexts correctly, ensuring the indicator is reliable whether you are analyzing the current chart timeframe or a higher one.
█ HOW TO USE THE INDICATOR
The primary function of this indicator is to highlight key areas of interest where price may return.
Bullish FVG (Green Box): This is an area of potential support. Traders often look for price to retrace back down into this box as a potential entry point for a long position.
Bearish FVG (Red Box): This is an area of potential resistance. Traders often look for price to rally back up into this box as a potential entry point for a short position.
Mitigated FVG (Gray Box): This indicates that price has already returned to test the FVG area. The imbalance has been at least partially filled.
Example Strategy:
Set the indicator to find FVGs on the 1-hour timeframe.
Switch to your 5-minute chart for execution.
When a green Bullish FVG appears on your chart (from the 1H timeframe), set an alert for its mitigation.
When the alert triggers, look for a bullish confirmation signal on the 5-minute chart to enter a long trade.
█ SETTINGS EXPLAINED
General Settings
Show FVGs: A master switch to turn the visibility of all FVG drawings on or off.
Timeframe for FVG Detection: Choose the timeframe on which the indicator will look for FVGs. Leave this blank to use your chart's current timeframe.
Enable Alerts on FVG Mitigation: This must be enabled to allow TradingView's alert system to work with this indicator.
Style Settings
Bullish FVG Color: Sets the color for newly formed bullish FVGs.
Bearish FVG Color: Sets the color for newly formed bearish FVGs.
Mitigated FVG Color: Sets the color that an FVG will turn into after being touched by price.
Extend Boxes into the Future: When checked, FVG boxes will continue to extend to the right until they are mitigated or taken.
Label Color / Label Size: Customizes the "FVG" text that appears on newly formed gaps.
