M4x Rainbow V4i strat LINK-USDTGRID & TREND Multiplier Experiment
// "M4x Rainbow" is a Strategy Grid Trend Multiplier bot, who is following the trend.
// I built it as an experimental tool with Strategy implemented, even if that numbers are far out...!
// Because.....it not only depends on the bot setup, the timings of the TradingBot (eg.3Commas) are very relevant too!
// Like amount of Trades, Security Orders, Deviation and so on...
// Please feedback your experience with a Comment , as I would like to improve this bot.
// Updates will follow ;-)
//
// "M4x Rainbow" is not bound on FIFO, each trade get's his own exit.
// It is set for Pyramiding, which can be changed in the "Strategy" line
// Fees are set equal to Binance numbers at 0.1%, about...
// The coloring of the lines is:
//
// green = linestate is LONG
// blue = linestate is WAIT
// yellow = linestate is SHORT
//
// Give it a try and let me know.
//
// ...have fun ;-)
스크립트에서 "bot"에 대해 찾기

M4x FIB-o-matic V3.6M4x is a combination of RSI and Fibonacci components, set up with fixed values, so no worries about "original" settings...
Recommendet Bot settings:
- use one short and one long bot
- take profit 0.5%
- 6 simul trades
- 3 security orders, VolScale 1.5, StepScale 1.4
- Deviation 0.35%
- cooldown 780sec
Alerts:
- aproved Buy
- aproved Sell
- heartbeat (..check if Script is running. Gives you the possibility to get an alive Signal every minute)
(With a few "input" M4x can be changed into a highly configurable Signal Generator with menus.)
...tested successful with BTC-ETH, gl ;-)

Forex levrage 1 minOk this is more complex code the scanner system that why I protected it so folks will not abuse it . this system have no repaint as no security attach to mtf
the problem with the scanner system
that it only long system ,if you stuck in a loop you cannot get out of it unless a new win trade will start. this can be catastrophe if we use leverage system as it will destroy our all account. in the scanner system one can use stop loss but it will reduce profit very much.so that will be the exit . and there is no way for short. in this system which is based on the scanner system you do short. you can still use stop loss or exit by short
so since forex go by pairs. if the strategy of long does not work then flip sides for the longs neaning oposite coin. or short it.
this sytem allow you to use leverge and see by test how to calculate your best way to enter a levrage .
since it 1 min I set it to take profit as 0.2,0,0.4 0.5 and 0.7 . and to take 25% each time .
if you are familar with scanner system then it will easy to navigate with this one as well
the exit system you can see min time. HTF and candle time. the HTF is on the frame that we use . try to play either with minute time or candle time to get better results this sytem great for coins that are going up. so beaware of this issue
if you have questions please let me know
the levrage is set to 100% of your lot at 1 X
in real life I use 10% of my lot and then i put any leverage that i want depend on the strategy that I use
so be aware of this fact
this system buy and sell in avreage 800-1500 min cycle so about a day or so to get our profit out of it.
you can use it as advisor not as bot and then you decide by your self where the best exit need to be.
take this sytem only as helper for your forex trades
there is no subsitution for common sense..that a bot can never give you. so be carfull with the money that you risk

Crypto 1 hourSimilar to indicator stock 4 hour
this bot design for crypto 1 hour chart (i find this time frame as the best one for it)
two versions of operation
1. non repainted as suggested by pine coders LucF
2. the other one is repainted with my supress repaint mechanism
the repainted version work fine but be aware that repaint may occur so it not perfect
if you decide to use the repainted one just know it not perfect even if i try my best to remove all repaint issue
alerts included
one way to check for repainting signals is by using bar repaly
the other way to see is to convert from repaint mode to unrepaint mode
if signal move 1 mtf forwrd and stay by similar order you saw before ' you can say that it was a true signal
normaly when we do this the repaint ones need to dissaper when we covert them to non repaint mode
if they move 1 mtf ahead then they were true when they were on the unrepainted version
system is very similar to ECG MACD strategy with some minor changes that I made in the buy and sell but this not so imprtant .
the daily candels are non repainting MTF candles. it just to make the atudy more preety . but it has no relation to buy and sell operation
The way i sugeest to use the repainted model is not automatic since there is repaint sometime
i suggest to use semi automatic mode
meaning the algo send alert . you just need manualy to check if the alert was true or not
since it buy and sell very slowly ,you have enough time to enter trades manualy for it.
if you find this manuver not needed and it working fine live . only if you are sure in that then move this indicator to act as real bot and make it full automatic
why i use repaint mode?
becosue the correction of repaint move the signal 1 mtf ahead. so most of time the repainted version send signals at more true postition. sometime due to repaint which can be we may get bad signal. but overall the system us design to work better at repaint mode.
so let me know what you think
in future i will try to make my anti repaint system to ne better I hope:) ?
so be wise when you put your money to something. use your decision wisely
treat this indicator as helper but it your job to monitor when there is a repaint or not..

LoFi Trend Version 1.0Lofi Trend v. 1.1 - confirmation to be used with Lofi Trend. (version 4.0 pine)
The goal of this indicator is to plot rsi , ema values on any chart. You can also adjust it for larger time frames. Repainting issues have been fixed and updated to pine version 4.0
The script is currently under development and additional updates will be added based on performance from a 24/7 active bot that is using this on 1hr, 4hr, 12hr and daily time frames. The output may vary slightly between different chart time frames for the same indicator settings.
This is an "Invite Only" script. Contact me for details.
User Interface/Detail Description:
- Green Bar= Buy
- Red BAR = Sell
This indicator can be easily used with popular bot trading platforms. Feel free to contact me for details.
Can be used for all Charts

LoFi EMA version 1.3aLoFi EMA version 1.3a
The goal of this indicator is to plot rsi , ema values on any chart. You can also adjust it for larger time frames. Repainting issues have been fixed and updated to pine version 4.0
The script is currently under development and additional updates will be added based on performance from a 24/7 active bot that is using this on 1hr, 4hr, 12hr and daily time frames. This can also be used for degen trading on the 2 min chart. The output may vary slightly between different chart time frames for the same indicator settings.
This is an "Invite Only" script. Contact me for details.
User Interface/Detail Description:
- Green Bar= Buy
- Red BAR = Sell
This indicator can be easily used with popular bot trading platforms. Feel free to contact me for details.
Can be used for all Charts
Basic Entry Chart Layout:
BITMEX:
BITCOIN:
FOREX:
LEGACY:/ STOCKS:

LUBEThis is a chart meant for 30m BTCUSD but could be used for many other assets, and there are inputs to play with.
I decided on the strange title "LUBE" because I was measuring how many of the previous 500 bars had the current price level already been in. I wanted to discover when the price was in a new zone or an area that it hadn't spent much time in recently... the LUBE zone.
Think of the blue line as showing you the current level friction. If the blue line is high, price is quagmired and not moving quickly. Price could trend sideways for a while before breaking out. A high blue line is a high traffic zone for trading. When the blue line dips low, it's encountering a price zone the asset has not been observed in recently, and this could mean price could break out and move more freely and quickly when it does. We get a trade entry signal if the blue line dips below the bottom white line. The bottom white line is currently set to -10. Think about the lowest the blue line has been recently as 0, and the highest as 100. It is set by default (for BTCUSD 30m chart) to -10 meaning the blue line has to dip a little (-10%) below the lowest it has experienced recently to initiate a trade. This is the LUBE zone. The bottom white line shows that level. Again this is a level lower than the lowest amount of friction experienced in price action for the last 100 bars, but offset by 5 bars showing where that level was at 5 bars ago. We want to dip below that to initiate a trade.
The direction to trade in is determined by a very quick moving weighted moving average (variable name is "fir") to see if the recent trend is up or down. To end a trade, an arbitrary number between 0 and 100 is picked telling us when we are experiencing enough friction again to end the trade. I have it preset to 50 (think of it as 50/100 or half way between the white bars. At a 50% friction level it's time to get out of the trade.
Some shortcomings are missing the bulk of big moves, and experiencing whipsaws where price action zips up and then comes straight back down. Overall the backtest looks sweet enough to use on 2x leverage, experiencing a 17.78% max drawdown at the time of publishing. I wouldn't push the leverage any higher.
To get alerts change the word "strategy" to "study" and delete lines 60-67.
Bot traders using alerts: beware the alert conditions. If a trade goes directly from long to short (which happens rarely), without closing a trade first, it might not act properly. If you use bots to trade, for "LONG" please close any old trades first before putting in instructions to open a leveraged long. To go "SHORT" please remember to close any old trade first as well, and things *should* work out just fine.
Good luck, have fun, and feel free to mess up and butcher this code to your own liking. I'm not responsible if anything bad that happens to you if you use this trading system, or for any bugs you may encounter.

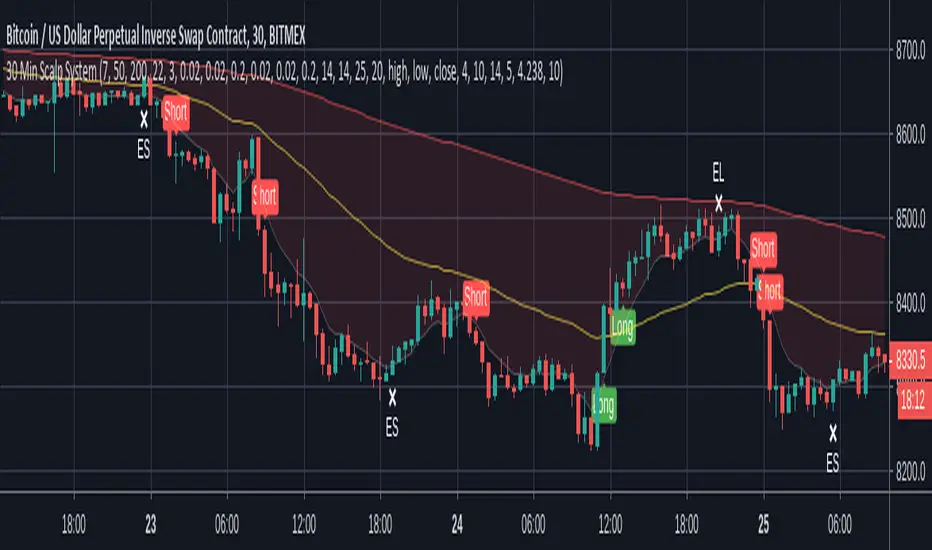
30 Min Scalp SystemA scalping script for the 30 min chart that is designed and tuned to be used with trading bots such as ProfitView or Autoview. I personally trade with this on Bitmex.
This trading system is built upon 4 established trading indicators that compliment each other. All signals are filtered in a number of ways to avoid chop and only trigger when a strong trend or crossover is identified.
Alerts are included for longs, shorts and exits in both directions.
Recommended setup:
- Trade with leverage and take 75%-80% out at 0.5% profit, leaving the rest to run
- Initial stop-loss of 1%, initiating a trailing stop of 0.75% when TP is hit
- Ensure bots are set to ignore open orders in the same direction
I use this in conjunction with ProfitView where I run three custom scripts to manage my position entries, monitor profit levels, dynamically move my stop and then exit positions where appropriate.
Note: Exit signals are show here even when trades aren't open because it's only possible to hide these when using a strategy script. This is coded as an indicator so that alerts can be sent to your chosen bot.
Disclaimer: The signals aren't perfect but no script is. The above cannot be considered financial advice and I take no responsibility from any losses incurred. A test account is recommended to verify the win rate before trading on a live platform.
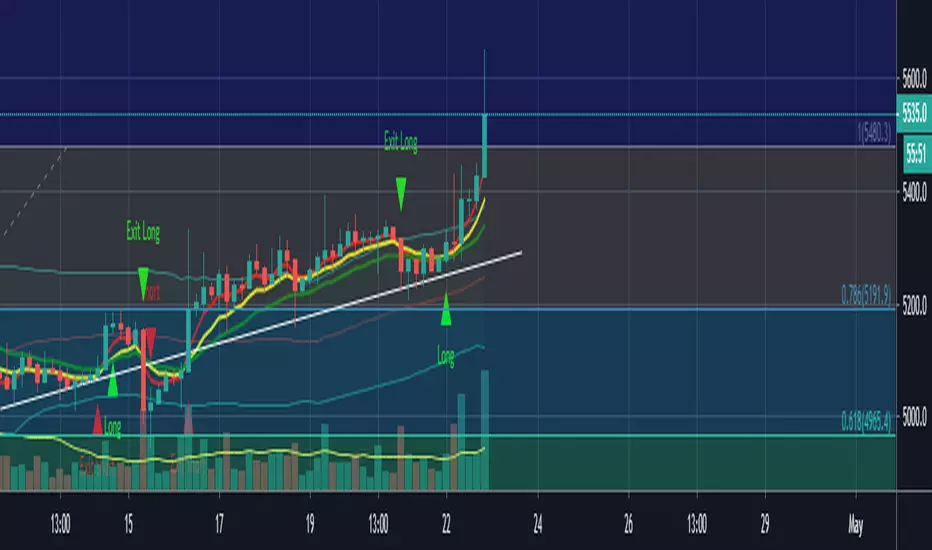
[astropark] Ichimoku Cloud Strategy [alarms]Dear Followers,
today a Great Swing Trading Strategy , runnable on a bot , which works great on High Timeframes (1D is suggested!) but also even better on 1m Renko chart.
If you are a scalper, you will love suggested entries for fast profit. You can run it on 1h timeframe (below is not suggested) if you are used to scalp trading and close each trade whenever you feel happy (a proper trailing stop strategy is suggested anyway).
This strategy is based on the Ichimoku Cloud Indicator and let's you set a lot of settings:
works on all timeframes (but 1D and above is suggested on normal candlesticks chart)
you can run this indicator on 1m Renko chart (be sure to enable the "USING RENKO CHART? ENABLE THIS OPTION" setting)
you can use 4 kind of Ichimoku Cloud (Custom, Slow, Standard and Fast - keep only one enabled)
you can make the Ichimoku Cloud show or not
you can enable showing the possibile re-entries
you can enable an heiking ashi analysis
you can enable a trailing stop strategy ("Auto Trailing Stop Loss" and "Close Trade When Price Breaks Above the Ichimoku Cloud" are two options very much suggested to keep enabled, especially on bot trading)
you can create your own trailing stop stategy and take profit strategy
you can enable a simple take profit strategy based on RSI Overbought and Oversold levels
This strategy only trigger 1 buy or 1 sell, but if you missed the possibility to open your long or short position don't get mad, but just enable the "show re-entry signals" option, so yout will be able to enter again (be sure to always use a proper money management ).
By the way, you can set any alarms you like in order to get notified when any kind of signal is triggered (you need to use the "alarms" version for this).
Strategy results are calculated on the timeframe from May 2017 to now, so on 2 years and half, using 10000$ as initial capital and working at 1x leverage (so no leverage at all! If you like to use leverage, be sure tp use a safe option, like 3x or 5x at most in order to have liquidation price very far).
This is not the "Holy Grail", so use a proper risk management strategy.
This script will let you set all notifications you may need in order to be alerted on each triggered signals (there is also an "ALL-IN-ONE" option for free tradingview users.
The backtesting version of this indicator, which will let you backtest how the indicator will perform on any chart you may test, can be found by searching for "Ichimoku Cloud Strategy" and then choosing the astropark indicator with "red and green arrows" at the end of the name. You can find it here below too:
This is a premium indicator , so send me a private message in order to get access to this script.

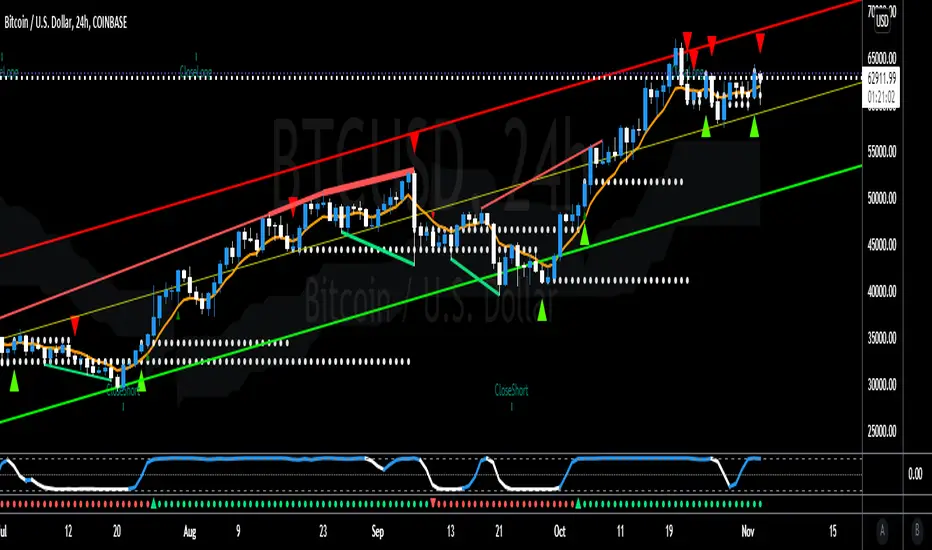
[astropark] Ichimoku Cloud StrategyDear Followers,
today a Great Swing Trading Strategy , runnable on a bot , which works great on High Timeframes (1D is suggested!) but also even better on 1m Renko chart.
If you are a scalper, you will love suggested entries for fast profit. You can run it on 1h timeframe (below is not suggested) if you are used to scalp trading and close each trade whenever you feel happy (a proper trailing stop strategy is suggested anyway).
This strategy is based on the Ichimoku Cloud Indicator and let's you set a lot of settings:
works on all timeframes (but 1D and above is suggested on normal candlesticks chart)
you can run this indicator on 1m Renko chart (be sure to enable the "USING RENKO CHART? ENABLE THIS OPTION" setting)
you can use 4 kind of Ichimoku Cloud (Custom, Slow, Standard and Fast - keep only one enabled)
you can make the Ichimoku Cloud show or not
you can enable showing the possibile re-entries
you can enable an heiking ashi analysis
you can enable a trailing stop strategy ("Auto Trailing Stop Loss" and "Close Trade When Price Breaks Above the Ichimoku Cloud" are two options very much suggested to keep enabled, especially on bot trading)
you can create your own trailing stop stategy and take profit strategy
you can enable a simple take profit strategy based on RSI Overbought and Oversold levels
This strategy only trigger 1 buy or 1 sell, but if you missed the possibility to open your long or short position don't get mad, but just enable the "show re-entry signals" option, so yout will be able to enter again (be sure to always use a proper money management ).
By the way, you can set any alarms you like in order to get notified when any kind of signal is triggered (you need to use the "alarms" version for this).
Strategy results are calculated on the timeframe from January 2016 to now, so on 3 years, using 10000$ as initial capital, doing only 6 trades (great swings!) and working at 1x leverage (so no leverage at all! perfect spot trading style!). If you like to use leverage, be sure tp use a safe option, like 3x or 5x at most in order to have liquidation price very far).
This is not the "Holy Grail", so use a proper risk management strategy.
This script will let you backtest how the indicator will perform on any chart you may test. Of course results will be very different depending on the chart you will open. I tested a lot of charts and always you can find a combination that keep this strategy in profit on swing trading style (and this means that if you can have a daily look at the chart you can always manage to maximize your profit on each trade!
The alarms version of this indicator, which will let you set all notifications you may need in order to be alerted on each triggered signals, can be found by searching for "astropark Ichimoku Cloud Strategy" and then choosing the "astropark" indicator with "alarms" suffix in the name.
This is a premium indicator , so send me a private message in order to get access to this script.

HeiKin Crossover With Alerts [Lofi]HeiKin LoFi - Crossover With Alerts
The goal of this indicator is to plot stoch, rsi, ema values "as if" the chart is a true price action based on a Heiken-Ashi Chart. It can also be used on a regular candle stick setting or the original Heikin Ashi chart.
The script is currently under development and additional updates will be added based on performance from a 24/7 active bot that is using this on 1hr, 4hr, 12hr time frames. The output may vary slightly between different chart time frames for the same indicator settings. A bad setting would be something like a sub 10-15 minute chart with BTCUSDT binance although some progress has been made on lower time frames. I have added an adjustable setting window for user tuning.
This is an "Invite Only" script. Contact me for details.
User Interface/Detail Description:
- Green Arrow = Buy
- Red Arrow = Sell
- Purple Arrow = High Risk Long
- Yellow Arrow= High Risk Short
This indicator can be easily used with popular bot trading platforms. Feel free to contact me for details.
Can be used for all Charts
Basic Entry Chart Layout:
BITMEX:
BINANCE:
FOREX:
I allow users to tune functions for almost any time interval. example 5 Second Chart:
CBMA Bollinger Bands Strategy directed [ChuckBanger]I just did a Bollinger Bands script with my newly CB moving average
While I'm generally against posting strategies because it's very easy to fake performance numbers... This is just to share a cool strategy snippet. My settings are 10 contracts/order with pyramiding set to 10. You can make the profitability a lot higher if you set the order size higher. But that dosent help you getting more out of this script when u make a bot of this script. I set the order size to 10 contracts to get your attention not to showcase the performance.
When the price is going down and outside of the lower side of the band. And when the price comes back into the channel the strategy buys. Usually that means the price is going up. And when the price is going up and outside of the upper band. The strategy sells when it crosses back in to the channel.
It is a very simple strategy but it is effective. I guess you need a proper stop-loss for this script to bee really profitable in a bot environment.

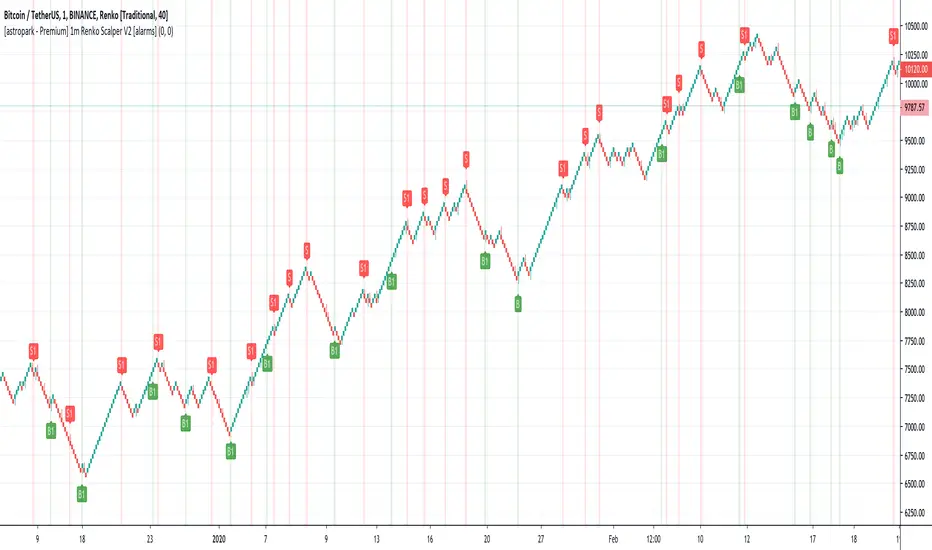
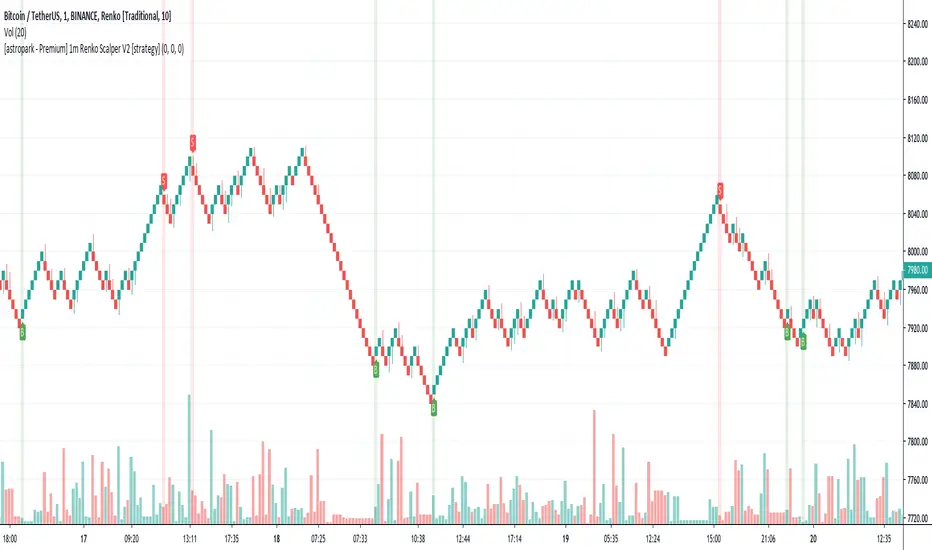
[astropark - Premium] 1m Renko Scalper V2 [alarms]Dear Followers,
today a new Scalper Tool , which works great on 1 minute timeframe , which is the best and more secure timeframe to use on a Renko chart, besides it works great up to 15m (I don't suggest to use a renko chart over 15m timeframe)!
It is an upgraded version of Bitmex Renko Scalper that you can find in my tradingview script page.
This tool has some cool features:
it works on 1 minute timeframe : so you can enjoy high-frequency trading by using a 24/7 running bot;
wait bricks optional mode : you may like to make script wait for triggering a new signal by waiting 1 or 2 more confirmation bricks
trailing stop : you can set a trailing stop in trade, so script will alert you if it will be reached in chart
This strategy can trigger till 5 buy or 5 sell signals in a row before reverting, so use a proper money management .
Strategy results are calculated on the timeframe from july to now, so on about 4 months, using 10000$ as initial capital and working at 3x leverage (very safe leverage!).
The user who wants to use this strategy, especially via an automated bot, must always set a stoploss at 5% from entry point or use a proper risk management strategy .
This is not the "Holy Grail", so use it with caution.
This script will let you set all notifications you may need in order to be alerted on each triggered signals.
The backtesting script version of this indicator, which will let you backtest this script and find best settings for your preferred market, can be found here below:
On Bitmex XBTUSD chart best settings is Traditional Renko chart with 10$ box size.
This is a premium indicator , so send me a private message in order to get access to this script .
[astropark - Premium] 1m Renko Scalper V2 [strategy]Dear Followers,
today a new Scalper Tool , which works great on 1 minute timeframe , which is the best and more secure timeframe to use on a Renko chart, besides it works great up to 15m (I don't suggest to use a renko chart over 15m timeframe)!
It is an upgraded version of Bitmex Renko Scalper that you can find in my tradingview script page.
This tool has some cool features:
it works on 1 minute timeframe : so you can enjoy high-frequency trading by using a 24/7 running bot;
wait bricks optional mode : you may like to make script wait for triggering a new signal by waiting 1 or 2 more confirmation bricks
trailing stop : you can set a trailing stop in trade, so script will alert you if it will be reached in chart
This strategy can trigger till 5 buy or 5 sell signals in a row before reverting, so use a proper money management .
Strategy results are calculated on the timeframe from july to now, so on about 4 months, using 10000$ as initial capital and working at 3x leverage (very safe leverage!).
The user who wants to use this strategy, especially via an automated bot, must always set a stoploss at 5% from entry point or use a proper risk management strategy .
This is not the "Holy Grail", so use it with caution.
This script will let you backtest this script and find best settings for your preferred market. On Bitmex XBTUSD chart best settings is Traditional Renko chart with 10$ box size.
The alarms version of this indicator, which will let you set all notifications you may need in order to be alerted on each triggered signals, can be found by searching for "1m Renko Scalper V2".
This is a premium indicator , so send me a private message in order to get access to this script .
FCO FIRE
FCO FIRE
BitMEX trades highly successful scalp in XBTUSD parity. You can use it not only for crypto but also high success on stock market.
You can contact to use.
Improvement works in progress...

TrendMaster ProTrendMaster Equilibrium X
TrendMaster Equilibrium X is a composite of TrendMaster, MokuMaster and KishokuMaster in one indicator. It is designed to be a drop-in replacement of our flagship indicator, TrendMaster, allowing the user to examine all three indicators on a single chart. The purpose of TrendMaster Equilibrium X is to provide a sentiment filter when assessing possible Trendmaster entries. When all three indicators align, we have equilibrium and can feel confident to take the trade. The indicator is optimised for weekly, daily and 4-hour candlesticks and can be used for all trending markets. It is exclusively available to our Pro tier members.
MokuMaster
MokuMaster is based on Ichimoku and its colours are derived from Ichimoku's depiction of trend conditions. When examining charts for directional bias you can simply check the colour of MokuMaster.
Bright Green - Resolutely Bullish
Green - Bullish
Blue - Neutral
Pink - Bearish
Red - Resolutely Bearish
These categories represent the interactions between Price, the Tenkan-sen, the Kijun-sen, the Kumo and the Chikou Span. This can be overwhelming if you are not an accomplished Ichimoku trader. MokuMaster allows you to view these interactions without the difficulty of interpreting what they mean.
KishokuMaster
KishokuMaster is a very simple indicator designed to provide an immediate representation of the ‘mood’ of the market. It provides an optimal balance of lag and smoothing to help traders establish a Bullish or Bearish bias. The underlying logic is based on Alan Hull's weighting techniques. KishokuMaster generally gives an early warning of a trend reversal.
Confluence
When assessing a TrendMaster entry, you can use TrendMaster Equilibrium as a simple checklist as shown in the annotated chart below. By taking entries that satisfy all criteria, you increase your likelihood of a successful outcome.
How to get it?
If you would like to use TrendMaster Equilibrium or any of our other Indicators, please visit my site. Here you can purchase one of our packages which include indicators, market scanner bots and a large Discord community. You will also find educational content and how to guides for our indicators.
Our Story
Founded in 2018 by IchimokuScholar and C00kie, TrendMaster is a team that produces technical analysis indicators with an emphasis on simplicity and noise reduction. We support a large community with educational content, automated market scanners and mentoring in our private chat rooms. We produce technical analysis indicators geared primarily towards the emerging Cryptocurrency asset class. We provide educational material to assist trader development and host a large online trend following community. All of our products are designed to help traders distinguish relevant information from background noise. Our indicators encourage disciplined trade management to maximise the opportunity captured while minimising losses.
IchimokuScholar
IchimokuScholar – In 2017 I retired from a career in higher education to focus on Trading. I like to trade long term trends, focusing primarily on continuation setups. I am dedicated to sharing my knowledge of trading and take great pleasure in simplifying technical analysis for newer traders.
C00kie
I started trading crypto in 2017 and immediately started coding a bunch of tools to improve my quality of life. Some definitely worked out better than others. Like to trade the higher timeframes and drawing horizontal lines on charts. I am also pretty much obligated to like cookies. Indicators. Here you can purchase one of our packages which include indicators, market scanner bots and a large Discord community. You will also find educational content and how to guides for our indicators.

Momentum Signal Moving AverageThis is a script with one modified indicator that mainly tracks and executes positions openings by calculating volume and "enthusiasm" from the exchanges coin pairs. I recommend that it is used on a 15m chart.
When it is a bullish trend it is configured to take profit, but this is of course something you can set values or disable. In bearish trends, the script opens bigger positions, and when a bounce happens the script starts taking profit.
In stagnation, the script used to be week, and made losses. However, with the added scalping feature it seems to at least even it out, or even make profit as I have seen now.
It's still a very 1.0 script and will get updated to make sure the profit keeps getting higher percentage.
I use the Alerts Trader extension to execute orders from Tradingview in Chrome via Bitmex API.
I use it on Bitmex, but surely you can use it on other exchanges that are supported in the Alerts Trader extension, which is extensive.
Important : You will be able to add this script to your chart, but you won't be able to se the source code, so to make it work you need to set the alerts right, with correct code for it to work.
Here is where I come in:
I'll give each user 3 day trial, and after that, if you are satisfied and want to run it longer, you can subscribe for $49/month.
And if you have bigger capital, I will install it and configure it to match the amount of contracts you wish to have.
If you are a person with big capital, you can get 1 week of trial.
And for people with big capital, you can get personal support from me when needed to alter settings or create new alerts. This will cost $50 each time.
But remember, you can also run the trial on the Bitmex testnet, but the volume is very low there so the bot does not preform as well on the testnet as it does on the mainet with big volume.
I am willing to let someone, a 3rd party, with good reputation test it for a few days and make an honest review after.
Disclaimer: I cannot guarantee that this script will make you rich, but after a week of testing, both on testnet and mainnet, the results are good enough for me. (I am no financial expert or professional trader. Any losses from the algorithm is not my issue, use it at your own risk. Always run the script/bot with money you can afford to lose)
All payments to me are made in bitcoin.

BitMEX Swing Trader MillionaireA bitcoin ATM machine on the 4hr
stick .25 bitcoin in an account set it up with an api bot like Autoview, alerts traders or even my very own api bot and avoid paying monthly sub..
ping me for details
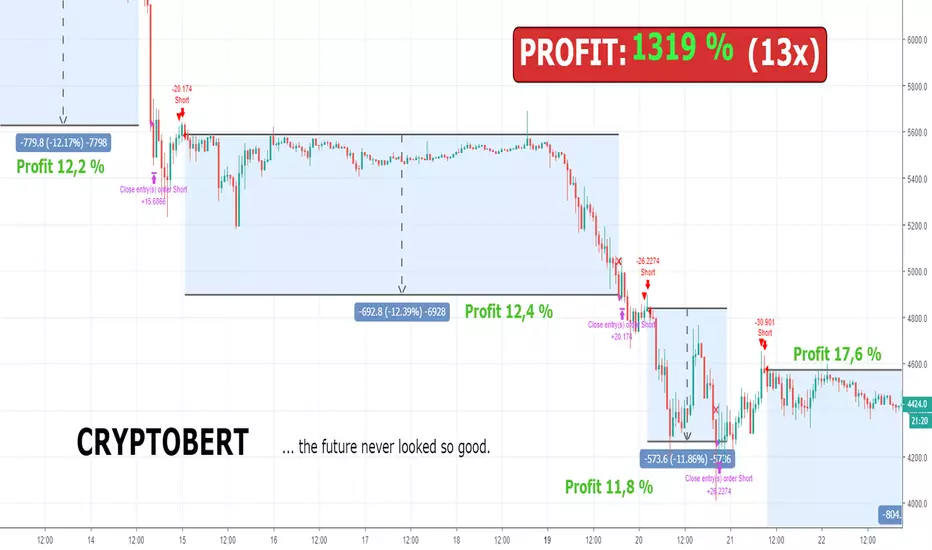
Bert LONG BTC Study (Alerts) - Profit 2018: 1319 % (no leverage)Bert LONG Term BTC study (BITMEX) - script for setting alerts and trading bots
This is a revolutionary strategy for bitcoin (XBT) trading. The strategy is perfectly configured for trading on the Bitmex exchange. No further configuration and setup is required.
The strategy itself recognizes a volatile period or whether the market is in downtrend, uptrend or sideways. Accordingly, it applies the appropriate orders to reach maximum profit.
The strategy can be handled manually, you can receive alerts (popup, email, sms) or can be fully automated by bot (works with: Autoview, Gunbot, Profitview, Jubot and others) without any manual intervention.
What is the minimum and maximum capital I can trade with?
You can trade with 0.0001BTC – 1000BTC. That is one of many advantages of using this strategy on XBT. There is enough liquidity to execute the order for the market price with a big investment amount.
What is the recommended setting?
Timeframe: 45m
Chart: Bitcoin/USD Dollar Perpetual Inverse Swap Contract (XBT)
Leverage: 2x
Orders: Long and Shorts
Why was this strategy created?
You have basically two option how to make money in crypto market. HODL (buy the coin and believe it will rise to the moon) and TRADING (only 3-5% traders are profitable, most of them are full time traders with 5+ years of experience in trading).
If you HODL btc in this year, you are -70 % this year
If you are TRADING, the results depend on how good you are (think about this, if you decide to be a heart surgeon, rocket star or NBA player, do you think you can be? Yes, you can but the chances are very small. The same probability you have that you will be in the 3-5% profitable traders 😊). It takes time, you need experience and still 96% all of you will never be a profitable traders!
If you use Bert BTC long term strategy, you are + 1319 % this year
How well the Bert BTC strategy performs?
Profit in 2018 was 1319 % / 13x (without leverage)
Profit in 2018 was 11 477 % / 115x (with leverage 2)
If you invested (with leverage 2) 1 000 USD you have now 114 766 USD
If you invested (with leverage 2) 10 000 USD you have now 1 147 660 USD
Detailed trades report for 2018 (you can calculate your own profit with specific investments and leverage) – download excel here
Notes:
You will hardly find better strategy on the market which achieves similar results with minimal risk and can operate in any market condition (downtrend, uptrend, sideways).
We guarantee the strategy does not repaint, and we use real candles (not heikin ashi or renko which does not reflect real prices).
We wish you to become financially independent and all your secret wishes to be fulfilled.
And in case if you still want to HODL or you want to be TRADING all the days watching to your monitors, consider to try our strategy at least with a minimum capital invested, you will see that you will not regret in long run. Be patient and the money will come to you!
For access to this strategy visit website: www.cryptobert.io
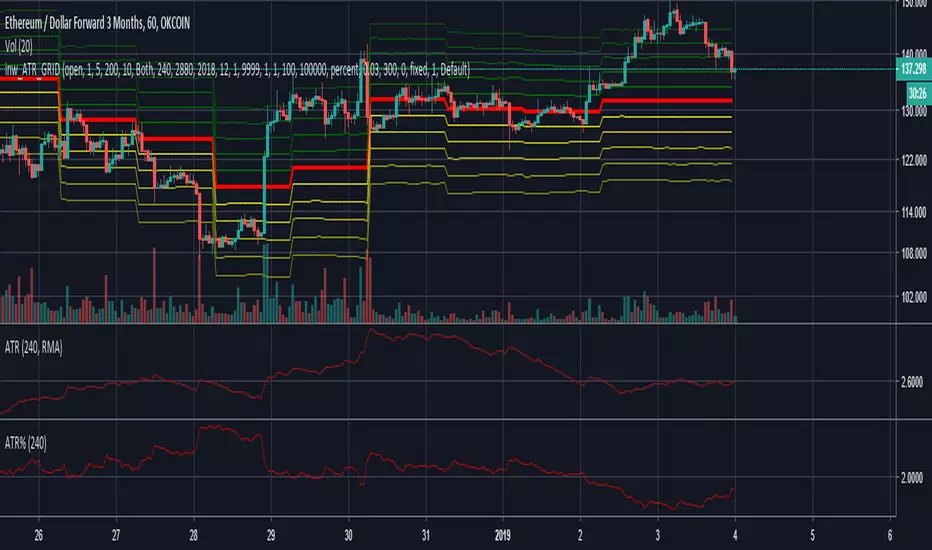
inwCoin ATR Grid Strategy ( incomplete )Due to Pine Script limitation that we cannot open both short and long order at the same time. So this GRID idea cannot backtest yet.
This strategy is for using with CTC Okex Bot grid system only.
The idea is to check how wide the grid with ATR so you can setup each grid size in CTC Bot every day ( or cut loss some grid accordingly )
WARB STARD [v0.5] -- BACKTESTER
WARB*STARD is a more HTF bot script that operates best on the H4 time frame.
Like my other bots, it uses a very very simple technique; just a pair of moving averages... (that's all you need folks). Keeping it simple is almost always the best approach and I feel leans toward more favourable performance, going forward into the unknown. After all, backtests are hypothetical.
Features include
* separate long/short settings (I feel this is justified in e.g. growth markets)
* internally use heikin ashi candles (TV's backtester uses the wrong open/close price for HA)
* multi-exchange weighted price for BTCUSD
* generates take profit warnings
Will update this backtest page when necessary and create a separate published script for signals.

inwCoin HMA AlertSimple alert to go along with the inwCoin HMA Strategy
Please not that the alerts are persistent 2.70% , if you already enter the position,
just ignore the rest of the same alert until the opposite alert show up
( long then short / or short then long , if change, just close and enter opposite position )
You can set the alert and let it tell you to iOS app via TradingView app ( yey! )
Please note that, if you don't have bot to track your trailing start/stop. you have to enter the TP/SL manually ( also tracking the position )
So... be careful to follow this alert. just try it with small amount of money first.
and make sure to set stop loss every time because OKEX is a portfolio killer if you don't have any stop loss.
** if you cannot trailing stop bot, just uncheck the "Aggressive Strategy" in both strategy and alert to reduce alert to minimum level.

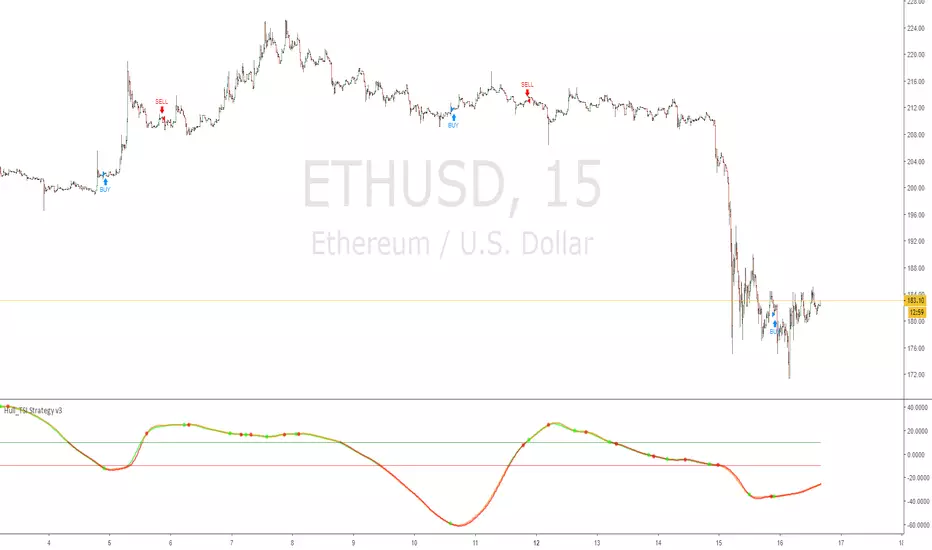
Hull_TSI Strategy v3True Strength Index, but Exponential Moving Average taken out and replaced with Hull Moving Average
this version uses 3 Hull MA's as well as the TSI value crossovers above or below the upper/lower lines
This version is the closest to the API bot featured at gekkoplus.com
Hull_TSI bot is competing in the competition
" Gekko Plus is hosting a strategy contest. Submit the best performing Gekko strategy and win 0.1 BTC! "
15 Nov 2018: Strategy contest start
10 Dec 2018: Strategy contest end
12 Dec 2018: Contest evaluation, announcement of winners!