Smart Bottom SignalThis indicator is used to find temporary bottoms that are validated with a subsequent candle that closes above the high. The indicator is based on elliott wave theory and tries to signal entries on wave lows. It triggers off of code from " TD D-Wave" 0, 2, 4, A, and C bull wave lows by finding a candle with a close higher that the high of the lowest wave candle or the high of a bullish candle that first breaks above the 8EMA. Green arrows will plot on close indicating that the indicator was triggered.
There are 3 options for display of plots provided:
ShowSmartSigs - This is defaulted to true (display) and allows users to toggle the green arrow alert plots on/off that appear below the candle when triggered.
ShowOnOffPlots - This is logic I use to signal a downturn/upturn and is indicated by red/green arrows appearing above the trigger candle.
ShowBounceSigs - This is defaulted to false and would show as an orange arrow under a candle where a bullish candle first climbs above the 8EMA when ShowOnOffPlots is signaling a downturn and SlowtSochastics is below 21. The SlowStochastics settings are adjustable on the settings screen and default to 21,3.
Alerts Available:
"Smart Buy Bounce" - This alert fires when the ShowSmartSigs signal is triggered.
"Buy Bounce" - This alert fires when the ShowBounceSigs signal is triggered.
"Turn Off Bots"/"Turn On Bots" - This alert fires when the ShowOnOffPlots signals are triggered. I use this to turn off shorter timeframe (15m-1H) bots during a prolonged price drop.
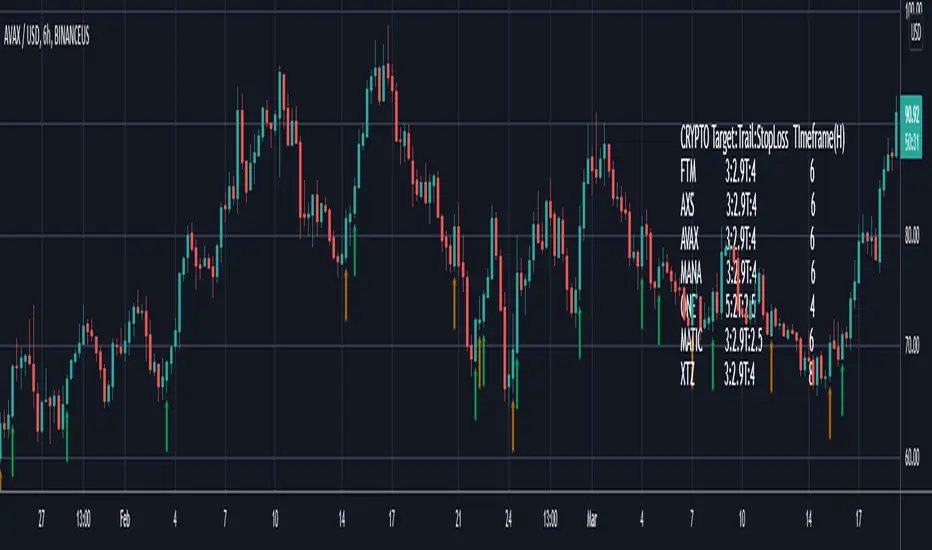
This is an early prototype that is filtered to the following tested cryptos against the specified chart timeframes and using the expressed target/trail/stoploss logic.
CRYPTO Target:Trail:StopLoss TImeframe(H)
FTM 3:2.9T:4 6
AXS 3:2.9T:4 6
AVAX 3:2.9T:4 6
MANA 3:2.9T:4 6
ONE 5:2T:2.5 4
MATIC 3:2.9T:2.5 6
XTZ 3:2.9T:4 8
스크립트에서 "bot"에 대해 찾기
TrendsThe Trends indicator is created for trend trading and (Bitsgap) crypto bots of crypto assets over longer time periods.
Works best for 4h, Daily and Weekly candles (even Monthly), but unsuitable for hourly candles and day trading.
This indicator shows you if a crypto pair is in a Bear, Bull or Sideways market.
The idea is to simplify decision making when to sell or buy, or what pairs to use with trading bots.
Stick to the rule of not having bots in a Bear trend!
- Blue = Bull trend
- Red = Bear trend
- Green = Sideways trend - which can be profitable with trading bots

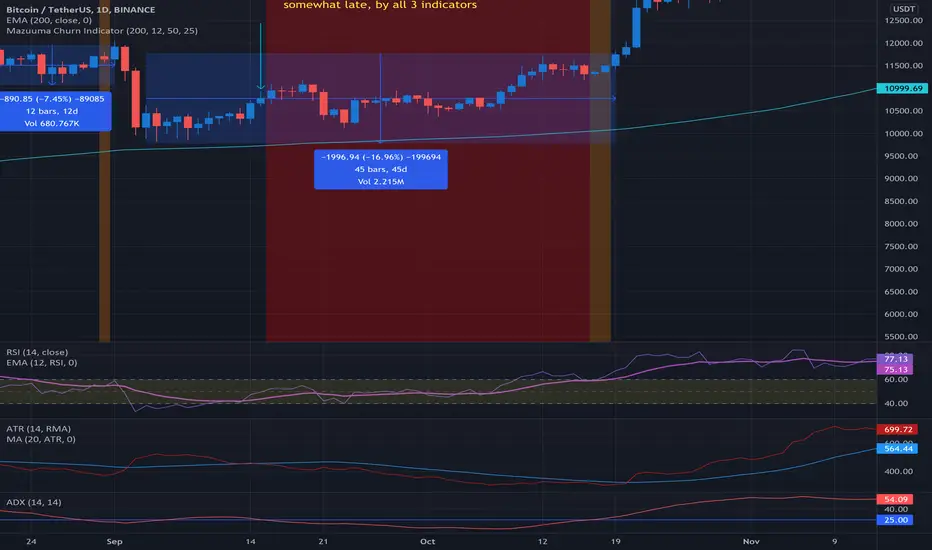
Mazuuma Churn IndicatorThis indicator was specifically made to confirm a periode of sideways movement (churn) on Bitcoin. It can probably be used for other cryptocurrencies as well. I use it on the daily timeframe.
Yellow means "Unconfirmed".
Orange means "Partially Confirmed".
Red means "Confirmed"
The indicator is not perfect, so use your common sense.
Churn starts when at least 2 of the conditions below are met (use also your common sense):
1. ATR < MA 20 on ATR
2. Distance to EMA 200 must be ≤ 16% at “Open churn”
3. EMA 12 on RSI between 40 and 60
4. ADX < 25
The above are weighted. Meaning no 1 has most significance. The numbers can be tweaked.
Reversal coming
* The indicators above break out, especially the ATR
* Color shift of the Heikin Ashi candle on weekly timeframe
* Engulfing candle on weekly timeframe
Because of the offset of the EMA 200, the precision of the Churn predictor can be off after a VERY big spike up or down, e.g. dec 2017. After such a spike use your common sense.
Personally I use this for bot trading, i.e. turn off trend following bots when in sideways market and use grid bots or other means of trading instead.
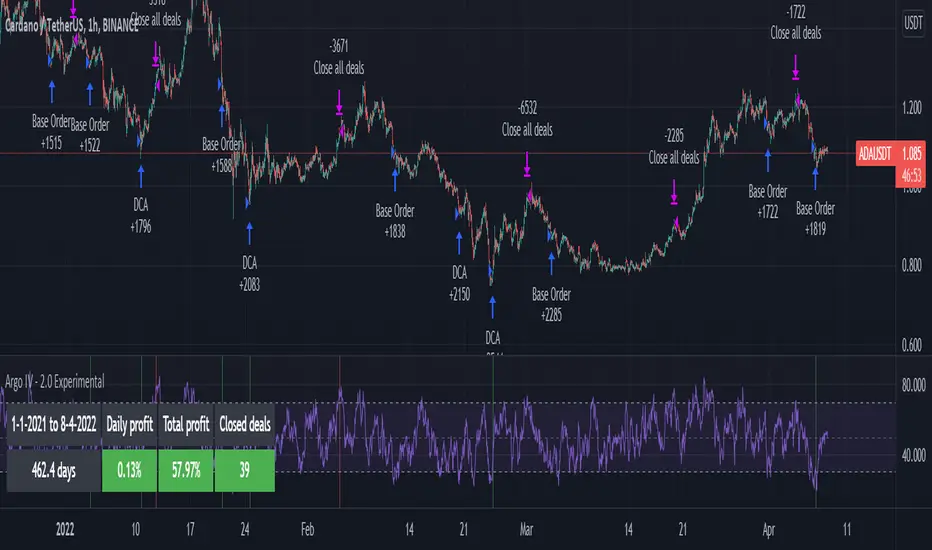
Argo IV - EXPERIMENTAL strategy for 3commas with alertsThis strategy lets users create BUY/SELL alerts for 3commas single bots in a simple way, based on a built in set of indicators that can be tweaked to work together or separately through the study settings. Indicators include Bollinger Bands , Williams %R , RSI , EMA , SMA , Market Cipher, Inverse Fisher Transform, RSI divergence.
It is based on the ARGO I study ( here ), with the following major differences:
- It uses pyramiding (see strategy "properties")
- It includes a lot of new options for deal start/close conditions for maximum control
- It doesn't require any external tool to backtest.
If the user choses to create both BUY and SELL signals from the study settings, the alert created will send both BUY and SELL signals for the selected pair. Note the script will only send alerts for the pair selected in the study settings, not for the current chart (if different).
Important : it is only an early experiment, I will only release the script when satisfied with performance. Until then, I advise not to use this for any real trading.
How to use:
- Add the script to the current chart
- Open the strategy settings , insert bot details. Pairs MUST be in capital letters or 3commas will not recognize them.
- Still in the settings, tweak the deal start/close conditions from various indicators until happy. The strategy will plot the entry / exit points on the chart
- When happy, right click on the "..." next to the study name, then "Add alert'".
- Under "Condition", on the second line, chose "Any alert () function call". Add the webhook from 3commas, give it a name, and "create".
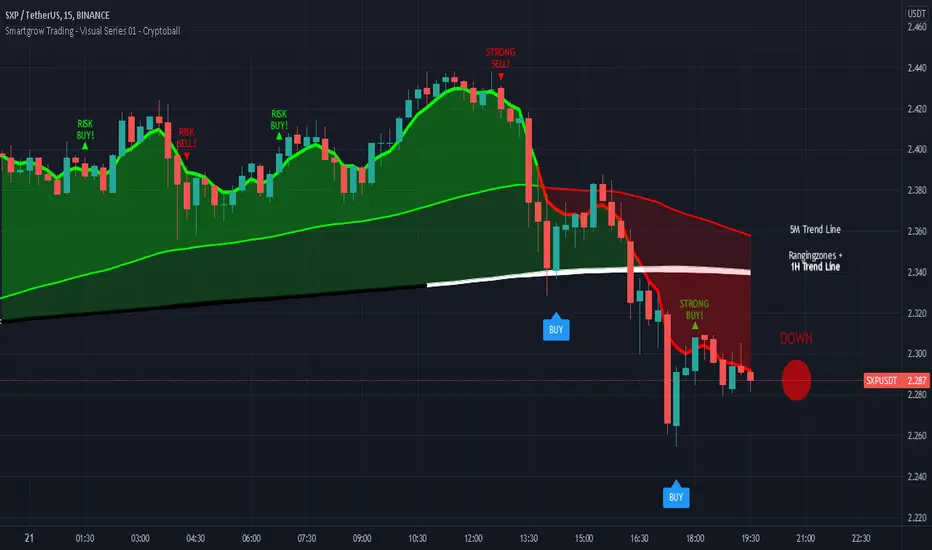
Smartgrow Trading - Visual Series - CryptoballWelcome to our Tradingview buy signal indicator with visual support.
We develop signals which have been specially developed for crypto trading bots. We will publish new indicators at regular intervals.
At the moment our all-in-one indicator includes the following indicators:
- "Crypto Bot Signal 01 - Optimized RSI Momentum"
- "Trading Bot Buy Signal 02 - MTF Stochastic"
- "Trading Bot Buy Signal 03 - MTF StochRSI"
- "Smartgrow Trading - Bearish Power Signals"
The basic idea of this all-in-one indicator is to decrease the needed number of alarms and to provide an all-in-one script for our users trading long direction only. We only include indicators which are relatively robust against false breakouts, even if these can of course never be avoided. These signals alone occur relatively rare, but you can set an alarm up on different pairs simultaneously. The strategy can only be used in 5 min chart and in crypto pairs. It wasnt tested in Forex etc. but feel free to test it.
The main idea behind the signals is to identify strong oversold areas as these have great potential to move in the other direction again. To determine this, we use custom oversold indicators to create buy signals. You could automate these buy signals but we suggest to use these instructions instead:
If an alarm is triggered it is showing points with a strong reversal chance for long signals. We recommend watching the chart closely and finding a good entry point. For visual support, we have visualized the basic trend in color on the one hand. If the 5 minute trend line is above the 1 hour trend line , then there is an upward trend which is marked with a corresponding note. If the 5 minute trend line is below the 1 hour trendline, then there is a downward trend. If you only want to look at the trend line of the 5 minute chart, deactivate the 1 hour trendline in the settings. When the 5 period Exponential Moving Average is higher then the 90 period Exponential Moving Average then the area between them is colored in green, otherwise in red. The same is the case when the 5 period Exponential Moving Average is higher then the 1 hour trendline.
As a second visual support, we have marked volatile zones in the market with the colors black and white. The color black generally denotes a market with low volatility and entry into these areas is therefore not recommended or involves risks. To show potential entry points based on market momentum we added note signs showing either buy or sell spots based on crossovers. If a crossover is within an area of low volatility we marked it as risk buy. if a crossover is within an area of higher volatility we marked it as a strong buy.
To find a good point to exit a trade we added also note signs showing possible sell spots. When these occure an crossover in momentum has allready occured and a potential trend reserval may occur. You could also use this indicator in combination with oversold indicators like RSI or Stochastic to see potential reversal spots when a market is oversold. As a last helper we implemented the Cryptoball on the right side of the chart to vizualize the currently price movement. Therefore it is looking only a few candles back to show you the smoothed price direction. When the color of the indicator is switching from green to red it is a sign that a smaller price drop may occure amd indicates a possible sell.
We sell this indicator so it is invite only. But of cause you can test the single indicators before buying.
If there are questions, write them into the comments or contact us directly over the direct message. Happy Trading!
[ADOL_]ARVIS 4 Whale
ENG) The fourth version of ARVIS BOT This is an upgraded version of ARVIS 4. ARVIS4 🐳(Whale)
- Lighten ARVIS 4 The ARVIS 4 is a bit heavy to compensate for the slow loading, and combines the standards of the new TD .
- By upgrading the coastline, the trend-following notation was changed to be legible, and the signal generation was processed as a background to make it simple.
- Sales statistics output has been added. It enters at the average of the opening and closing prices, and closes at the closing price. As it is liquidated at the closing price, when the bot is driven
It is possible to prevent the situation from entering the section where the signal appears and disappears.
principle)
Features of the new core logic:
- You can set an alert for the TD indicator that could not be set before. TD indicators are numbered 1-9 in Settings - Appearance.
- Setup: Numbers floating above (below) the candle, in ascending and descending order (=sequence) from 1 to 9. Compare with previous candles.
That principle is the part of reasoning that no one explains. I think regularity reflects the theory of the Fibonacci sequence.
The Fibonacci sequence is a number in the golden ratio that makes up nature.
option)
- The indicator plotting range indicates the range in which to display the indicator.
- Setting is for shoreline and breakwater, and is set to the optimum value. It can be used as a basis for support/resistance by breaking through shorelines and breakwaters.
- In Big Trend, the trend judgment standard and trend length are displayed. The trend judgment criteria and trend length based on ICHIMOKU determine the uptrend and the downtrend long.
"You can see the guide by hovering the mouse over ⓘ in the indicator."
- Volume above the average trading volume determines the power of the candle.
- Mark the flow of the stochastic on the candle. Added more filtering of the moving average by augmenting the existing one.
SMA , EMA , HMA , RMA , WMA , VWMA can be selected from the options.
- Added ARVIS 3 version of HTF signal. It is displayed with a light green and red background.
- Real long and real short are key signals. It is displayed on a dark green and red background.
- Fixed an error and signal location where the swing-based heart shot and heart long did not appear at the intersection.
- Super Swing has been added. SS is indicated along the trend direction by the square ( ■ ) at the top.
Principle of core function (Example of picture explanation)
time frame)
- Available in all timeframes.
alarm)
- You can set up alerts for setup, down long, up short, real long, real short, and heart.
trading method)
- Follow the signals Real Long🥝 Short🍅 , Heart Long💚 Short❤ It depends on the color of the background.
- After entering L and S, 9🎯 can be used as a split blade position.
- Follow the downtrend📈🛐 uphill short📉🛐 as the trend criterion. You can change the settings.
- When you select theme 1 in SC , you can use it like Heikin Ashi, and when you select theme 3, you can find overbought and oversold.
reference)
You are solely responsible for all trading decisions and investments you make.
How to use)
It is set to be available only to invited users. When invited, tap Add Indicator to Favorites at the bottom of the indicator.
If you click the indicator at the top of the chart screen and look at the left tab, there is a Favorites tab. Add an indicator by clicking the indicator name in the Favorites tab.
----------------------------------------------------------------------------------------------------------------------------------------------------------------------------------------------------------------
KOR) ARVIS BOT의 네번째 버전 ARVIS 4의 업그레이드 버전입니다. ARVIS4 🐳(Whale)
- ARVIS 4를 경량화합니다. ARVIS 4가 다소 무거워 로딩이 느려지는 부분을 보완하고, 새로운 TD의 기준을 결합합니다.
- 해안선을 업그레이드 하여 추세를 따르는 표기를 가독성 있게 변경하고, 시그널 발생을 배경으로 처리하여 심플하게 구성하였습니다.
- 매매통계 출력이 추가되었습니다. 시가와 종가의 평균으로 진입하며, 종가로 청산합니다. 종가로 청산하므로, 봇구동시
신호가 떴다가 사라지는 구간에 진입이 되버리는 사태를 방지할 수 있게 됩니다.
원리)
새로운 핵심적인 로직의 기능 :
- 기존에 설정할 수 없었던, TD지표의 얼러트를 설정할 수 있습니다. TD 지표는 설정 - 모습에서 1~9까지의 숫자로 나타납니다.
- 셋업 : 캔들위(아래)에 플로팅 되는 숫자로 1~9까지의 오름차순, 내림차순 (=시퀀스)으로 구성됩니다. 4개이전의 캔들과 비교합니다.
해당 원리는 아무도 설명해주지 않는 추론의 부분입니다. 규칙성에는 피보나치 수열의 이론이 반영되어 있다고 봅니다.
피보나치 수열이란 자연을 이루는 황금비율의 숫자로 1.1.2.3.5.8.13.21.34.55.89... n번째와 n+1번째 숫자의 합이 n+2번째가 됩니다.
옵션)
- 지표 플로팅 범위는 지표를 표시할 범위를 나타냅니다.
- Setting은 해안선과 방파제에 관한 설정이며, 최적값으로 설정되어 있습니다. 해안선과 방파제를 돌파, 지지/저항의 기준으로 활용가능합니다.
- Big Trend에서는 추세판단 기준과 추세길이가 표시됩니다. ICHIMOKU기반으로 만들어진 추세판단 기준과 추세길이는 오름숏과 내림롱을 결정합니다.
"지표내 ⓘ 위에 마우스를 올리면 안내를 볼 수 있습니다."
- 거래량 평균이상의 Volume을 캔들의 힘을 가려냅니다.
- 스토캐스틱의 흐름을 캔들에 표기합니다. 기존의 것을 보강하여 더 많은 이평선의 필터링을 추가하였습니다.
SMA , EMA , HMA , RMA, WMA , VWMA 를 옵션에서 선택가능합니다.
- ARVIS 3 버전의 HTF 시그널을 추가하였습니다. 옅은 초록색과 빨간색 배경으로 표시됩니다.
- 리얼 롱, 리얼숏은 핵심적인 시그널이 됩니다. 진한 초록색과 빨간색 배경으로 표시됩니다.
- 스윙 기준의 하트숏과 하트롱이 교차로 출현하지 못하는 오류와 신호 위치를 수정하였습니다.
- Super Swing이 추가되었습니다. SS는 상단의 스퀘어( ■ ) 로 추세 방향에 따라 표시됩니다.
핵심기능의 원리 그림 설명 예시)
타임프레임)
- 모든 시간프레임에서 사용가능합니다.
알람)
- 셋업과 내림롱, 오름숏, 리얼롱, 리얼숏, Heart 에 얼러트를 설정할 수 있습니다.
매매방법)
- Real Long🥝 Short🍅 , Heart Long💚 Short❤ 신호를 따르십시오. 배경의 색상에 따릅니다.
- L, S에 진입후 9🎯 을 분할 익절 자리로 활용할 수 있습니다.
- 내림롱📈🛐 오름숏📉🛐 을 추세 기준으로 따르십시오. 설정값을 변경할 수 있습니다.
- SC에서 테마1을 선택시 하이킨 아시 처럼 사용가능하며, 테마3을 선택시 과매수, 과매도를 찾을 수 있습니다.
참고)
귀하가 내리는 모든 거래 결정과 투자에 관한 것은 전적으로 귀하의 책임입니다.
사용방법)
초대된 사용자만 사용할 수 있도록 설정이 되어있습니다. 초대를 받을 경우, 지표 하단의 즐겨찾기에 인디케이터 넣기를 누릅니다.
차트화면 상단에 지표를 눌러서 왼쪽탭에 보면 즐겨찾기 탭이 있습니다. 즐겨찾기 탭에서 지표이름을 눌러서 지표를 추가합니다.

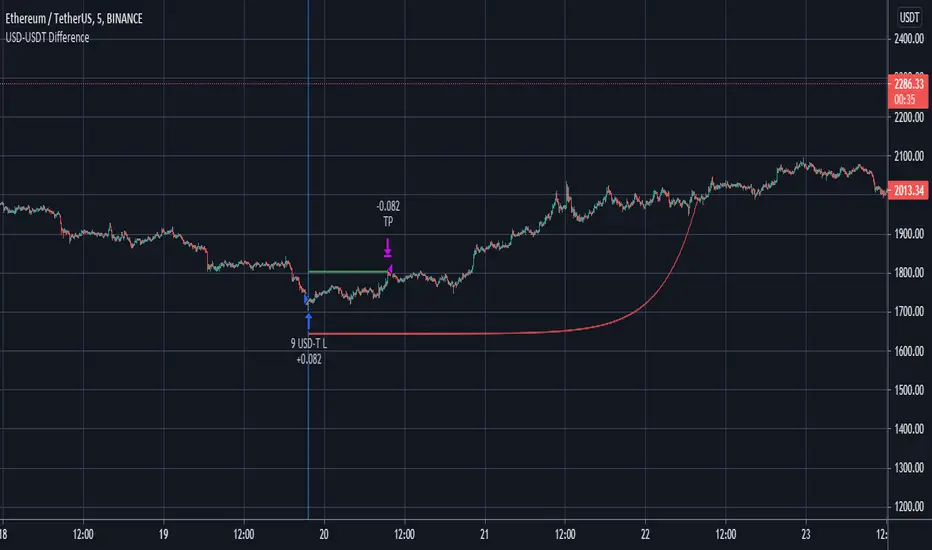
Futures Spot Difference Strategy by MoonFlag
This strategy compares the spot and futures value of a coin on a given exchange
If the 'Percent Difference' (See settings) is greater than a user specified ammount a blue (long) or green(short) line is put on the chart.
Default % difference typically varies from 0.2 to 0.7 depending on the coin and timeframe. On higher timeframes (1hour) a difference of 1.5% might be required to give good intermittent trade results.
I've chosen a USD-USDT comparison as default for ease of understanding. Note the futures coin goes onto the chart and the spot coin is referenced in settings. The bot works this way as the futures will typically extend beyond the spot price, not the other way around.
User can select if to include Long and/or Short trades.
The 'Trigger Only When Bar Complete' means that repainting should not be an issue if set to true. However, if set to false the strategy will enter a trade at the point in time when the percentage difference is met. This is useful with some coins as the futures coins price rapidly changes to realign with the spot price. It is however difficult to backtest this feature as backtests only consider the bar complete situation. I mostly use Trigger When Bar Complete = true, as a difference in the spot/ futures price is typically followed by a price shift trend over then next reasonable time period.
Timing is essential in this bot. There is a stop-loss however, this stop value is replaced by a exp ramp which has 3 variables (starting %, length, run-up). When the ramp is narrower to the price than the stop-loss the ramp takes over the stop-loss and this reduces losses. Also, there is an option to have the ramp take over the take-profit if the ramp betters the start-price (i.e. the trade is in profit). This is very useful for times when the price massively swings beyond the take-profit price as the exp ramp goes way up. The ramp also limits the time a trade will stay in position, unless the trades moves in tandem with the ramp. The ramp is the most useful feature I have for bots, I use it all the time.
So a difference between the spot and futures price - can lead to a trend establishing, so catch these with this bot. It works well on fast timeframes, 1m, 5m, 15m, and also is useful with the 1hour and similar.
Please get in touch to have this bot matched to any coin pair
Please do get in touch if you have any questions/suggestions.
Sincerely,
MoonFlag PhD
Multi VWAPMulti VWAP indicator for Wick Hunter
For when you are running out of indicator slots
Can configure each set for Setting 1/2/3, or for Binance bot 1/Binance bot 2/Bybit bot, etc.
By honeybadger, built on original code by STP Todd (see indicator "Wick Hunter VWAP")

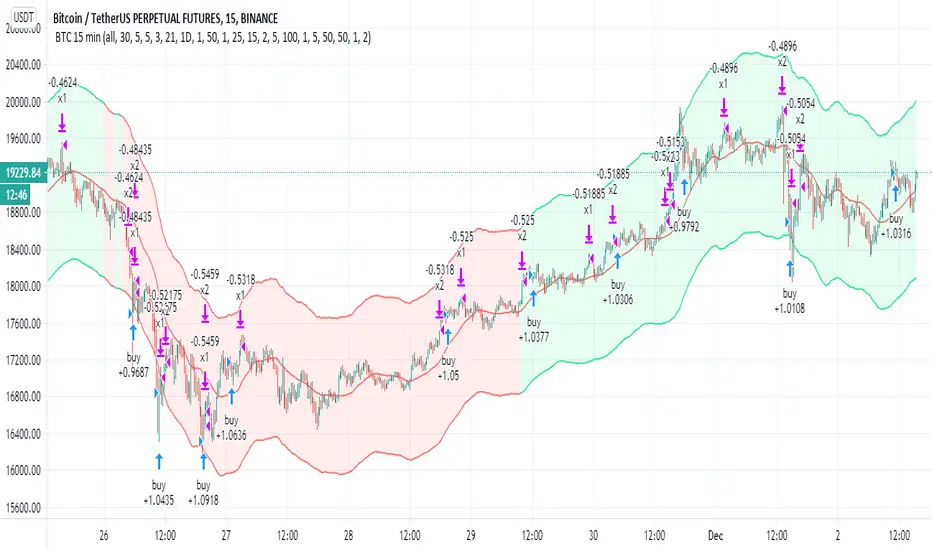
BTC 15 minThis strategy try to catch the uptrend mainly (seems to work on BTC 15 less on others)
the aim is to get 2% in uptrend which is more easy to do then to search only for lowest
since it buy in uptrend it can risky if market change direction
there are two take profit (1% and 2% ) , you take out 50% of equity after the first 1% gain
the stop loss and re buy set 5%
so you exit after 5 % loss and re buy it again at lower price
the aim here is to do leverage trades so you can calculate your risk or lot and the leverage power you want
now set on 100% lot leverage X1
you can try any combination you want but when you do leverage trading you need to do things that the back tester of TV cannot do so well
for example if you put 100X leverage you will be liquidated at 1%
50=2%
20=5%
10=10%
5=20%
you need that your stop loss will be above the liquidation level
stop loss are shit in margin trades as they can kick you out very fast and you will lose many good trades
so I prefer 5X max 10 X trade (this bot can work by himself but i prefer to do it manually for this kind of trades.
all u need to do is to choose what risk you want to have (3% of lot? 5%, 10% or higher )
so this tool try to give you upward buy strategy that aim to get longs at upward trends (short targets that are more easy to get )
and to use leverage as way to make more profit (now bot set to no leverage )
be wise with your money :)
the bot not suppose to repaint but if you find repaint issue then let me know
buy system is based on cross of linear over modified non repainted HMA that set to 1 min (so it buy the uptrend only+ filter based on ema that try not to start cycle of buy in down traade
sell is not so important is mainly cased on percentage channel seen
trend color on Chanel not related to the buy and sell system
Theft Indicator - BUY/SELL AlertsWhat is our indicator?
Theft Indicator - Buy & Sell Alert System is our first published script that shows price action on a certain period of time (We Use ATR indicator). We take pride in enabling trading to become easier for the experienced and the non-experienced traders around the globe. Buy & Sell alerts will be fired once a conditions in our algo is met.
Does it Repaint?
Our indicator does NOT re-paint. Although while setting an alert it may pop up the repaint alert, please take into consideration that once a signal is fired on a "CLOSED BAR", our signal will never disappear, they do not repaint.
What Markets is it usable with?
You can use it in any market, Forex, Stocks, Crypto, Indices. We recommend high time frames but you can also use it on the 1 minute chart if you are a scalper and a risk taker. All time frames are profitable, not all trades. But the Majority is profitable. We will soon add a backtest strategy for it, there is no ETA on it tho.
How to use:
Simple plug and play it to your chart, in addition to a few other indicators we will recommend to you (we still have not published them yet), and this will confirm your trades. You can also connect TV alerts with a bot and let it run. Please be aware that SLIPPAGE time is important, If you run a bot on this indicator you HAVE to know that the buy/sell price will be on the bar AFTER the Candle close (For example: the BUY/SELL alert is on a candle, the buy/sell your bot or you will execute WILL be in the following candle depending on your trading system. Theft Indicator - Buy/Sell Alerts work best with higher time frames, however it works on smaller time frames, we recommend 15 mins, 30 mins, 1hr, 4hr. It just depends on your trading style. Please contact us if you do not understand how to use it.
How are the Buy/Sell Alerts fired?
We use the simple ATR (Average True Range) indicator. However we have modified the indicator to fit our trading system. Check below for a definition of what ATR is:
What is Average True Range - ATR?
The average true range (ATR) is a technical analysis indicator that measures market volatility by decomposing the entire range of an asset price for that period. Specifically, ATR is a measure of volatility introduced by market technician J. Welles Wilder Jr. The true range indicator is taken as the greatest of the following: current high less the current low; the absolute value of the current high less the previous close; and the absolute value of the current low less the previous close. The average true range is then a moving average, generally using 14 days, of the true ranges.
Why is our indicator special and different from the normal ATR indicators?
We have modified the mathematical equation and changed it slightly to give more accurate signals, we do not promise all trades are profitable, the use of this indicator is up to your own judgement and liability. We believe that we have an indicator like no other ATR because of our algo that is different from the normal ATR calculation.
P.S: This is not financial advice, we are just sharing our indicator that we know has good results, and it will take time for people in -ve profiles to recover losses and for the profiting to be more profitable.
You can contact me for more information about the indicator, Goodluck :)

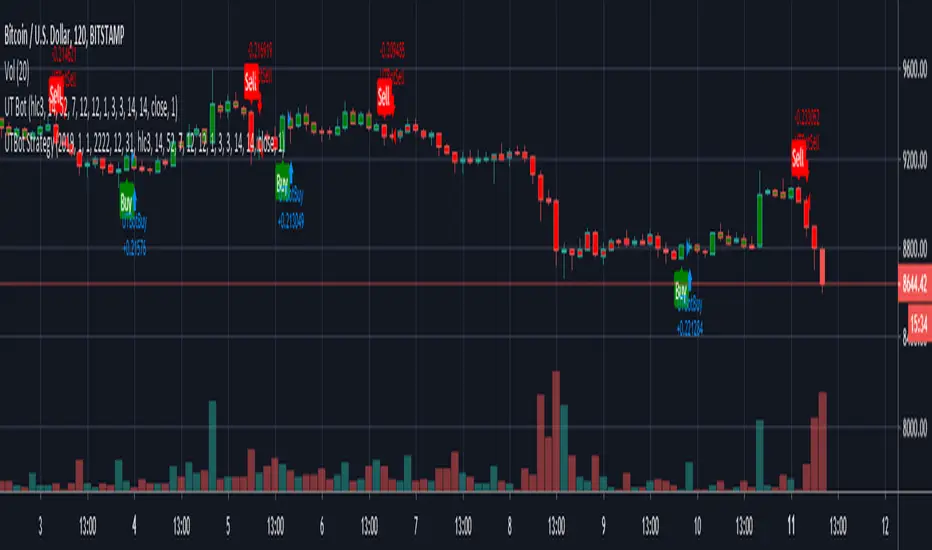
Kirk65 UTBot Strategy FixedCredits to @HPotter for the orginal code.
Credits to @Yo_adriiiiaan for recently publishing the UT Bot study based on the original code.
Credits to @TradersAITradingPlans for making UT Bot strategy.
Strategy fixed with time period by Kirk65.
UT Bot works great with 2 hour time frame with Heikin Ashi, but riskier. Use "Once per bar" In alerts with 1.5% stoploss. If the price goes against Alerts, stoploss will save your assets. Wait until next Alert.
4 hour time frame is less risky and less profitable.
Happy trading..
Kirk65
DayTrade - XBTUSD 5m [ALERTSETUP]Plug & Play indicator for BITMEX:XBTUSD in 5 minute timeframe for Manual or Automated Day Trading.
Built upon Cyatophilum Scalping Bot
Backtest below show results over 2 weeks, calculated with a 0.075 % commission fee and using 100% of equity on each trade from 10 000$ inital capital.
> Get access to the Cyatophilum Indicators <
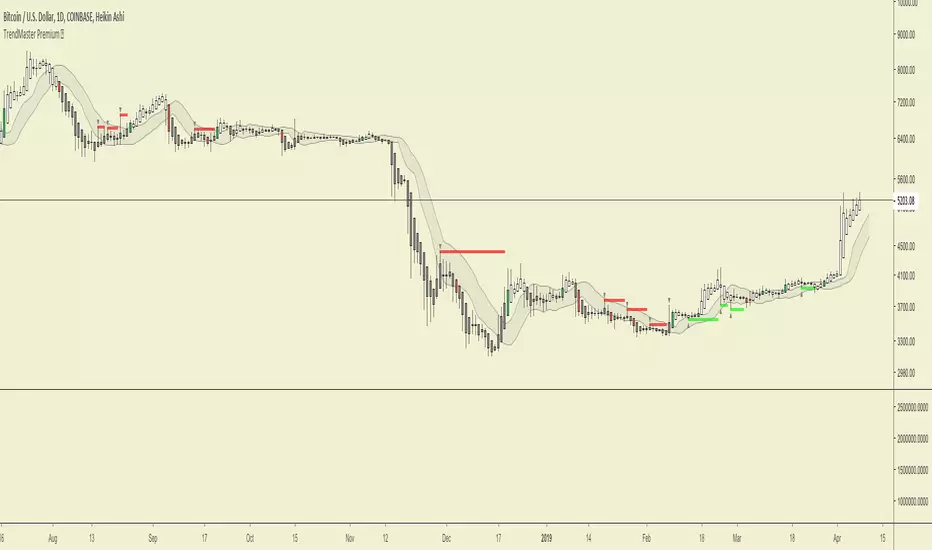
Trends in Black and White'Trends in Black and White' is now rolling out to all of our Pro Community members
What is it for? This is a simple visual indicator designed to help users identify long or short bias. It does not provide direct entries and exits but can be used effectively in combination with Trendmaster Premium and other technical analysis methods.
How do i get access?
This indicator is available as a free extra to all of our Pro community members only.
All of our packages are listed below.
- Premium - $50 - This gives you access to the TrendMaster Premium TradingView indicator (www.tradingview.com), the TrendMaster Premium Binance signal bots and the Premium Discord channels.
- Premium+ - $75 or $25 for existing Premium users - All the benefits of the Premium package, but with added signal bots for Bittrex, Bitfinex and Kucoin exchanges.
- Pro - $100 or $50 for existing Premium users/$25 for existing Premium+ users -Access to 'Trendmaster Premium' and 'Trends in Black and White' indicators. All the benefits of the Premium+ package, but with added signal bots for D1 and H4 Ichimoku TK cross and Ichimoku cloud breakout for Binance.
The mandatory Legal bit:
@IchimokuScholar and @Crypto_C00kie wish you the best of luck in achieving your trading goals. Please apply appropriate risk management.
Any form of trading has large potential rewards but also large potential risks. The Purchaser must be aware of those risks and be willing to accept them. Don't trade with money that you, the Purchaser cannot afford to lose. No representation is being made that you are guaranteed positive results. The past performance of any trading methodology is not necessarily indicative of future results. Trading involves high risks. @TrendmasterTM, @IchimokuScholar or @Crypto_C00kie are NOT responsible for any trades that you, the Purchaser take. All trades taken are entirely at the Purchasers own risk. Refunds are neither offered nor implied.

inwCoin BB+Stoch StrategyStrategy using BB and Stoch for entry, trailing for exit.
-------
IDEA
-------
* If price move to reach upper BB and pull back and cross down middle line, and stoch is on OB zone, it will enter short.
* If price move to reach lower BB and pull back and cross up middle line, and stoch is on OS zone, it will enter long.
* Stoch help filter out the bad entry from BB logic, helping with high win trade %
* I smooth out stoch by using 30 length and found out it give better profit%
=============================================
Test Data Detail
=============================================
Exchange : OKEX
Coin : BTCUSD3M
Timeframe : 1H
Date range : 2018/1/1 - 2019/1
For : Trailing with bot ( If you have one :P )
Config
Trade % = 20 ( You can increase trade size of your total port but it will get you into more risky trade. ( but yes, more profit ) ... u can increase trade size if you have enough profit
Trailing Start = 20 ( If you can write bot, it will start trailing when the profit % reach this value )
Trailing Stop = 5 (If you can write bot, it will take profit if the profit drop below this value from trailing start.)
Take Profit = 100 (It will set fixed TP for whipsaw case ( rarely reach this target ) )
Stop % = 50 ( so this trade is RR = 2 nice! )
Leverage = 20 ( so we can withstand the price fluctuation and not get liquidated, if you trade spot, please choose 1 also, please adjust TP and stop accordingly eg. leverage 1 / TP = 20 / SL = 10 )
Trade Direction = Both ( for margin market, if you want to trade spot like Binance you can choose long only )
Stoch Oversold Zone = 30 ( if stoch stay below or equal this value, it is oversold )
Stoch Overbought Zone = 50 ( if stoch stay above or equal this value, it is overbought )
Stoch Length = 30 ( the more length, the more smooth out of Stoch )
SmoothK1 = 1 ( the smoothness of K )

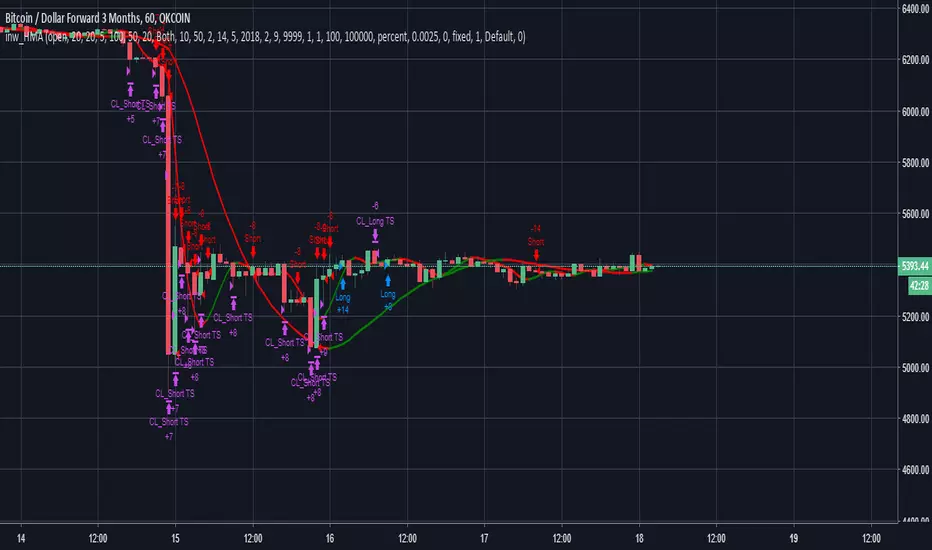
inwCoin HMA StrategySuper duper strategy using HMA ( Hull Moving Average ) 10 and 50 for decided entry ( short / long )
There are 2 type of strategies, you can choose with checkbox.
(1) Aggressive Strategy Ticked
* If ticked, strategy will enter position again if the condition met. ( both line red ) after Taking Profit ( or Stop Loss )
* It will use trailing start/stop so the profit is kinda crazy ( and yes, impossible in real world lol )
* The problem is, it will enter position like crazy and you might get a lot of loss from fee
(2) Aggressive Strategy not Ticked
* It will enter once only ( HMA10 just changed color to the same as HMA50 )
* If TP or SL already, it will wait for next signal
* Less trade, less profit, but safer. ( wait for right signal )
** For Aggressive Strategy, you can't select the date from 1/1/2018 because the trade record is way too much .... lol
** You can experiment yourself with other exchange/coin as your like.
=============================================
Test Data Detail
=============================================
Exchange : OKEX
Coin : BTCUSD3M
Timeframe : 1H
Date range : 2018/2/9 - 2019/1
For : Trailing with bot ( If you have one :P )
Config
Trade % = 20 ( You can increase trade size of your total port but it will get you into more risky trade. ( but yes, more profit ) ... u can increase trade size if you have enough profit
Trailing Start = 20 ( If you can write bot, it will start trailing when the profit % reach this value )
Trailing Stop = 5 (If you can write bot, it will take profit if the profit drop below this value from trailing start.)
Take Profit = It will set fixed TP for whipsaw case ( rarely reach this target )
Stop % = 50 ( so this trade is RR = 2 nice! )
Leverage = 20 ( so we can withstand the price fluctuation and not get liquidated, if you trade spot, please choose 1 also, please adjust TP and stop accordingly eg. leverage 1 / TP = 20 / SL = 10 )
Trade Direction = Both ( for margin market, if you want to trade spot like Binance you can choose long only )
Hull 1 Length = 10 ( Fast HMA length)
Hull 2 Length = 50 ( Slow HMA length)
Hull trend test length = 2 ( hull test range for rising or down trend )
Aggressive Strategy = YES ( enter next position if condition met immediately )
Strategy - Bobo's Pivot ATR SwingHi there, welcome to my pivot ATR swing bot. I put this out there with source code hidden to see what ideas others have to use it. Also if there are any coders of trading systems out there who wanted to work with me to put this into a form that could trade automatically we could both use... I'd welcome that kind of collaboration and will happily share the underlying rules of this and the more highly developed version that isn't public.
But as it is, the signals are free for all, use them as you wish and at your own risk. If you want to discuss the code, strategy or ideas, I'm around fairly regularly just message.
The bot is fairly simple design that will give you signals for long and short intraday/week on equity futures / CFDs / ETFs. You'll see it backtests fairly well on an hourly SPX500 chart as configured. You will need to set up certain parameters to account for any different timeframes and markets you wish to trade. For me it's most effective pick out a few good swing trades per week in equity futures. However part of the idea of putting this in the public domain is to see if other people will have good but different ideas how to use it. Please share with me if so :).
The basic concept is a series of 3 lines that define the area and movement we wish to trade. The daily pivot is the central line (blue). We are looking to capture reversions to this middle line from extremes (red and green). Therefore the bot will signal exit at the close of every candle that has passed through the pivot.
Entry is decided by the outer bands around the blue line. Red is the top band, green the bottom. As configured, these are simply placed a daily ATR value apart, centred around the pivot. You can change this quite a lot though, so let's go through the settings:
Pivot Timeframe - simple, a daily pivot is calculated from the previous day's values (high + low + close)/3 . BUt the same calculation can be applied to any length candle, day, minute, month or whatever. This makes the middle target line more or less responsive to recent price action.
ATR Band Timeframe - When we calculate the average range, we need to know what candle length makes up our series. Daily candles is the default, but you can change that here.
ATR Lookback - When we calculate the average range, we need to know how many instances of the timeframe (day, minute, hour etc) we look back to create an average. The lower the lookback value, the more the width of the bands (the distance from pivot) will change quickly based on the volatility of previous candles. The higher the lookback value, the more stable the band width will be to recent volatility.
ATR divisor - The ATR value above is divided by this value, before being added or subtracted to the pivot to create the red and green lines. Default value is 2, and this means the distance from the red band to the green band will be equal to 1 ATR, as calculated according to the parameters above. Setting this to 1 would mean that each band is one ATR away from pivot (ie the bands got wider apart). Set this to 4, and it means that it is only 1/2 an ATR from green to red.
Take Profit / Stop Loss. - We know what a stop and profit target are, but worth nothing that a 0 value disables stop loss or profit targets. The bot will still close positions when crossing pivot.
Also, note the mintick value of the instrument you apply this to. For example for the CFD chart SPX500 the mintick value is 0.1. So a 100 value for stop loss = 10 points on SPX500. but if you were to trade the same thing basically, but the emini future ES, the mintick value is 0.25. So for a 10 point stop on the ES chart, you would need a value of 40 in this bot. US30 and YM have convenient mintick values of 1. Currencies can be a bit of a nightmare :).

TrendMaster Premium ©Trendmaster Premium©
We are proud to release the final version of Trendmaster Premium©. This indicator is the result of months of development between @TrendmasterTM and @Crypto_C00kie.
Trendmaster Premium© is a Trend following system that provide entries, exits and stop loss placement. It is extremely simple to follow and we have experienced outstanding results.
When purchasing Trendmaster Premium© you will receive access to the indicator suite and access to our private members discord group.
Discord: The discord channel is a place where traders can discuss ideas and share content.
It includes
Bots – The discord channel currently has two bots that constantly scan Binance for signals. They will alert you by notification of any BTC pair that has printed a signal candle. Currently the bots report D1 and H4 signals as these are the time frames the indicator is designed for. These are designed to alert you to possible trades and should NOT be blindly traded from.
Chat – Several chat servers offering educational resources, guidance on how to use the indicator and chart/idea sharing.
The mandatory Legal bit:
@IchimokuScholar and @Crypto_C00kie wish you the best of luck in achieving your trading goals. Please apply appropriate risk management.
Any form of trading has large potential rewards but also large potential risks. The Purchaser must be aware of those risks and be willing to accept them. Don't trade with money that you, the Purchaser cannot afford to lose. No representation is being made that you are guaranteed positive results. The past performance of any trading methodology is not necessarily indicative of future results. Trading involves high risks. Neither @TrendmasterTM or @Crypto_C00kie are responsible for any trades that you, the Purchaser take. All trades taken are entirely at the Purchasers own risk. Refunds are neither offered nor implied.
Study_v8- Used with Autoview… Longs / Margin TradingInvite only…
FREE Access until my bot is built (Target Date…. May 2018).
Only allowing 20 people to use.
Cost will be 10% of any profits made. Minimum account balance being traded must be $1,000.
After my bot is built, this script will ONLY be used with my bot and all access on here (Trading View) will be removed after the final sell trigger is completed!
****Can be used for just Longs.. or for Margin Trading.****
For Longs only.. Settings and Alert condition examples found here:
drive.google.com
For Margin trading... Settings and Alert condition examples found here:
drive.google.com

Strat_v8 - Used with Autoview… Longs / Margin TradingInvite only…
FREE Access until my bot is built (Target Date…. May 2018).
Only allowing 20 people to use.
Cost will be 10% of any profits made. Minimum account balance being traded must be $1,000.
After my bot is built, this script will ONLY be used with my bot and all access on here (Trading View) will be removed after the final sell trigger is completed!
****Can be used for just Longs.. or for Margin Trading.****
For Longs only.. Settings and Alert condition examples found here:
drive.google.com
For Margin trading... Settings and Alert condition examples found here:
drive.google.com

Accurate CCT System [rurubudong]Overview
The CCT (Consecutive Candle Trading) Bot is a powerful Price Action trading indicator that identifies high-probability trade setups based on consecutive bullish or bearish candles breaking key levels on higher timeframes.
This system helps traders:
✅ Identify strong momentum setups automatically
✅ Enter at institutional price levels (POI - Point of Interest)
✅ Trade with clear structure and confluence
✅ Avoid emotional decision-making with systematic signals
📊 How It Works
CCT Pattern Requirements
The indicator detects CCT setups when:
Two consecutive bullish candles on the higher timeframe (default 1H)
The second candle closes above the high of the first candle
A Point of Interest (POI) is created at the first candle’s high
For bearish setups, the logic reverses:
Two consecutive bearish candles
Second candle closes below the low of the first
POI created at the first candle’s low
Entry System
Entry Signal: Price crosses the POI level on lower timeframe (▲ for long, ▼ for short)
POI Validity: 90 minutes from CCT confirmation (adjustable in Premium)
Entry Mode: Cross-bar entry (previous bar touches, current bar crosses)
🆓 FREE Version Features
Core Functionality
✅ Automatic CCT Detection (1-hour timeframe)
✅ POI Lines - Visual horizontal lines showing entry zones
✅ CCT Confirmation Labels - “CCT✓” marks when pattern confirms
✅ Entry Signals - Clear ▲/▼ arrows when POI is crossed
✅ Historical Mode - Display all past CCT setups for backtesting
✅ Clean Interface - No clutter, just essential signals
Settings
CCT Timeframe: Fixed at 60 minutes
Entry Mode: Cross-bar entry
Max Entries: 1 per POI
POI Validity: 90 minutes
Perfect for: Beginners learning Price Action, traders who want simple clean signals, anyone testing the CCT methodology
💎 PREMIUM Version - Full Trading System
Advanced Features
🎯 Pending POI Detection - Gray dashed lines show potential setups BEFORE they confirm
📊 Stop Loss & Take Profit Visualization - Automatic SL/TP lines with trailing stops
🔧 Full Customization - Adjust ALL timeframes, periods, and modes
🔄 Multiple Entries - Up to 3 entries per POI for scaling in
⚡ Advanced Entry Modes - Cross-bar / Same-bar / Both required
🎚️ Two POI Modes - “Touch & Stop” or “Time Limited”
📈 Two-Stage TP System - TP1 at 50% (swing high/low) + TP2 with trailing stop
🎨 Complete Info Panel - 17 data points showing live trade status
🔔 JSON Alert System - Full webhook support for automation (Entry, TP1, TP2, SL)
🎭 Visual Feedback - Background colors showing CCT state, position status
⚙️ Dual SL Types - CCT Candle or Entry Swing based
Premium Settings Include
Any CCT Timeframe - 5m, 15m, 1H, 4H, Daily, etc.
Custom POI Duration - 10 to 300 minutes
Swing Periods - Customize SL, TP, and Trailing periods
SL Offset - Add buffer ticks to avoid stop hunting
Max 3 Entries - Scale into positions
All Colors Customizable
Info Panel (Premium Only)
Real-time display showing:
Current timeframes
POI status (None / Pending / Confirmed / Touched)
Exact POI price
Stop Loss level
Take Profit 1 & 2 levels (✓ marks when hit)
Entry count (e.g., “2/3”)
Position status (Active / None)
Trade outcome (TP1 50% / TP2 / Stop Loss)
🎓 Trading Strategy
Recommended Usage
Timeframe: Use 1-minute or 5-minute charts for entries
CCT Detection: Keep at 1-hour (or customize in Premium)
Risk Management:
Premium users: Use the automatic SL visualization
Free users: Manually set SL below/above CCT setup candles
Targets:
Premium: Automatic TP1 (50%) and TP2 (trailing)
Free: Take profit at recent swing highs/lows
Best Practices
✅ Trade in the direction of higher timeframe trend
✅ Look for CCT setups at key support/resistance levels
✅ Combine with volume confirmation
✅ Avoid trading during low liquidity periods
✅ Use proper position sizing (1-2% risk per trade)
📋 Display Modes
Active POI Mode (Default)
Shows only the current active POI line
Updates continuously as new setups form
Clean chart with minimal visual noise
Historical CCT Mode
Displays ALL past CCT setups
Great for backtesting the strategy
See historical win rates and patterns
Fixed POI length for clean visualization
⚙️ Settings Guide
FREE Version
Show CCT Labels: Toggle “CCT✓” markers
Show All Historical CCT: Enable to see past setups
Show POI Lines: Toggle POI horizontal lines
Show Entry Signals: Toggle ▲/▼ entry arrows
Colors: Customize CCT and POI colors
Historical POI Length: Adjust visual length (5-20 bars)
PREMIUM Version (Additional)
CCT Detection Timeframe: Choose any TF
POI Extension Mode: Touch & Stop vs Time Limited
Entry Cross Mode: Cross-bar / Same-bar / Both
Max Entries per POI: 1-10 entries
SL Type: CCT Candle or Entry Swing
All Swing Periods: Customize SL, TP1, TP2 calculations
SL Offset: Add tick buffer to stop loss
Show Pending POI: Gray dashed line before confirmation
Show SL/TP Lines: Visual risk management
CCT Background: Color coding for market state
Complete Alert System: JSON webhooks for automation
🔔 Alert System (Premium Only)
Available Alerts
CCT Bull Confirmed - New long setup confirmed
CCT Bear Confirmed - New short setup confirmed
Long Entry - Entered long position at POI
Short Entry - Entered short position at POI
Long TP1 - 50% take profit hit
Short TP1 - 50% take profit hit
Long TP2 - Final target hit (trailing stop)
Short TP2 - Final target hit (trailing stop)
Long Stop Loss - Stop loss triggered
Short Stop Loss - Stop loss triggered
JSON Format (Webhook Compatible)
Entry Alert Example:
{
"signal": "long",
"entry": "21245.50",
"time": "2025-01-25T10:30:00Z",
"ticker": "NQ1!"
}
TP Alert Example:
{
"signal": "tp1_hit_long",
"close_pct": 50,
"rule": "round_up",
"price": "21280.75"
}
Perfect for connecting to trading bots, Discord/Telegram notifications, or automated execution platforms.
📈 Performance Optimization
Backtesting Tips
Enable “Show All Historical CCT” mode
Replay historical data to see how setups performed
Note the POI lines and entry arrows
Track win rate and average R:R
Adjust timeframes if needed (Premium)
Live Trading
Start with small position sizes
Verify each setup matches your strategy rules
Use proper risk management
Keep a trading journal
Track statistics over 20+ trades minimum
❓ FAQ
Q: What instruments work best?
A: Futures (NQ, ES, YM), Forex majors, and liquid crypto pairs
Q: What’s the difference between Free and Premium?
A: Free gives you core CCT detection and basic signals. Premium adds pending detection, SL/TP visualization, full customization, multiple entries, and automation alerts.
Q: Can I use this for scalping?
A: Yes! Use 1-minute chart with 60-minute CCT detection for quick trades
Q: Do I need Premium for profitable trading?
A: No, the Free version contains the complete CCT methodology. Premium adds convenience, automation, and advanced risk management tools.
Q: How do I set stop losses in Free version?
A: Manually place stops below/above the CCT setup candles. Premium users get automatic SL lines.
Q: Can I backtest this?
A: Yes! Use “Show All Historical CCT” mode and TradingView’s bar replay feature
🚀 Get Started
Add to Chart - Click “Add to favorites” or apply directly
Choose Your Display - Active POI or Historical mode
Customize Colors - Make it match your theme
Start Learning - Watch for CCT✓ labels and POI lines
Upgrade When Ready - Get Premium for full automation
📞 Support & Updates
Questions? Comment below or message me directly
Feature Requests? Let me know what would help your trading
Updates - Indicator is actively maintained and improved
⚠️ Disclaimer
This indicator is for educational purposes only. Past performance does not guarantee future results. Always practice proper risk management and never risk more than you can afford to lose. Trading carries substantial risk of loss.
Upgrade to Premium:
💬 Questions or feedback? Drop a comment below!
🌟 If this indicator helps your trading, please leave a review!

Apex Adaptive RSIThe Apex Adaptive RSI is a next-generation momentum oscillator designed to solve the "lag vs. noise" problem found in traditional indicators. By utilizing an Efficiency Ratio (ER), the script dynamically adjusts its sensitivity based on current market volatility.
How it Works: Unlike a standard RSI that uses a fixed period (e.g., 14), the Apex Engine calculates the "Efficiency" of price action. In trending markets, it speeds up to catch entries early; in choppy or sideways markets, it slows down to filter out false signals. This is then smoothed using Volatility-Adjusted Heikin Ashi candles to provide a clear visual of momentum strength.
Key Features: The Apex Adaptive RSI is a high-performance momentum oscillator that replaces traditional static RSI logic with an Efficiency Ratio (ER) engine. It dynamically scales its sensitivity—speeding up to catch trend breakouts and slowing down to filter out noise during market consolidation.
Visual Guide & Features:
1. The Apex Heikin Ashi Candles Instead of a single line, momentum is visualized through HA candles.
Bright Colors (Neon Green/Red): High-velocity momentum.
Dark Colors: Waning momentum or consolidation.
Wicks: Show the "reach" of RSI before the internal smoothing takes over.
2. The Volatility Cloud (Purple Shaded Area) This is your "Market Safety Zone."
The Cloud: Represents 2 standard deviations of RSI movement.
The Logic: When the RSI candles exit this cloud, the market is in an extreme state. Divergences that occur outside or at the edge of this cloud are statistically much more likely to result in significant reversals.
3. TOP & BOT Triangles (Labels)
TOP (Red Triangle): Marks a confirmed Pivot High in momentum.
BOT (Lime Triangle): Marks a confirmed Pivot Low in momentum.
These labels appear once the "Pivot Strength" (lookback) is satisfied, confirming a structural turning point.
4. TM & BM Dots (The Apex Markers)
TM (Top Marker - Red Circle): The exact "ceiling" of an RSI pulse.
BM (Bottom Marker - Green Circle): The exact "floor" of an RSI pulse.
Trading Tip: Use these dots to draw manual trendlines or to identify "Liquidity Grabs" (where price breaks a high but the TM dot remains lower than the previous peak).
5. Divergence Lines (Customizable)
Solid Lines (Regular Divergence): Indicates a potential trend reversal.
Dashed/Dotted Lines (Hidden Divergence): Indicates trend continuation.
Historical Memory: The script retains these lines on your chart for backtesting and structural analysis.
Unified Alert System:
The script includes a "Any Divergence" alert. This allows you to set a single notification for your ticker that triggers for all four types of signals (Reg Bull, Hid Bull, Reg Bear, Hid Bear) on the close of the confirmation bar.
Adaptive Sensitivity: Automatically scales between fast and slow periods based on market speed.
Heikin Ashi RSI Candles: Integrated "Apex Candles" that change color based on momentum velocity, making trend shifts easy to spot.
Unified Divergence Engine: Automatically detects and plots Regular (Reversal) and Hidden (Continuation) divergences.
Historical Backtesting: Divergence lines remain on the chart, allowing for thorough historical analysis.
Volatility Bands: Real-time statistical "Guardrails" (Bollinger-style) that identify extreme overbought and oversold conditions.
Smart Alerts: A unified "Any Divergence" alert that notifies you the moment a signal is confirmed.
How to Trade:
Reversals: Look for Regular Divergence when the RSI is outside the Volatility Bands.
Trend Following: Use Hidden Divergence (dashed lines) as high-probability entries in an existing trend.
Momentum: Watch the Apex Candle colors; a shift from dark to bright green/red indicates a "Pulse" in momentum.
Enjoy
Cemmec

Pitchfork Long Strat x Mizar🎯 Advanced DCA Strategy with Nadaraya-Watson Envelope for Mizar Integration
This strategy combines the sophisticated Nadaraya-Watson kernel regression indicator with an intelligent DCA (Dollar Cost Averaging) system, specifically designed for automated trading via Mizar webhooks.
═══════════════════════════════════════════════════════════
📊 KEY FEATURES
✓ Nadaraya-Watson Envelope Indicator
- Adaptive regression bands that follow price trends
- ATR-based dynamic upper/lower bands
- Customizable lookback windows and weighting
✓ Intelligent DCA System
- Exponential scaling of price thresholds (default 1.9x per level)
- Exponential scaling of order sizes (default 1.6x per level)
- Up to 20 configurable safety orders
- Minimum bars between orders to avoid overtrading
- Tracks average entry price across all orders
✓ Flexible Stop Loss Options
- Percentage-based stop loss
- ATR-based dynamic stop loss
- Always calculated from average entry price
✓ Optional Trailing Buy
- Separate settings for initial entry and DCA orders
- Helps capture better entry prices during pullbacks
✓ Full Mizar Integration
- Pre-configured webhook messages for all actions
- Automatic base asset extraction from ticker
- Separate TP settings for backtesting vs. live trading
- Supports open position, activate safety orders, edit TP, and close position
✓ Professional Backtesting
- Real-time position tracking with visual entry/exit labels
- Info table showing avg entry, TP, SL, and P&L
- Tracks average bars in winning trades for optimization
- Commission-inclusive (0.06% default)
═══════════════════════════════════════════════════════════
🎲 HOW IT WORKS
ENTRY SIGNAL:
- Triggers when price crosses above the lower Nadaraya-Watson band
- First order: Fixed size (default $10 USDT)
- Subsequent DCA orders: Exponentially scaled based on your settings
DCA LOGIC:
- Each safety order requires price to drop by an exponentially growing percentage
- Example with 2.1% base deviation and 1.9x scale:
• Order 1: Initial entry
• Order 2: -2.1% from Order 1
• Order 3: -3.99% from Order 2 (2.1% × 1.9)
• Order 4: -7.58% from Order 3 (2.1% × 1.9²)
• And so on...
EXIT SIGNALS:
- Take Profit: Fixed percentage above average entry
- Stop Loss: Percentage or ATR-based below average entry
═══════════════════════════════════════════════════════════
⚙️ RECOMMENDED SETTINGS
For BTC/ETH (Lower Volatility):
- DCA Price Deviation: 2.0-2.5%
- DCA Step Scale: 1.8-2.0
- DCA Volume Scale: 1.5-1.7
- Max Safety Orders: 4-6
- Stop Loss: 30-40%
For Altcoins (Higher Volatility):
- DCA Price Deviation: 2.5-3.5%
- DCA Step Scale: 1.9-2.2
- DCA Volume Scale: 1.6-1.9
- Max Safety Orders: 5-8
- Stop Loss: 40-60%
═══════════════════════════════════════════════════════════
🔗 MIZAR SETUP
1. Create a DCA bot on Mizar
2. Copy your Bot ID and API Key
3. Enter them in the "Mizar Webhook" settings
4. Set your Quote Asset (USDC/USDT)
5. Create alert with webhook URL: api.mizar.com
6. Set alert message to {{strategy.order.alert_message}}
7. Make sure "Webhook URL" option is checked
═══════════════════════════════════════════════════════════
⚠️ IMPORTANT NOTES
- This is a LONG ONLY strategy
- Always backtest on your specific asset/timeframe before going live
- Start with conservative settings and adjust based on results
- Monitor your "Avg Bars in Winning Trades" to optimize entry/exit
- The strategy calculates all percentages from your average entry price
- Recommended timeframes: 15m, 1h, 4h (avoid < 5m due to noise)
═══════════════════════════════════════════════════════════
📈 IDEAL FOR
- Cryptocurrency spot trading
- Medium to long-term position building
- Automated trading via Mizar
- Bull market accumulation strategies
- Traders who want to average into positions systematically
═══════════════════════════════════════════════════════════
💡 TIPS FOR SUCCESS
1. Use higher timeframes for more reliable signals
2. Adjust ATR multiplier based on asset volatility
3. Keep total position size (all DCA orders) within risk tolerance
4. Monitor the "Position Value" in the info table
5. Consider market conditions when setting TP/SL levels
═══════════════════════════════════════════════════════════
Created by Pitchfork| Modified for Mizar DCA Integration
For questions or support, please comment below!
#Mizar #DCA #NadarayaWatson #CryptoStrategy #AutomatedTrading

Universal Signal Trading Tool : Single TargetInternal V 128.0
Overview
This script by maurya_algo_trader is designed for four major things
Connect external buy/sell entry signal (from indicator) as well as optional exit signal (bool as well as limit) if available
SL/Target/TSL : Set various types of Target, Stoploss and trailing stoploss through this script
Trade/Risk Managements : Control the no of trades, day or month profits or loss etc.
Time managements : Sessions for trade timings
Execute trades (Equity, Futures and Options) on various brokers (Currently available for Dhan, Flattrade, 5Paisa, Anand Rathi and Delta exchange) automatically via webhook features through only single alerts
(currently available only for indian market : NSE, BSE, MCX and Delta exchange India crypto)
How to Connect External Signals for Entry, Exit(optional)
To connect external signals it is mandatory that the external signal script must be in the form of an “indicator” (Not in strategy).
In the tradingview community indicator you can find readymade indicator buy/sell signals (e.g. ut bot alerts). Mostly the buy/sell signal plotted via plotshap() function which gives the particular value (mostly: 1). This can be seen in “Data Window” (Right side of Tradingview just below the alert section). When you keep the cursor on the candle at buy or sell signal, it gives the value “1” and on the rest of the candles it will be “0”.
In Settings/Input tab you will find “EXTERNAL ENTRY” section where you can select the buy signal in drop down menu of “External Ling Entry Signal” and in same line default value 1 is already present (You can change it if plotted signal showing any other numbers for Buy signal). Similarly Choose sell signal in drop down menu of “External Short Entry Signal”. It also has the same “1” value by default but if it is different like” -1” you can change it manually.
If you have your own strategy, you need to convert it into an indicator first by removing the strategy function from the entire script (if you know the pine script coding or you can message me for the same). Then set the variable for the logic (bool condition) of long entry and short entry. And then plot the logic by following pine codes :
long_entry_cond = *your long condition logic variables (unique bool condition)*
short_entry_cond = *your short condition logic variables (unique bool condition)*
plot(long_entry_cond ? 1 : 0, '✅✅Long Entry Connector✅✅', display = display.data_window)
plot(short_entry_cond ? 1 : 0, '⛔⛔Short Entry Connector⛔⛔', display = display.data_window)
This will create the external plots which can be retrieved in the dropdown menu of “EXTERNAL ENTRY”.
If you have any external exits (other than opposite entry) you can use them similarly in sections of “EXTERNAL EXIT”. If you have any Take profit or take SL (at limit price) then it can also be retrieved in External TAKE PROFIT and EXTERNAL TAKE SL section by selecting the appropriate option in the dropdown menu.
Once proper signal attachment done with dropdown menu, you can see various entry exit labels like : “Long Entry”, “Short Entry”, “Long Exit” and “Short Exit”.
In addition to original entry, advance entry options are available like : “Entry at second candle of the day if no position”; “Entry at high/low breakout of actual Buy/Sell candle”; and “Add buffer to high/low of buy sell candle in points/percentage (inputs).
SL/Target Settings
By default, target and SL are off.
You can select various target types below and set the value accordingly (additional multiplier input available to optimize various interval of target level) :
Value (INR 1000 : not applicable of Index);
Percentage,
Points,
R:R (Multiplier of SL (Point/Percentage) );
No of Bars: Exit at set no of bars after entry.
Various stoploss types available like :
Value (INR 1000 : not applicable of Index);
Percentage,
Points,
Low/High During entry : A fix SL as low or high of no of candle back
Following options are one kind trailing Stoploss
HH/LL of period of candle : As candle moves ahead fix length of candle’s low or high move a one kind of trailing stoploss
ATR : Supertrend as trailing SL you need to add length and multiplier in respective input tabs
Pivot : This is the pivot point of right and left side candles length (low for long side and high for short) add left and right side candle length in respective input tabs.
Opposite band of Bollinger : Lower Band for Long Side and Upper band for Short side
TSL settings
TSL settings have the following types of options. By default it is off. This section is specifically designed to activate TSL after some market achieved some distance from its entry and TSL can be started from desired distance from entry or SL.
High/Low : It trails by distance of previous to new high created after entry
Step : It trails by by given inputs of distance: at every 50 points trails 50 points
Pivot/HH/LL od period of candle, ATR, opposite band of Bollinger these options are same as available in Stoploss section. The difference is only You can choose where the TSL is activated where it start from that you can decide in section.
Trade/Risk Managements
Trade direction : Both/Only Long/ Only short
Reverse Trade : You can reverse the trade if SL/TSL hit if it is in loss/profit options
Skip Opposite trade: If SL and Target or TSL is set then you can skip opposite trade until your SL/Target or TSL hit
Close trade if profitable at no of candle new highest close (for long) and lowest close (for short)
Max no of orders per day
Max Profit Per day
Max loss per day
Max Profit per month
Max Loss per month
Kill All Trades on chart
This option enables you to take only fresh entries after creating the alert. So many times Trade is running on chart and still we have not taken any order or created alert and I want a fresh entry signal (with any exit signal of previous entry). So for that you need to set the current date and times after the last entry on the chart. This will show you a pink color vertical draggable line. Before the pink line all signals disappear. Only after that you have to create an alert to take trade.
Date Filter
This filter is enabled to backtest from a specific date. But remember that date should not be beyond the unavailable candles on the chart. For Deep backtest you must use the tradingview premium plan feature in the strategy section.
Always unclick this option if you are trading via webhook
Time Management
Auto square off on click option available for NSE, NSE and MCX symbols, where mostly between 15:00 to 15:30 hours for NSE/BSE and 23:00 to 23:30 hours for MCX depending upon timeframe.
Upto two sessions you can set for trading: 0000 to 0000 means continue trading without any time restriction: Always set in 24 hour format. Input always shows in candles opening time instead of closing time.
Example
Trade timing : 09:30 - 15:00 (All entry and exit as per logic)
Squareoff timing : 15:00 – 15:30 (Only Exit happen at first candle close between 15:00 to 15:30, for 1 min TF it square off on 15:01, for 5 min TF 15:05 and for 15 min TF 15:15)
Algo Settings
Select broker : Dhan, Flattrade, 5Paisa,Anand Rathi, Delta Exchange
Instrument: Option, Future, Equity (What are you trading?)
For Future always use 1! (for current month) and 2! (for next month expiry) symbol chart (eg. NIFTY1! Or NIFTY2!)
Order type: Delivery (carry forward), Intraday ( Always set autosquare off of square off settings in time management). This selection also affects signals on the equity chart, Intraday shows both long and short signals while Delivery option shows only long side signals because in equity short trade is not allowed in delivery.
Quantity: for equity use no of shares that you what to trade, for future and options always use no of lot: enter 1 for 1 lot (please do not use lot size).
Client ID: You need to add client Id if you use broker Flattrade or Anand Rathi
Secret key from Json : Paste secret code for Dhan/Flattarde/Anand Rathi while strategy Id for delta exchange, no need of secret code for 5 paisa.
Secret code for Dhan: Order/Webhook/ Manage/ select webhook expiry/ creat webhook/ add any script/ creat json/ copy secret code from json without any inverted coma
Secret code from Flattrade: Order/webhook/login to creat webhook/ copy code from json (longer in character)
Strategy Id for Delta exchange : Algo/trading bot/Creat webhook/OTP-2FA-submit/ copy strategy id from json
deltaexchangeindia.freshdesk.com
Option settings
If you are trading options then select OPTION in instrument.
Option Buyer or seller: If you are option buyer then by default it is OPT BUYING
OPT BUYING: buy CE when long entry and buy PE when short entry on index chart, while it shows only long trades on option premium chart
OPT SELLING: sell PE when long entry and sell CE when short entry on index chart, while it shows only short trade on option premium chart
BOTH: This option is only used when you want to trade both long (Option Buying) and short signal (Option Selling) on option premium charts. Do not use on index chart; this is exclusively for option premium chart.
Strike selection : ATM : At the money, OTM: out of the Money (low Premium), ITM : In the money (Higher Premium)
You can trade the strike in multiple of your choice like in Nifty strike difference is 50 , but if dont want to trade 50 multiple strike 25850 or 25950 and you only want to trade 25800, 25900 then click on that option and enter strike difference 100.
Set expiry: for NSE and BSE according to instrument it has specific expiry day
Current Auto Expiry : Nearest expiry date (tuesday for NSE and thursday for BSE) for nifty50 current week tuesday and for Banknifty Current month last tuesday.
Current week/Next week/Next to Next week : for Nifty50 only
Current Month: Monthly expiry for NSE and BSE
Next Month: Next Monthly Expiry for NSE and BSE
Manual Date Input : Select this option for MCX and delta exchange india as well as NSE/BSE if date is not accurate automatically function. Suppose any Tuesday expiry for NSE is on holiday then you must select Manual date input.
Manual Expiry date: When you select Manual Input Date in above option then only you can select particular date of option expiry.
Delay Entry order by approx seconds: This option exclusively for Future and equity where new entry and previous exit order fire at the same time which cause margin release issues and hence order rejected due to low margin. This option gives signals at the same time but fires order after some seconds. Minimum 5 seconds are set but according to your symbols liquidity increases seconds specifically in MCX market where more than 10 seconds is appropriate. Always monitor such trades.
Consent and disclaimer
Always click this option : 'Trading involves a risk of loss and may not appropriate for every one. Please consider carefully if trading is appropriate for you. Past performance is not indicative of future results. Any signals appear on chart are for education purpose only. This signals can be optimised by yourself changing the variables in the indicator\'s input tab on various instruments and timeframe. It is your responsibility knowing that by clicking you are accepting that indicator would trade on your behalf at your own risk. We are not SEBI registered.'
Show Monthly Performance Table
This option enable the Monthly Performance in table form where month wise profit and loss are showing (on index it shows in point form). Percentage in () depends upon initial capital set in the property tab. Various Statistical parameters are also seen in table like : % profitability, profit factor, No of trades (W winnings and L Lossing), Max Run-Up, Max Drawdown, Initial capital, Backtest Range. This data only shows that shows on strategy tester without any deep backtesting.
Show Small PNL Table
This option enables a small profit and loss table for today’s trade only (except the last candle close)
Show Algo Setting Details Table
This table enables you to show which settings have you done for automation and also guides if you select the wrong option showing in red background color. Symbols, instruments, broker, client id, secret key, position on chart, expiry date (most important for FNO) please verify this date with actual option chain expiry date. Wrong expiry date lead to no execution of trade.
Creat Alert for Automation
At the end of indicator on three dot click on “Add alert on Universal Signal Trading Tool : Single Target”. Which Creat on Pop-Out Page with three different tab:
Settings Message and Notifications
#Settings
Symbols : current symbol
Condition: Universal Signal Trading Tool : Single Target
Interval: Same as chart
#Message
Alert Name: Type your Custom alert name
Message: by default you will this message : {{strategy.order.alert_message}}
Please do not change this message, do not use any json message here
#Notifications
Click on webhook url : (Only available if you have Tradingview subscription and two factor authentication is done) paste brokers valid webhook here (Use only active webhook). Please do not use api webhook, use only tradingview webhook separately available for tradingview User’s broker account.
Play sound as per your need
How to update an alert?
Once you create an alert on the current indicator and current chart with the same timeframe then green color watch you can see next to indicator name on chart. If green watch does not appear then the current indicator setting/symbol/timeframe is different from the setting in alert.
So if you have made any changes then you must update the alert.
See the right top side of the alert in the alert section: pause/ restart, edit and delete option are available. Click on edit option then pop-up window will open, select appropriate symbol if it is different, in condition dropdown menu if indicator name shows two time means second name is the new settings, so select second indicator name and select timeframe as same as chart and then click ok. Check if the green watch appears or not.
Trouble shooting
Q : I am not able to see signals on chart?
Check initial capital on chart, increase zero at end if required.
Always unclick the backtest date filter.
Check entry exit external signal properly selected.
Q: Trade not executing on broker panel?
Is alert generated in alert log? If yes then check secret code, expiry date if trading FNO, valid webhook and symbols. If No then update your alert.
Q: Order fails at broker?
Click on the failed order and see the reason and approach us via message on tradingview.
Note: Strategy used in the above strategy is only for example and demonstration purpose. It does not indicate to use the same strategy.
Results shown here are using the supertrend indicator (attached to this script as external indicator) with ATR length 1 and factor 30 on Nifty 50 index chart on 5 minute timeframe.
Always use your own criteria, risk management and proper backtesting before using the live capital. Do not go for blind trading, always monitor the automated trade in synchronization. Any misbehave by system or technical glitches leads to unwanted loss. So, think first, practice and go according to your analysis.
Your feedback and reporting any kind of bug is appreciable. Please reach us via message, comment or communication method available in our profile.
