RSI Divergence AlertRSI Divergence Alert Input: range Bullish RSI Divergence yellow Bearish RSI Divergence red Pine Script® 인디케이터jordan.fan.basket의업데이트됨 1190
08-2018 Stochastic 5m [ALERT SETUP] [INDICATOR]This is an accumulation of small buy orders and a complete sell order strategy, that can be used for manual trading or for a trading bot. The strategy is based on stockastic divergences ( an indicator that I made myself and is published on my profile earlier ), and I added my personnal touch of course. Note that the bullish and bearish stochastic divergences are calculated separately and can be configured in the inputs. To be used with a 5m timeframe, and on a flat or bullish pair. Everyone can favorite the script, apply it to the chart, but only I can see or modify the code. If you need anything, leave a comment, thanks :D More info about the script, such as inputs description, how to configure the script, strategy explanation, alert configuration can be found here : blockchainfiesta.com -------------------------------------------------------------------------------------------------------------- I do commission work: TradingView Pine Script development & Reverse Engineering. contact@blockchainfiesta.com. You can also send me a message in TradingView or Discord (discord.gg) Bitcoin address: 19sVQvCDmVfEACq7BiMnWSMqFPZ8qfSQ2K ETH address: 0xc8a5d3a63a05db0c2363ea1c08b37a01cce9ebfbPine Script® 인디케이터cyatophilum의95
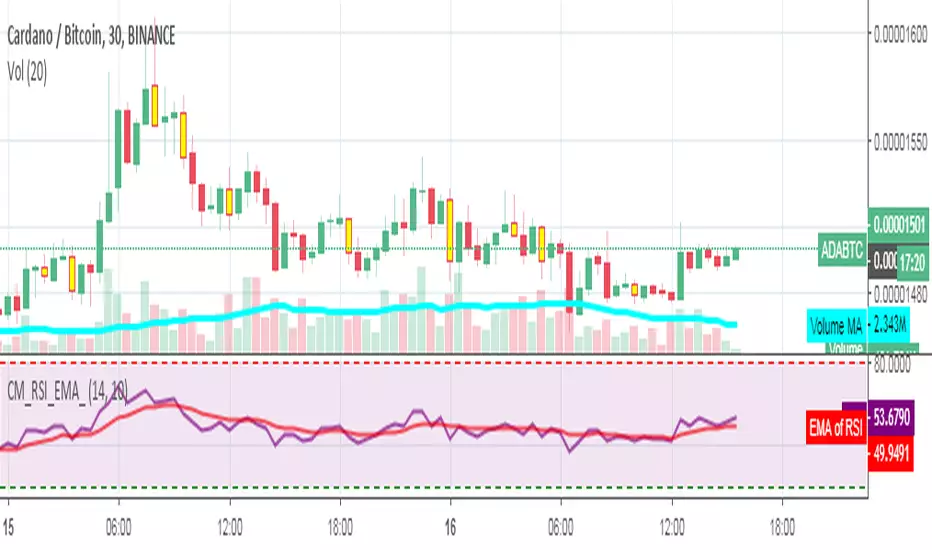
RSI_EMA & Bearish EngulfingThis is a RSI-RSI of EMA and bearish candlestick reversal pattern formed by two candlesticks. Following an uptrend, the first candlestick is a up candlestick which is followed by a down candlestick which has a long real body that engulfs or contains the real body of the prior bar. following an uptrend, if RSI and EMA line cross then Sell and for downtrend if RSI and EMA line cross then Buy.Pine Script® 인디케이터PremRajendra의23
Stochastique Divergences IndicatorHello, I made a custom indicator. Divergences with stochastique and price are really strong signals. About the indicator A bullish divergence happens when the stoch K makes a higher low and is depicted by a green triangle up. A bearish divergence happens when the stoch K makes a lower high and is depicted by a red triangle down. This script is the base for my next strategy that I should upload soon. I will grant access (to this script and my others) to people willing to make a small donation. Here is my BTC address : 19sVQvCDmVfEACq7BiMnWSMqFPZ8qfSQ2K If you prefer ETH : 0xc8a5d3a63a05db0c2363ea1c08b37a01cce9ebfb Send me a Private Message with the ID of the transaction If you want to do some forward testing first, send me a message. Also check blockchainfiesta.comPine Script® 인디케이터cyatophilum의2244
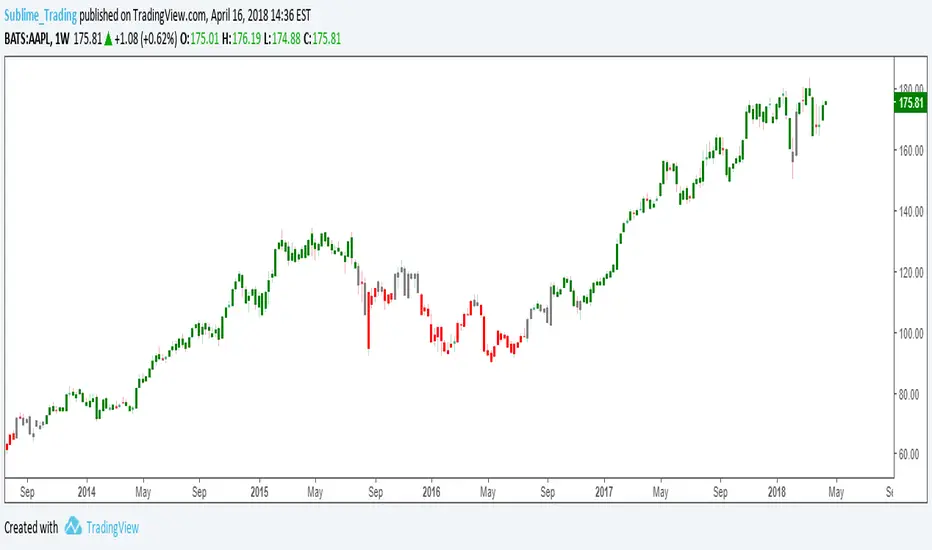
wTF50This is a customized trend filter that has several uses: It helps identify trend direction, either bullish or bearish It distinguishes between a pullback and a trend reversal It helps identify areas where traders should stand aside It highlights areas of consolidationPine Script® 인디케이터Sublime_Trading의6636
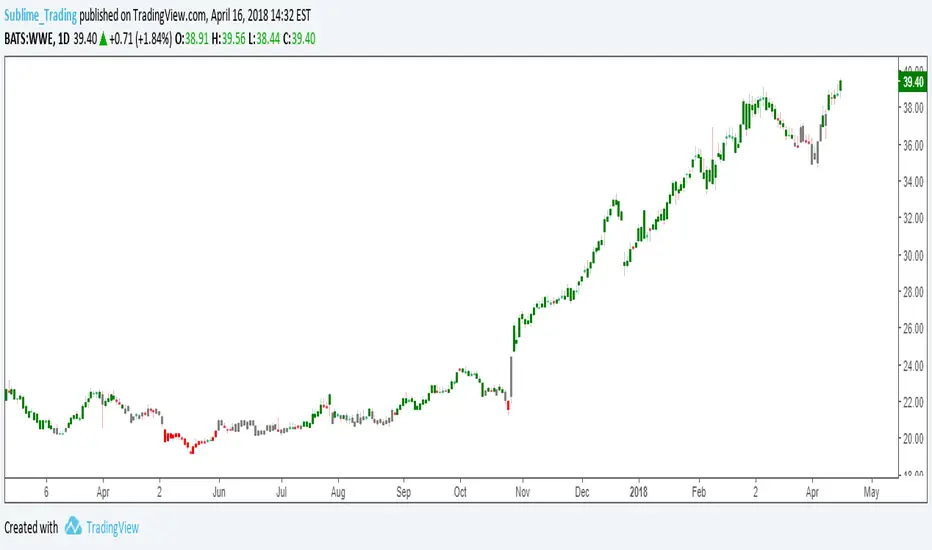
dTF50This is a customized trend filter that has several uses: It helps identify trend direction, either bullish or bearish It distinguishes between a pullback and a trend reversal It helps identify areas where traders should stand aside It highlights areas of consolidationPine Script® 인디케이터Sublime_Trading의2223
OBV divergence hidden and regular on both bearish and bullish.OBV (on balance volume) divergence indicator with hidden and regular signal on both bearish and bullish.Pine Script® 인디케이터Patternsmart의99123
CMYK VRMI◊ Introduction This script indicates the relative movement of price x volume. ◊ Origin Based on 'The Relative Momentum Index' by Roger Altman : February, 1993 issue of Technical Analysis of Stocks & Commodities magazine. While RSI counts up and down days from close to close, the Relative Momentum Index counts up and down days from the close relative to a close x number of days ago. This results in an RSI that is smoother. The input has been changed to the change of a smoothed close multiplied by a smoothed volume. The polarity of VRMI indicates bearish/bullish movement. ◊ Adjustments CMYK color theme applied. ◊ Usage VRMI indicates the force the market moves with. ◊ Future Prospects - ◊ ◊ ◊ ◊ ◊ ◊ ◊ ◊ ◊ ◊ ◊ ◊ ◊ ◊ ◊ ◊ ◊ ◊ ◊ ◊ ◊ ◊ ◊ ◊ ◊ ◊ ◊ ◊ ◊ ◊ ◊ ◊ ◊ ◊ ◊ ◊ ◊ ◊ ◊ ◊ ◊ ◊ ◊ ◊ ◊ ◊ ◊ ◊ ◊ ◊ ◊ ◊ ◊ ◊ ◊ ◊ ◊ ◊ ◊ ◊ ◊ ◊ ◊ ◊ ◊ ◊ ◊ ◊ ◊ ◊ ◊ ◊ ◊ ◊ ◊ ◊ ◊ ◊ ◊ ◊ ◊ ◊ ◊ ◊ ◊ ◊ ◊ ◊ ◊ ◊ ◊ ◊ ◊ ◊ ◊ ◊ ◊ ◊ ◊ ◊ ◊ ◊ ◊ ◊ ◊ ◊Pine Script® 인디케이터MVPMC의113
CMYK VRMI RAYS ◊ Introduction Introducing VRMI in this script, an RMI based on price movement and volume, to indicate bullish and bearish trends. This script marks the background depending on RMI <> VRMI , VRMI polarity and large buy/sell sprees. ◊ Origin Based on 'The Relative Momentum Index' by Roger Altman : February, 1993 issue of Technical Analysis of Stocks & Commodities magazine. While RSI counts up and down days from close to close, the Relative Momentum Index counts up and down days from the close relative to a close x number of days ago. This results in an RSI that is smoother. In addition VRMI reacts quick, it is used to cut off latency from RMI, and it's polarity indicates the beginning and end of a trend. Large buy sell sprees and detected in their proportion with an sma on the volume ◊ Adjustments CMYK color theme applied. ◊ Usage This indicator can be used to detect trends and mark reversals. ◊ Prospects ◊ ◊ ◊ ◊ ◊ ◊ ◊ ◊ ◊ ◊ ◊ ◊ ◊ ◊ ◊ ◊ ◊ ◊ ◊ ◊ ◊ ◊ ◊ ◊ ◊ ◊ ◊ ◊ ◊ ◊ ◊ ◊ ◊ ◊ ◊ ◊ ◊ ◊ ◊ ◊ ◊ ◊ ◊ ◊ ◊ ◊ ◊ ◊ ◊ ◊ ◊ ◊ ◊ ◊ ◊ ◊ ◊ ◊ ◊ ◊ ◊ ◊ ◊ ◊ ◊ ◊ ◊ ◊ ◊ ◊ ◊ ◊ ◊ ◊ ◊ ◊ ◊ ◊ ◊ ◊ ◊ ◊ ◊ ◊ ◊ ◊ ◊ ◊ ◊ ◊ ◊ ◊ ◊ ◊ ◊ ◊ ◊ ◊ ◊ ◊ ◊ ◊ ◊ ◊ ◊ ◊ Pine Script® 인디케이터MVPMC의업데이트됨 75
Inside Bar with bullish and bearish colorInside Bar with bullish and bearish colorPine Script® 인디케이터pieroliviermarquis의2222 1.2 K
Bullish and Bearish Engulfing Patterns auto detectionThis simple indicator detects automatically most important bullish and bearish candlestick patterns formations. Used to locate potential supply and demand imbalances. Copyright 2017 Alfonso Moreno www.set-and-forget.comPine Script® 인디케이터AlfonsoMoreno의5959 3.8 K
Pin barSource code that allows to find bullish or bearish pin bars in any asset.Pine Script® 인디케이터cma의업데이트됨 1111 1.8 K
Super Envolvente (Bullish y Bearish)Identificador de Super-envolventes (SE), se encarga de darle un color verde a la SE alzista (Bullish) verde y rojo a la bajista (Bearish). Pine Script® 인디케이터cma의262
MaayaBearishPROD_v10_Nov2025bearish analysis bearish analysis bearish analysis bearish analysisPine Script™ 전략jithinlal4trading의1
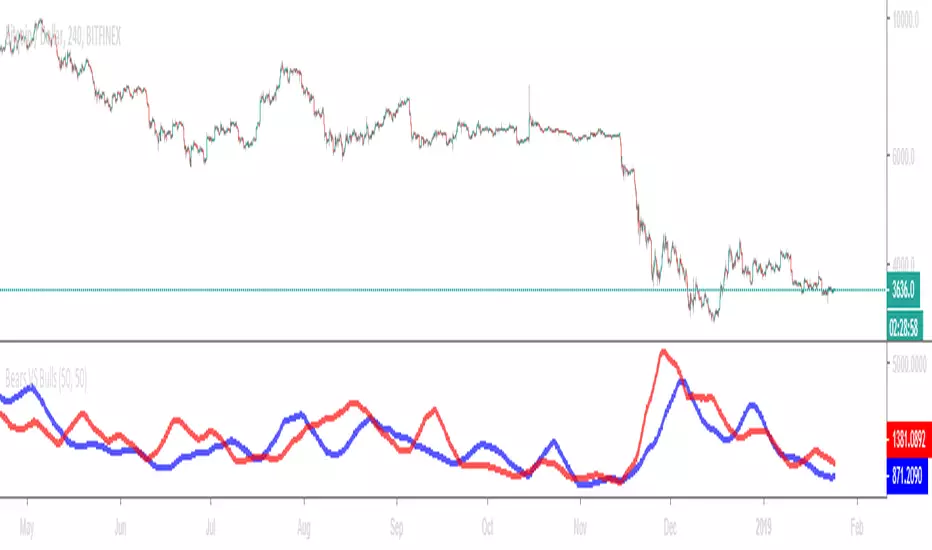
Bears VS BullsThis indicator will work on ANY instrument. The red line is a moving average of ONLY sellers in the market. The blue line is a moving average of ONLY buyers in the market. The period or "length" of the individual moving averages can be adjusted in the indicator settings. The default, it is set to 50. Buying and selling trends often provide indications of market moves such as the most recent bottom in Cryptocurrencies. Feel free to comment and share any indicator concepts or ideas for content you would like to see added to the Technical Indicator Bundle on www.kenzing.com Pine Script® 인디케이터GrantPeace의업데이트됨 141480
Bearish Trailing stopIt is a trailing SL. Works very well. Good good very good. Looks like my description needs more, so here is more random text.Pine Script® 인디케이터TimeFract의3
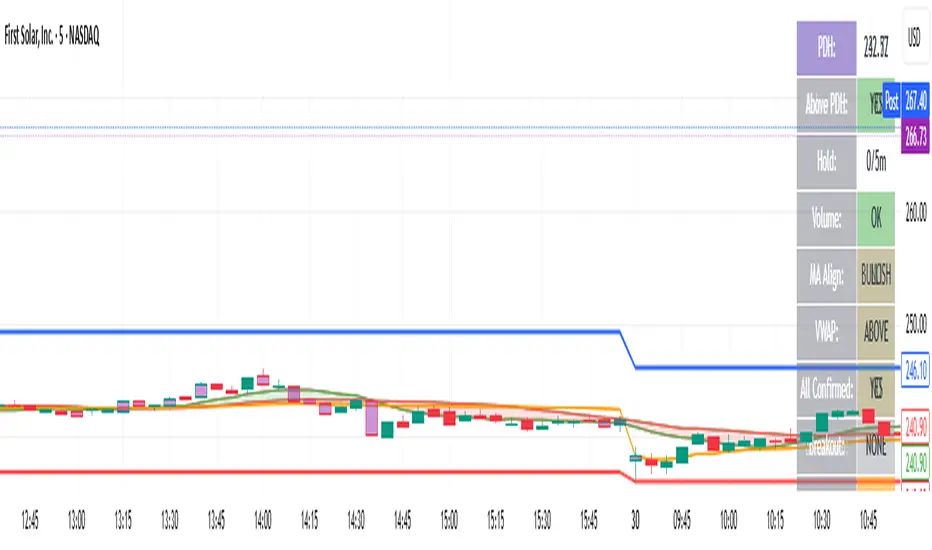
bearish Price Below PDL - Complete Multi-Confirmation Alert🎯 KEY IMPROVEMENTS: 1. Enhanced Alert Visibility:$jmoskyhigh ✅ HUGE triangle down marker with "SELL" text ✅ Alert title: "SELL SIGNAL - PDL BREAKDOWN CONFIRMED" ✅ Prominent info panel with red theme ✅ Clear "SELL ALERT: TRIGGERED" status 2. Better Visual Feedback: Red frame around info panel Larger shapes and markers Color-coded confirmations (green = OK, red = FAIL) Progress percentage displayed Breakdown price label 3. Complete Alert System: Main Alert: "SELL SIGNAL - PDL BREAKDOWN CONFIRMED" Early Warning: "PDL Breakdown Started - Monitoring" Reset Alert: "Confirmation Lost - Breakdown Reset"Pine Script® 인디케이터jmslimus의4
Bearish 1st Breakaway SLInspried by DeLeBlanc Bullish 1st Breakaway StoplossPine Script® 인디케이터hoakhanh1976의8848
Bearish signal using Point of Control (POC) with PAC by guruThis indicator code helps traders identify potential sell opportunities using several important technical indicators: Point of Control (POC) – This is the price level where the most volume was traded over the past several days. Previous Day's Low – This shows the lowest price reached during the previous day. PAC (Price Action Channel) EMA – These are two moving averages (one based on the low price and one based on the close price) that help determine if the price is trending within a certain range. Volume SMA – This is a 3-day simple moving average (SMA) of volume, which helps filter out signals based on market activity. What the Script Does: Point of Control (POC): The script looks at the last 50 days (configurable) and calculates which price level had the highest trading volume. It then plots a red line on the chart at the POC level. This is important because it helps identify areas where there was strong market interest in the past. Volume Moving Average: The script calculates a 3-day SMA of volume, but it excludes the current day to avoid premature signals based on today’s trading. The volume SMA is used to ensure there’s enough market activity (with a threshold set to 25 units) before triggering a sell signal. Price Action Channel (PAC) EMA: The PAC consists of two exponential moving averages (EMAs): The PAC Low EMA: This is based on the low prices over the last 34 periods (configurable). The PAC Close EMA: This is based on the closing prices over the last 34 periods. These EMAs help determine if the price is trending above or below certain price levels. Sell Signal Logic: The script checks three conditions before displaying a "Sell" signal: Price Below POC and Previous Day’s Low: The close price must be below both the Point of Control (POC) and the previous day's low. Volume SMA Above 25: The 3-day volume SMA must be greater than 25. This ensures the signal only triggers when there’s enough trading volume in the market. Today’s Low is Above PAC EMAs: Today's low price must be above both the PAC low EMA and the PAC close EMA. This prevents sell signals when prices are already significantly below the PAC, indicating possible exhaustion in the downtrend. If all three conditions are met, the script will display a red "Sell" label on the chart, signaling a potential selling opportunity. No Sell Signal if Price Reverses: If the price crosses back above the POC or the previous day's low, the script will remove the sell signal and reset for a new opportunity. Summary of Conditions: For the script to display a "Sell" label: The close price must be below the Point of Control (POC) and the previous day’s low. The 3-day volume SMA (excluding today) must be greater than 25 units. The low price of the current day must be above both the PAC low EMA and the PAC close EMA. If these conditions are met, a red sell label appears on the chart as a potential signal for a short (sell) trade.Pine Script® 인디케이터Guru7208의2121242
Bearish FS Continuation S1BB - baby bar / inside bar DF - downflow, meaning 20MA below 50MA EXE - execution bar, indicator to short Mainly to identify execution bar for shorting using inside bar identification and force topPine Script™ 전략vinniechase89의19
Guneet-ScalperBearish trend candle color change to red with sell print Bullish trend candle color change to green with buy print thanks jas toorPine Script® 인디케이터jastoor의1111106
Asymmetric Traffic Light - Regime FilterOverview The Asymmetric Traffic Light is a trend regime classification system that categorizes market conditions into four distinct states: Green (bullish), Yellow (neutral), Orange (transition), and Red (bearish). Unlike simple traffic light indicators, this version includes an asymmetric transition rule that prevents the market from jumping directly from Red to Green, reducing false signals during volatile recoveries. How It Works Regime Definitions RED (Bearish) - Price is below both the 200 SMA and 50 SMA. This represents a confirmed downtrend where both short and long-term momentum are negative. Risk should be minimized. GREEN (Bullish) - Three conditions must be met simultaneously: Price is above the 200 SMA The 200 SMA slope is positive (rising over the lookback period) The 50 SMA is above its value from 5 bars ago (showing upward momentum) This triple confirmation ensures you only get Green during genuine bullish conditions, not just price spikes above the moving average. YELLOW (Neutral) - Any condition that is neither Red nor Green. This includes situations where price is above one MA but below the other, or when the slope conditions are not met. ORANGE (Transition Quarantine) - This is the key innovation. When price exits Red (transitions to non-Red), the indicator enters a mandatory 4-bar quarantine period. During this time, even if Green conditions are technically met, the indicator displays Orange instead. Why the Orange Quarantine Matters Markets often experience sharp bear market rallies that quickly fail. Without the quarantine: Day 1: Red (price below both MAs) Day 2: Sharp rally, price spikes above both MAs → Would show Green Day 3: Rally fails, back to Red With the quarantine: Day 1: Red Day 2: Sharp rally → Orange (quarantine bar 1 of 4) Day 3: Rally fails → Back to Red (quarantine resets) The asymmetry means you need sustained strength to reach Green, but you can fall into Red immediately. This matches the reality that markets tend to fall faster than they rise. What Makes This Different Most traffic light indicators use simple threshold crossings that generate excessive signals during choppy conditions. The asymmetric transition rule acknowledges that exiting a bearish regime requires more confirmation than entering one. This design philosophy prioritizes avoiding false bullish signals over capturing every rally. Settings Guide Moving Average Settings Long SMA Length - Primary trend filter. Default 200 matches institutional trend reference. Range: 50-500. Short SMA Length - Secondary trend filter. Default 50 for intermediate trend. Range: 10-100. Slope Lookback - Period to measure SMA200 direction. Default 20 bars. Shorter = more responsive, longer = smoother. Short MA Momentum Lookback - Bars to compare for SMA50 upward momentum. Default 5. Transition Settings Orange Quarantine Bars - Mandatory waiting period after exiting Red. Default 4 bars. Increase for more conservative signals. Visual Settings Color customization for each regime state Toggle background coloring on/off Toggle regime change labels How to Use Add the indicator to your chart (works best on daily timeframe for position trading) GREEN: Full position size, bullish bias YELLOW: Reduced exposure, no directional bias ORANGE: Remain cautious, do not increase bullish exposure yet RED: Defensive positioning, avoid new longs The indicator outputs numeric regime values (0-3) and boolean flags that can be referenced by other scripts for systematic strategy development. Alerts Green Regime - Triggered when transitioning into confirmed bullish conditions Red Regime - Triggered when entering bearish conditions Orange Transition - Triggered when exiting Red into quarantine period Yellow Regime - Triggered when entering neutral conditions Any Regime Change - Triggered on any state transition Best Practices Use on daily charts for swing/position trading timeframes Combine with your entry timing indicators - this is a filter, not a signal generator Consider increasing quarantine bars during high-volatility periods The Orange state is particularly valuable after sharp selloffs to avoid bear trap rallies Limitations Lagging indicator - moving averages by nature respond to past price action The quarantine period may cause you to miss the first few bars of legitimate rallies Optimized for daily timeframes; lower timeframes may generate excessive state changes Does not account for volume, volatility, or external factors Disclaimer This indicator is for educational and informational purposes only. It does not constitute financial advice. Past performance does not guarantee future results Always conduct your own research before making trading decisions Consider your risk tolerance and investment objectives This is a filter tool, not a complete trading system Pine Script® 인디케이터luiscaballero의업데이트됨 3
TS vs Previous Candle (TSC/TSD) This indicator detects **Turtle Soup (TS) reversal triggers** using a strict **previous-candle reference** and prints signals **only on bar close** (non-repainting intrabar). * **TS Bull:** the current bar **sweeps below the prior low** (liquidity grab) and then **closes back above the prior low**. * **TS Bear:** the current bar **sweeps above the prior high** and then **closes back below the prior high**. An optional strict mode can require the close to remain **inside the previous candle’s range** for cleaner mean-reversion structure. Each signal is further classified as: * **TSC (Clean):** candle body aligns with the TS direction (bull body for TS Bull, bear body for TS Bear). * **TSD (Dirty):** candle body contradicts the TS direction (or doji), highlighting weaker/less “clean” reversals. Use it to map **liquidity sweeps + reversal closes** and to separate higher-quality TS setups (TSC) from more ambiguous ones (TSD) for further filtering (trend, levels, sessions, risk rules). Pine Script® 인디케이터Fran_Pineda의3