EMA+MACD+Fib Scalping ChallengeThis strategy synthesizes two core concepts from the provided transcripts:
Transcripts are pulled from the following two youtube videos
youtu.be
youtu.be
High-Probability Scalping Setup (1st Transcript): A mechanical method for finding high-probability, short-term reversal trades on a 1-minute chart. It uses a triple confluence of:
Trend Direction: Two Exponential Moving Averages (EMA 8 and EMA 34) identify the short-term trend direction via crossovers.
Momentum Confirmation: A fast MACD (3, 10, 16) confirms the strength and timing of the momentum shift required for entry.
Precise Entry Zone: Fibonacci retracement levels (primarily 61.8%) identify where a pullback is most likely to end and the main trend is likely to resume, providing a high-value entry point.
Aggressive Account Growth Challenge (2nd Transcript): An extremely high-risk, high-reward money management framework. Instead of traditional 1-2% risk per trade, this strategy risks 23% of the current account equity on each trade to target a 30% profit (a reward-risk ratio of approximately 1.3:1). The goal is to compound a small initial stake ($20) into a much larger amount ($50k+) over a series of successful trades, accepting that a few losses can wipe out the account just as quickly.
Core Philosophy: The strategy bets heavily on the edge provided by the high-probability technical setup. When the setup is correct, the account grows exponentially. When it fails, the losses are severe. It is designed for maximum capital efficiency in trending markets but is vulnerable during choppy or ranging conditions.
Ideal Parameter Settings & Configuration
These settings are optimized based on the specifics mentioned in the transcripts for 1-minute scalping.
1. Chart & Instrument Settings
Time Frame: 1 Minute
Instruments: Major forex pairs with low spreads (e.g., EUR/USD, GBP/USD). This is critical for scalping.
Trading Session: Highly liquid sessions like the London-New York overlap.
2. Indicator Parameters & Inputs
Parameter Ideal Setting Description & Purpose
Fast EMA Length 8 Reacts quickly to recent price changes, used for signal generation.
Slow EMA Length 34 Defines the underlying short-term trend. Acts as dynamic support/resistance.
MACD Fast Length 3 Makes the MACD extremely sensitive for catching early momentum shifts on the 1-min chart.
MACD Slow Length 10 The baseline for the fast length to calculate momentum against.
MACD Signal Smoothing 16 Slightly smoothed signal line to generate clearer crossover signals.
Fibonacci Level 61.8% The primary retracement level used to define the entry zone and the stop-loss level.
3. Strategy & Money Management Parameters
Parameter Setting Description & Purpose
Initial Capital 20 (or any small amount) The starting capital for the challenge.
Risk Per Trade 23% of equity The defining rule of the challenge. This is the percentage of the current account value risked on each trade.
Profit Target Per Trade 30% of equity The target profit, creating a ~1.3:1 Reward/Risk ratio.
Stop-Loss Type Fixed Percentage (23%) For simplicity and adherence to the challenge rules. The transcript also mentions placing the stop "a little below the 61.8% Fib level," which is a more advanced option.
Pyramiding 0 Do not add to positions. One trade at a time is already high-risk.
4. Entry & Exit Rules (Coded Logic)
LONG ENTRY: When ALL of the following occur simultaneously:
EMA 8 crosses above EMA 34.
MACD Histogram crosses above 0 (turns positive).
Price is touching or retracing to the 61.8% Fibonacci level drawn from a recent swing low to high.
SHORT ENTRY: When ALL of the following occur simultaneously:
EMA 8 crosses below EMA 34.
MACD Histogram crosses below 0 (turns negative).
Price is touching or retracing to the 61.8% Fibonacci level drawn from a recent swing high to low.
EXIT RULES:
Take Profit: Close the trade when a 30% profit on the risked capital is reached.
Stop Loss: Close the trade when a 23% loss on the risked capital is reached.
Emergency Exit: If the MACD or EMA cross back in the opposite direction before target/stop is hit, consider an early exit.
Critical Disclaimer and Final Notes
EXTREME RISK: This is not a standard trading strategy. It is a high-stakes challenge. Risking 23% per trade means just 4 consecutive losses would likely wipe out over 90% of your account. The second transcript's simulation showed a 99.5% success rate only under a constant 60% win rate condition, which is unrealistic in live markets.
Demo Use Only: This strategy must be thoroughly tested and understood in a demo environment before ever considering it with real funds.
Market Dependency: This strategy thrives only in strongly trending markets with clear pullbacks. It will generate significant losses in ranging, choppy, or low-volatility conditions. The ability to avoid trading in bad markets is a key factor in the challenge's success.
Psychological Pressure: The emotional burden of watching 23% of your account fluctuate on a 1-minute chart is immense and can lead to poor decision-making.
Use this strategy as a fascinating framework to study confluence and aggressive compounding, not as a guaranteed path to profits.
스크립트에서 "bands"에 대해 찾기

Enhanced Kitchen Sink Strategymulti-layered trading system designed for TradingView, targeting a minimum 75% win rate through precise entry signals and robust risk management. Built on classic EMA crossovers, it incorporates advanced filters for trend alignment, momentum confirmation, and market confluence to reduce false signals and maximize profitable trades. Ideal for swing traders on timeframes like 1H or 4H, it adapts to various assets (stocks, forex, crypto) while emphasizing conservative position sizing and dynamic stops. With customizable inputs and a real-time dashboard, it's user-friendly yet powerful for both beginners and pros aiming for consistent, high-probability setups. Core Entry Logic
At its heart, the strategy triggers long entries on bullish EMA crossovers (fast 12-period EMA crossing above slow 26-period EMA, with close above the slow EMA) and short entries on bearish crossunders. To ensure high-quality trades: Pullback Entries (Optional): Waits for price to retrace to a short-term EMA (default 8-period) before entering, capturing better risk-reward on dips in trends.
Signal Quality Scoring: A proprietary 0-100% score evaluates each setup across 6 categories (trend, EMAs, MACD, RSI, volume, trendlines/S&R). Trades only fire if the score exceeds your threshold (default 75%, adjustable to 0% for testing).
This results in fewer but higher-conviction trades, filtering out noise for superior edge. Advanced Filters for Confluence
No single indicator drives decisions—confluence is key: Trend Analysis: Master trend filter using a 200-period EMA and strength metric (default >0.5% deviation). Optional higher-timeframe (e.g., daily) confirmation via EMA and MACD alignment.
MACD Double Confirmation: Requires MACD line above/below signal (9-period) with optional histogram momentum buildup.
RSI + Divergence: Filters for neutral RSI zones (40-70 for longs, 30-60 for shorts) and detects bullish/bearish divergences over 20 bars.
Volume Profile: Demands above-average volume (1.5x 20-period SMA) with buying/selling pressure analysis.
Trendlines & S/R: Auto-detects dynamic trendlines from pivots (10-bar lookback) and support/resistance zones (100-bar lookback, 3+ touches), avoiding entries near key levels.
Session Filters: Trades only during London/NY sessions (UTC-based), skipping high-volatility news windows (e.g., 1:30-2:00 PM UTC).
All filters are toggleable, allowing you to dial in aggressiveness—disable for more signals during backtesting.Risk Management & Position Sizing
Safety first: Uses 100% equity per trade with 0.1% commission simulation. Stops & Targets: ATR-based (14-period) stop-loss (1x ATR) and take-profit (2.5x ATR) for 1:2.5 risk-reward.
Breakeven Moves: Auto-shifts stop to +0.1% entry after 1% profit.
Trailing Stops: Optional 1.5x ATR trail to lock in gains during runners.
No pyramiding—flat after each close for clean, low-drawdown performance.
Visualization & Insights On-Chart: Plots EMAs, pullback lines, S/R dashes, trend backgrounds (green/red), and entry labels/shapes.
Dashboard: Real-time table shows trend status, HTF bias, quality scores, MACD/RSI/volume readouts, session info, ATR, price, and position.
Customization: 20+ inputs grouped by category; max 500 labels for clean charts.
Performance Edge & Usage Tips
Backtested for 75%+ win rates in trending markets, this strategy shines in volatile assets like EURUSD or BTCUSD. Start with defaults on 1H charts, then tweak filters (e.g., lower quality to 50%) for ranging conditions. Always forward-test—past results aren't guarantees. Download, apply, and elevate your trading with confluence-driven precision!

QZ Trend (Crypto Edition) v1.1a: Donchian, EMA, ATR, Liquidity/FThe "QZ Trend (Crypto Edition)" is a rules-based trend-following breakout strategy for crypto spot or perpetual contracts, focusing on following trends, prioritizing risk control, seeking small losses and big wins, and trading only when advantageous.
Key mechanisms include:
- Market filters: Screen favorable conditions via ADX (trend strength), dollar volume (liquidity), funding fee windows, session/weekend restrictions, and spot-long-only settings.
- Signals & entries: Based on price position relative to EMA and EMA trends, combined with breaking Donchian channel extremes (with ATR ratio confirmation), plus single-position rules and post-exit cooldowns.
- Position sizing: Calculate positions by fixed risk percentage; initial stop-loss is ATR-based, complying with exchange min/max lot requirements.
- Exits & risk management: Include initial stop-loss, trailing stop (tightens only), break-even rule (stop moves to entry when target floating profit is hit), time-based exit, and post-exit cooldowns.
- Pyramiding: Add positions only when profitable with favorable momentum, requiring ATR-based spacing; add size is a fraction of the base position, with layers sharing stop logic but having unique order IDs.
Charts display EMA, Donchian channels, current stop lines, and highlight low ADX, avoidable funding windows, and low-liquidity periods.
Recommend starting with 4H or 1D timeframes, with typical parameters varying by cycle. Liquidity settings differ by token; perpetuals should enable funding window filters, while spot requires "long-only" and matching fees. The strategy performs well in trends with quick stop-losses but faces whipsaws in ranges (filters mitigate but don’t eliminate noise). Share your symbol and timeframe for tailored parameters.

kaka 谈趋势The Exponential Moving Average (EMA) strategy is a popular technical analysis tool used in trading to smooth price data over a specific time period. The EMA gives more weight to recent prices, making it more responsive to recent price changes compared to the Simple Moving Average (SMA).
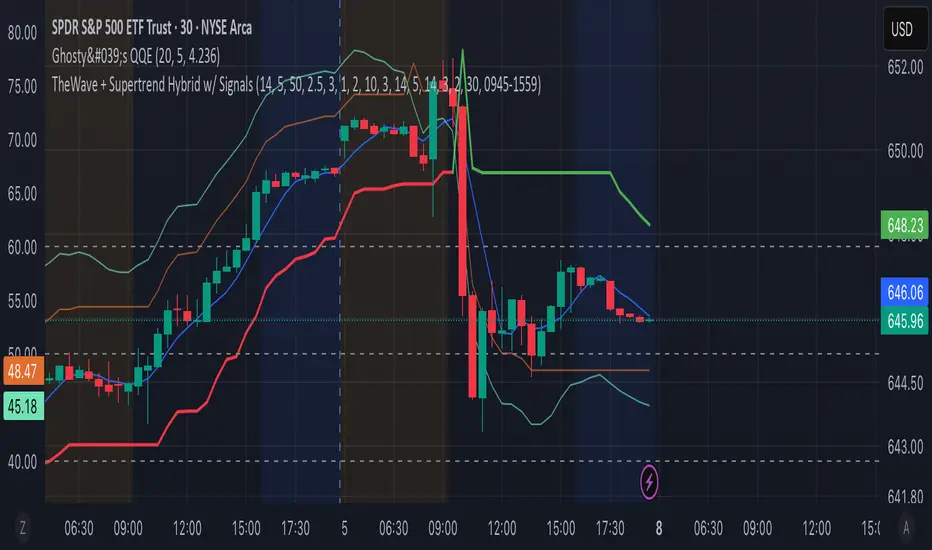
TheWave + Supertrend Hybrid w/ Signals• Green triangle below bar → Long entry signal
• Red triangle above bar → Short entry signal
• Small lime cross above/below → Take-profit hit
• Small maroon cross above/below → Stop-loss hit
• SMA5 and Supertrend lines for trend context
This version makes all entries and exits visually obvious while keeping the hybrid TheWave + Supertrend logic intact.
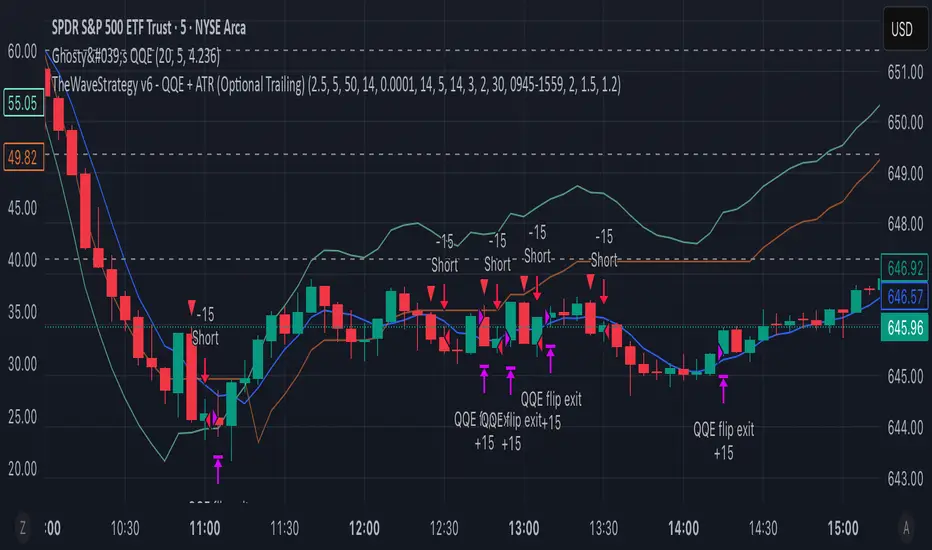
TheWaveStrategy v6 - QQE + ATR (Optional Trailing)New Version Of the wave with QQE and ATR
• Compiles cleanly in Pine v6.
• Optional trailing stop toggle via useTrailingATR.
• Market exit uses strategy.close() properly.
• ATR spike filter uses 5m ATR.
• QQE confluence with 30m timeframe included.
dabilThe strategy is probably to go short or long with the trend depending on the case, but if all time units 1 minute then 3 minutes then 5 minutes then 15 minutes then 1 hour all show the same direction, but first the 1 hour must be bullish in which the 1 hour candle closes above the previous one, for example if the trend is bearish then the market wants to change direction, then a 1 hour bullish close must then be followed by a 1 hour bearish close below the bullish candle, then another bullish candle must shoot above the previous bullish candle, then 15 minutes also shoot above the previous 15 bullish candles, then 1 and 2...3.5. Then I can rise with the market by only covering the last 15 bullish candles with my stop loss, if my SL is 50 pips then I want 100 pips and then I'm out.

EMA MACD - 5-20Based on Crossover and Big timeframe EMA Support and resistance this strategy is developed.

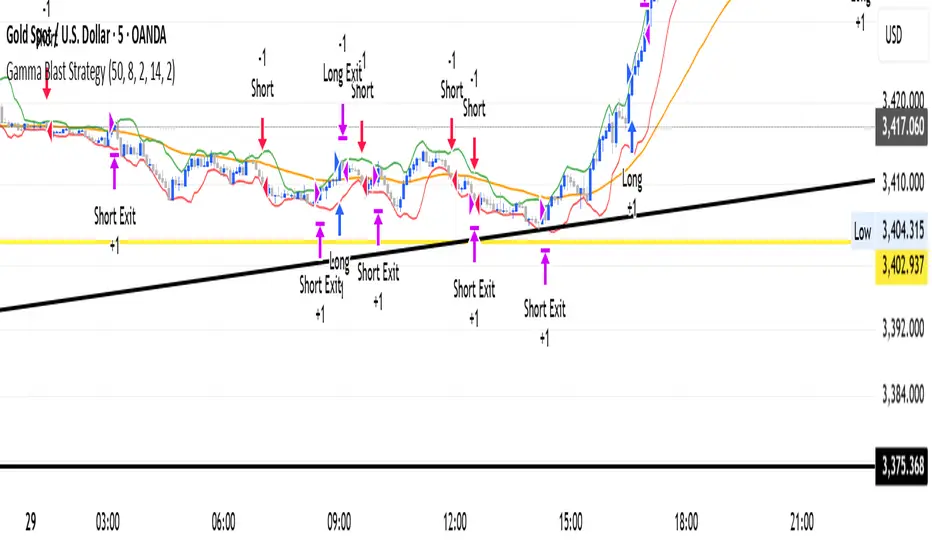
Gamma Blast StrategyGamma Blast Strategy used for quick 2-5 ticks on Buys, but on a sideways market can get up to 15-20 ticks.
J12Matic Builder by galgoomA flexible Renko/tick strategy that lets you choose between two entry engines (Multi-Source 3-way or QBand+Moneyball), with a unified trailing/TP exit engine, NY-time trading windows with auto-flatten, daily profit/loss and trade-count limits (HALT mode), and clean webhook routing using {{strategy.order.alert_message}}.
Highlights
Two entry engines
Multi-Source (3): up to three long/short sources with Single / Dual / Triple logic and optional lookback.
QBand + Moneyball: Gate → Trigger workflow with timing windows, OR/AND trigger modes, per-window caps, optional same-bar fire.
Unified exit engine: Trailing by Bricks or Ticks, plus optional static TP/SL.
Session control (NY time): Evening / Overnight / NY Session windows; auto-flatten at end of any enabled window.
Day controls: Profit/Loss (USD) and Trade-count limits. When hit, strategy HALTS new entries, shows an on-chart label/background.
Alert routing designed for webhooks: Every order sets alert_message= so you can run alerts with:
Condition: this strategy
Notify on: Order fills only
Message: {{strategy.order.alert_message}}
Default JSONs or Custom payloads: If a Custom field is blank, a sensible default JSON is sent. Fill a field to override.
How to set up alerts (the 15-second version)
Create a TradingView alert with this strategy as Condition.
Notify on: Order fills only.
Message: {{strategy.order.alert_message}} (exactly).
If you want your own payloads, paste them into Inputs → 08) Custom Alert Payloads.
Leave blank → the strategy sends a default JSON.
Fill in → your text is sent as-is.
Note: Anything you type into the alert dialog’s Message box is ignored except the {{strategy.order.alert_message}} token, which forwards the payload supplied by the strategy at order time.
Publishing notes / best practices
Renko users: Make sure “Renko Brick Size” in Inputs matches your chart’s brick size exactly.
Ticks vs Bricks: Exit distances switch instantly when you toggle Exit Units.
Same-bar flips: If enabled, a new opposite signal will first close the open trade (with its exit payload), then enter the new side.
HALT mode: When day profit/loss limit or trade-count limit triggers, new entries are blocked for the rest of the session day. You’ll see a label and a soft background tint.
Session end flatten: Auto-closes positions at window ends; these exits use the “End of Session Window Exit” payload.
Bar magnifier: Strategy is configured for on-close execution; you can enable Bar Magnifier in Properties if needed.
Default JSONs (used when a Custom field is empty)
Open: {"event":"open","side":"long|short","symbol":""}
Close: {"event":"close","side":"long|short|flat","reason":"tp|sl|flip|session|limit_profit|limit_loss","symbol":""}
You can paste any text/JSON into the Custom fields; it will be forwarded as-is when that event occurs.
Input sections — user guide
01) Entries & Signals
Entry Logic: Choose Multi-Source (3) or QBand + Moneyball (pick one).
Enable Long/Short Signals: Master on/off switches for entering long/short.
Flip on opposite signal: If enabled, a new opposite signal will close the current position first, then open the other side.
Signal Logic (Multi-Source):
Single: any 1 of the 3 sources > 0
Dual: Source1 AND Source2 > 0
Triple (default): 1 AND 2 AND 3 > 0
Long/Short Signal Sources 1–3: Provide up to three series (often indicators). A positive value (> 0) is treated as a “pulse”.
Use Lookback: Keeps a source “true” for N bars after it pulses (helps catch late triggers).
Long/Short Lookback (bars): How many bars to remember that pulse.
01b) QBands + Moneyball (Gate -> Trigger)
Allow same-bar Gate->Trigger: If ON, a trigger can fire on the same bar as the gate pulse.
Trigger must fire within N bars after Gate: Size of the gate window (in bars).
Max signals per window (0 = unlimited): Cap the number of entries allowed while a gate window is open.
Buy/Sell Source 1 – Gate: Gate pulse sources that open the buy/sell window (often a regime/zone, e.g., QBands bull/bear).
Trigger Pulse Mode (Buy/Sell): How to detect a trigger pulse from the trigger sources (Change / Appear / Rise>0 / Fall<0).
Trigger A/B sources + Extend Bars: Primary/secondary triggers plus optional extension to persist their pulse for N bars.
Trigger Mode: Pick S2 only, S3 only, S2 OR S3, or S2 AND S3. AND mode remembers both pulses inside the window before firing.
02) Exit Units (Trailing/TP)
Exit Units: Choose Bricks (Renko) or Ticks. All distances below switch accordingly.
03) Tick-based Trailing / Stops (active when Exit Units = Ticks)
Initial SL (ticks): Starting stop distance from entry.
Start Trailing After (ticks): Start trailing once price moves this far in your favor.
Trailing Distance (ticks): Offset of the trailing stop from peak/trough once trailing begins.
Take Profit (ticks): Optional static TP distance.
Stop Loss (ticks): Optional static SL distance (overrides trailing if enabled).
04) Brick-based Trailing / Stops (active when Exit Units = Bricks)
Renko Brick Size: Must match your chart’s brick size.
Initial SL / Start Trailing After / Trailing Distance (bricks): Same definitions as tick mode, measured in bricks.
Take Profit / Stop Loss (bricks): Optional static distances.
05) TP / SL Switch
Enable Static Take Profit: If ON, closes the trade at the fixed TP distance.
Enable Static Stop Loss (Overrides Trailing): If ON, trailing is disabled and a fixed SL is used.
06) Trading Windows (NY time)
Use Trading Windows: Master toggle for all windows.
Evening / Overnight / NY Session: Define each session in NY time.
Flatten at End of : Auto-close any open position when a window ends (sends the Session Exit payload).
07) Day Controls & Limits
Enable Profit Limits / Profit Limit (Dollars): When daily net PnL ≥ limit → auto-flatten and HALT.
Enable Loss Limits / Loss Limit (Dollars): When daily net PnL ≤ −limit → auto-flatten and HALT.
Enable Trade Count Limits / Number of Trades Allowed: After N entries, HALT new entries (does not auto-flatten).
On-chart HUD: A label and soft background tint appear when HALTED; a compact status table shows Day PnL, trade count, and mode.
08) Custom Alert Payloads (used as strategy.order.alert_message)
Long/Short Entry: Payload sent on entries (if blank, a default open JSON is sent).
Regular Long/Short Exit: Payload sent on closes from SL/TP/flip (if blank, a default close JSON is sent).
End of Session Window Exit: Payload sent when any enabled window ends and positions are flattened.
Profit/Loss/Trade Limit Close: Payload sent when daily profit/loss limit causes auto-flatten.
Tip: Any tokens you include here are forwarded “as is”. If your downstream expects variables, do the substitution on the receiver side.
Known limitations
No bracket orders from Pine: This strategy doesn’t create OCO/attached brackets on the broker; it simulates exits with strategy logic and forwards your payloads for external automation.
alert_message is per order only: Alerts fire on order events. General status pings aren’t sent unless you wire a separate indicator/alert.
Renko specifics: Backtests on synthetic Renko can differ from live execution. Always forward-test on your instrument and settings.
Quick checklist before you publish
✅ Brick size in Inputs matches your Renko chart
✅ Exit Units set to Bricks or Ticks as you intend
✅ Day limits/Windows toggled as you want
✅ Custom payloads filled (or leave blank to use defaults)
✅ Your alert uses Order fills only + {{strategy.order.alert_message}}

🚀⚠️ Aggressive + Confirmed Long Strategy (v2)//@version=5
strategy("🚀⚠️ Aggressive + Confirmed Long Strategy (v2)",
overlay=true,
pyramiding=0,
initial_capital=10000,
default_qty_type=strategy.percent_of_equity,
default_qty_value=10, // % of equity per trade
commission_type=strategy.commission.percent,
commission_value=0.05)
// ========= Inputs =========
lenRSI = input.int(14, "RSI Length")
lenSMA1 = input.int(20, "SMA 20")
lenSMA2 = input.int(50, "SMA 50")
lenBB = input.int(20, "Bollinger Length")
multBB = input.float(2, "Bollinger Multiplier", step=0.1)
volLen = input.int(20, "Volume MA Length")
smaBuffP = input.float(1.0, "Margin above SMA50 (%)", step=0.1)
confirmOnClose = input.bool(true, "Confirm signals only after candle close")
useEarly = input.bool(true, "Allow Early entries")
// Risk
atrLen = input.int(14, "ATR Length", minval=1)
slATR = input.float(2.0, "Stop = ATR *", step=0.1)
tpRR = input.float(2.0, "Take-Profit RR (TP = SL * RR)", step=0.1)
useTrail = input.bool(false, "Use Trailing Stop instead of fixed SL/TP")
trailATR = input.float(2.5, "Trailing Stop = ATR *", step=0.1)
moveToBE = input.bool(true, "Move SL to breakeven at 1R TP")
// ========= Indicators =========
// MAs
sma20 = ta.sma(close, lenSMA1)
sma50 = ta.sma(close, lenSMA2)
// RSI
rsi = ta.rsi(close, lenRSI)
rsiEarly = rsi > 45 and rsi < 55
rsiStrong = rsi > 55
// MACD
= ta.macd(close, 12, 26, 9)
macdCross = ta.crossover(macdLine, signalLine)
macdEarly = macdCross and macdLine < 0
macdStrong = macdCross and macdLine > 0
// Bollinger
= ta.bb(close, lenBB, multBB)
bollBreakout = close > bbUpper
// Candle & Volume
bullishCandle = close > open
volCondition = volume > ta.sma(volume, volLen)
// Price vs MAs
smaCondition = close > sma20 and close > sma50 and close > sma50 * (1 + smaBuffP/100.0)
// Confirm-on-close helper
useSignal(cond) =>
confirmOnClose ? (cond and barstate.isconfirmed) : cond
// Entries
confirmedEntry = useSignal(rsiStrong and macdStrong and bollBreakout and bullishCandle and volCondition and smaCondition)
earlyEntry = useSignal(rsiEarly and macdEarly and close > sma20 and bullishCandle) and not confirmedEntry
longSignal = confirmedEntry or (useEarly and earlyEntry)
// ========= Risk Mgmt =========
atr = ta.atr(atrLen)
slPrice = close - atr * slATR
tpPrice = close + (close - slPrice) * tpRR
trailPts = atr * trailATR
// ========= Orders =========
if strategy.position_size == 0 and longSignal
strategy.entry("Long", strategy.long)
if strategy.position_size > 0
if useTrail
// Trailing Stop
strategy.exit("Exit", "Long", trail_points=trailPts, trail_offset=trailPts)
else
// Normal SL/TP
strategy.exit("Exit", "Long", stop=slPrice, limit=tpPrice)
// Move SL to breakeven when TP1 hit
if moveToBE and high >= tpPrice
strategy.exit("BE", "Long", stop=strategy.position_avg_price)
// ========= Plots =========
plot(sma20, title="SMA 20", color=color.orange, linewidth=2)
plot(sma50, title="SMA 50", color=color.new(color.blue, 0), linewidth=2)
plot(bbUpper, title="BB Upper", color=color.new(color.fuchsia, 0))
plot(bbBasis, title="BB Basis", color=color.new(color.gray, 50))
plot(bbLower, title="BB Lower", color=color.new(color.fuchsia, 0))
plotshape(confirmedEntry, title="🚀 Confirmed", location=location.belowbar,
color=color.green, style=shape.labelup, text="🚀", size=size.tiny)
plotshape(earlyEntry, title="⚠️ Early", location=location.belowbar,
color=color.orange, style=shape.labelup, text="⚠️", size=size.tiny)
// ========= Alerts =========
alertcondition(confirmedEntry, title="🚀 Confirmed Entry", message="🚀 {{ticker}} confirmed entry on {{interval}}")
alertcondition(earlyEntry, title="⚠️ Early Entry", message="⚠️ {{ticker}} early entry on {{interval}}")

Trading Advice By RajTrading Advice Strategy
This strategy is based on a simple moving average crossover system using the 50 EMA and the 200 EMA.
Buy Signal (Long): When the 50 EMA crosses above the 200 EMA, a bullish trend is detected and a BUY signal is generated.
Sell Signal (Short): When the 200 EMA crosses above the 50 EMA, a bearish trend is detected and a SELL signal is generated.
EMA lines are hidden on the chart for a clean look. Only BUY and SELL signals are shown as labels.
Suitable for trend-following traders who want clear entry signals without noise.
Can be combined with risk management tools like Stop Loss & Take Profit for better results. youtube.com BINANCE:BTCUSDT

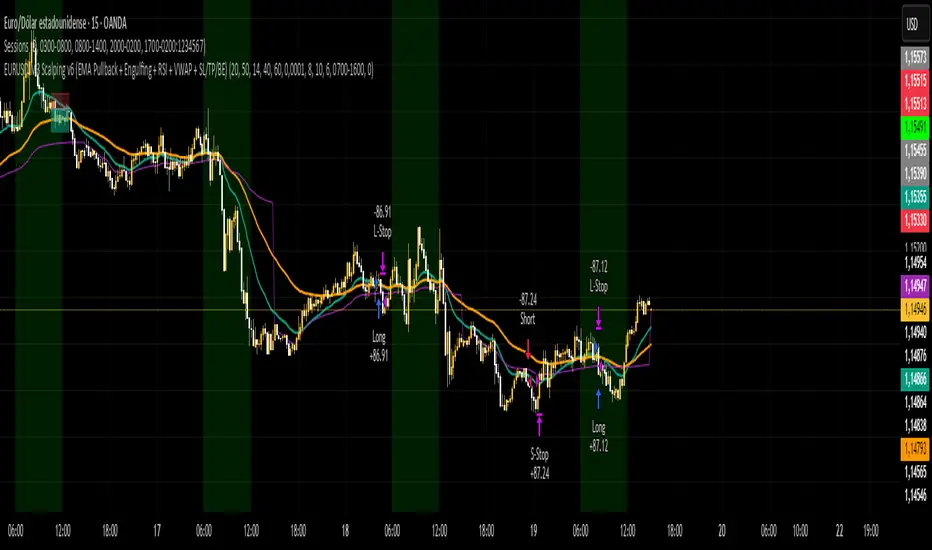
Estrategy EURUSD M3 Scalping Estrategia para operar el EURUSD en temp de 3 min, indica sl y tp 6 pips sl y 10 pips tp
Script_Algo - ORB Strategy with Filters🔍 Core Concept: This strategy combines three powerful technical analysis tools: Range Breakout, the SuperTrend indicator, and a volume filter. Additionally, it features precise customization of the number of candles used to construct the breakout range, enabling optimized performance for specific assets.
🎯 How It Works:
The strategy defines a trading range at the beginning of the trading session based on a selected number of candles.
It waits for a breakout above the upper or below the lower boundary of this range, requiring a candle close.
It filters signals using the SuperTrend indicator for trend confirmation.
It utilizes trading volume to filter out false breakouts.
⚡ Strategy Features
📈 Entry Points:
Long: Candle close above the upper range boundary + SuperTrend confirmation
Short: Candle close below the lower range boundary + SuperTrend confirmation
🛡️ Risk Management:
Stop-Loss: Set at the opposite range boundary.
Take-Profit: Calculated based on a risk/reward ratio (3:1 by default).
Position Size: 10 contracts (configurable).
⚠️ IMPORTANT SETTINGS
🕐 Time Parameters:
Set the correct time and time zone!
❕ATTENTION: The strategy works ONLY with correct time settings! Set the time corresponding to your location and trading session.
📊 This strategy is optimized for trading TESLA stock!
Parameters are tailored to TESLA's volatility, and trading volumes are adequate for signal filtering. Trading time corresponds to the American session.
📈 If you look at the backtesting results, you can see that the strategy could potentially have generated about 70 percent profit on Tesla stock over six months on 5m timeframe. However, this does not guarantee that results will be repeated in the future; remain vigilant.
⚠️ For other assets, the following is required:
Testing and parameter optimization
Adjustment of time intervals and the number of candles forming the range
Calibration of stop-loss and take-profit levels
⚠️ Limitations and Drawbacks
🔗 Automation Constraints:
❌ Cannot be directly connected via Webhook to CFD brokers!
Additional IT solutions are required for automation, thus only manual trading based on signals is possible.
📉 Risk Management:
Do not risk more than 2-3% of your account per trade.
Test on historical data before live use.
Start with a demo account.
💪 Strategy Advantages
✅ Combined approach – multiple signal filters
✅ Clear entry and exit rules
✅ Visual signals on the chart
✅ Volume-based false breakout filtering
✅ Automatic position management
🎯 Usage Recommendations
Always test the strategy on historical data.
Start with small trading volumes.
Ensure time settings are correct.
Adapt parameters to current market volatility.
Use only for stocks – futures and Forex require adaptation.
📚 Suitable Timeframes - M1-M15
Only highly liquid stocks
🍀 I wish all subscribers good luck in trading and steady profits!
📈 May your charts move in the right direction!
⚠️ Remember: Trading involves risk. Do not invest money you cannot afford to lose!


Imbalance RSI Divergence Strategy# Imbalance RSI Divergence Strategy - User Guide
## What is This Strategy?
This strategy identifies **imbalance** zones in the market and combines them with **RSI divergence** to generate trading signals. It aims to capitalize on price gaps left by institutional investors and large volume movements.
### Main Settings
- **RSI Period (14)**: Period used for RSI calculation. Lower values = more sensitive, higher values = more stable signals.
- **ATR Period (10)**: Period for volatility measurement using Average True Range.
- **ATR Stop Loss Multiplier (2.0)**: How many ATR units to use for stop loss calculation.
- **Risk:Reward Ratio (4.0)**: Risk-reward ratio. 2.0 = 2 units of reward for 1 unit of risk.
- **Use RSI Divergence Filter (true)**: Enables/disables the RSI divergence filter.
### Imbalance Filters
- **Minimum Imbalance Size (ATR) (0.3)**: Minimum imbalance size in ATR units to filter out small imbalances.
- **Enable Lookback Limit (false)**: Activates historical lookback limitations.
- **Maximum Lookback Bars (300)**: Maximum number of bars to look back.
### Visual Settings
- **Show Imbalance Size**: Displays imbalance size in ATR units.
- **Show RSI Divergence Lines**: Shows/hides divergence lines.
- **Divergence Line Colors**: Colors for bullish/bearish divergence lines.
### Volatility-Based Adjustments
- **Low volatility markets**:
- Minimum Imbalance Size: 0.2-0.4 ATR
- ATR Stop Loss Multiplier: 1.5-2.0
- **High volatility markets**:
- Minimum Imbalance Size: 0.5-1.0 ATR
- ATR Stop Loss Multiplier: 2.5-3.5
### Risk Tolerance
- **Conservative approach**:
- Risk:Reward Ratio: 2.0-3.0
- RSI Divergence Filter: Enabled
- Minimum Imbalance Size: Higher (0.5+ ATR)
- **Aggressive approach**:
- Risk:Reward Ratio: 4.0-6.0
- Minimum Imbalance Size: Lower (0.2-0.3 ATR)
###Market Conditions
- **Trending markets**: Higher RSI Period (21-28)
- **Sideways markets**: Lower RSI Period (10-14)
- **Volatile markets**: Higher ATR Multiplier
## Recommended Testing Procedure
1. **Start with default settings** and backtest on 3-6 months of historical data
2. **Adjust RSI Period** to see which value produces better results
3. **Optimize ATR Multiplier** for stop loss levels
4. **Test different Risk:Reward ratios** comparatively
5. **Fine-tune Minimum Imbalance Size** to improve signal quality
## Important Considerations
- **False positive signals**: Imbalances may be less reliable during low volatility periods
- **Market openings**: First hours often produce more imbalances but can be riskier
- **News events**: Consider disabling strategy during major news releases
- **Backtesting**: Test across different market conditions (trending, sideways, volatile)
## Recommended Settings for Beginners
**Safe settings for new users:**
- RSI Period: 14
- ATR Period: 14
- ATR Stop Loss Multiplier: 2.5
- Risk:Reward Ratio: 3.0
- Minimum Imbalance Size: 0.5 ATR
- RSI Divergence Filter: Enabled
## Advanced Tips
### Signal Quality Improvement
- **Combine with market structure**: Look for imbalances near key support/resistance levels
- **Volume confirmation**: Higher volume during imbalance formation increases reliability
- **Multiple timeframe analysis**: Confirm signals on higher timeframes
### Risk Management
- **Position sizing**: Never risk more than 1-2% of account per trade
- **Maximum drawdown**: Set overall stop loss for the strategy
- **Market hours**: Consider avoiding low liquidity periods
### Performance Monitoring
- **Win rate**: Track percentage of profitable trades
- **Average R:R**: Monitor actual risk-reward achieved vs. target
- **Maximum consecutive losses**: Set alerts for strategy review
This strategy works best when combined with proper risk management and market analysis. Always backtest thoroughly before using real money and adjust parameters based on your specific market and trading style.

Crypto Gann Channel Strategy (Long Bias, fixed)This is Gann Strategy Cody with Long Bias. Please try and let me know if can be improved.

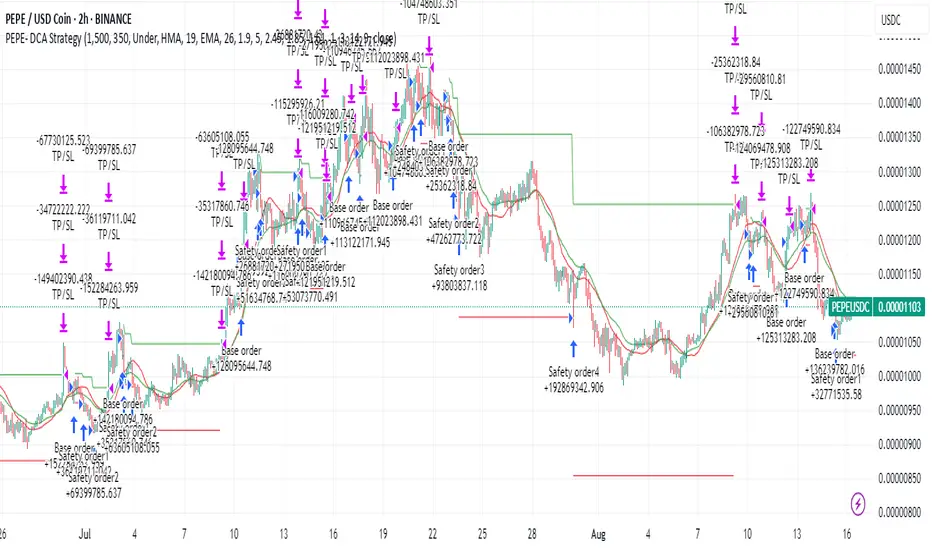
DCA Strategy on Steroids for CryptoThis strategy getting only in Long position for Crypto
Using Fast and Slow moving Averages and Stochastic RSI to get in Long position
Fast and Slow moving Averages - cross-under - I Prefer - or opposite for Bull Market
Stochastic RSI cross-over - 5 and Trend Determined by the Fast moving Average
There is no Stop loss is not for one with small tolerance to getting under
Fast and Slow moving Averages and Stochastic RSI Parameters can be adjust
The bot Use Safe Trades and Price Deviation Determined from the User
Max Safe Trades = 10
Take profit Parameters can be adjust in %
Pepe-USDC is just a example What the bot Can do
Breakout asia USD/CHF1 — Customizable Parameters
sess1 & sess2: The two time ranges that define the Asian session (e.g., 20:00–23:59 and 00:00–08:00).
Important: format is HHMM-HHMM.
rr: The risk/reward ratio (default = 3.0, meaning TP = 3× risk size).
onePerSess: Toggle to allow only one trade per Asian session or multiple.
bufTicks: Extra margin for the SL beyond the signal candle.
2 — Detecting the Asian Session
The script checks if the candle’s time is inside the first range (sess1) or inside the second range (sess2).
While inside the Asian session, it updates the current high and low.
When the session ends, it locks in these levels as rangeHigh and rangeLow.
3 — Step 1: Detecting the Initial Breakout
Bullish breakout → close above rangeHigh → flag breakoutUp is set to true.
Bearish breakout → close below rangeLow → flag breakoutDown is set to true.
No trade yet — this is just the breakout signal.
4 — Step 2: Waiting for the Retest
If a bullish breakout occurred, wait for the price to return to or slightly below rangeHigh and then close back above it.
If a bearish breakout occurred, wait for the price to return to or slightly above rangeLow and then close back below it.
5 — Entry & Exit
When the retest is confirmed:
strategy.entry() is triggered.
SL = behind the retest confirmation candle (with optional bufTicks margin).
TP = entry price ± RR × risk size.
If onePerSess is enabled, no further trades happen until the next Asian session.
6 — Chart Display
Green line = locked Asian session high.
Red line = locked Asian session low.
Light blue background = active Asian session hours.
Trade entries are shown on the chart when retests occur.

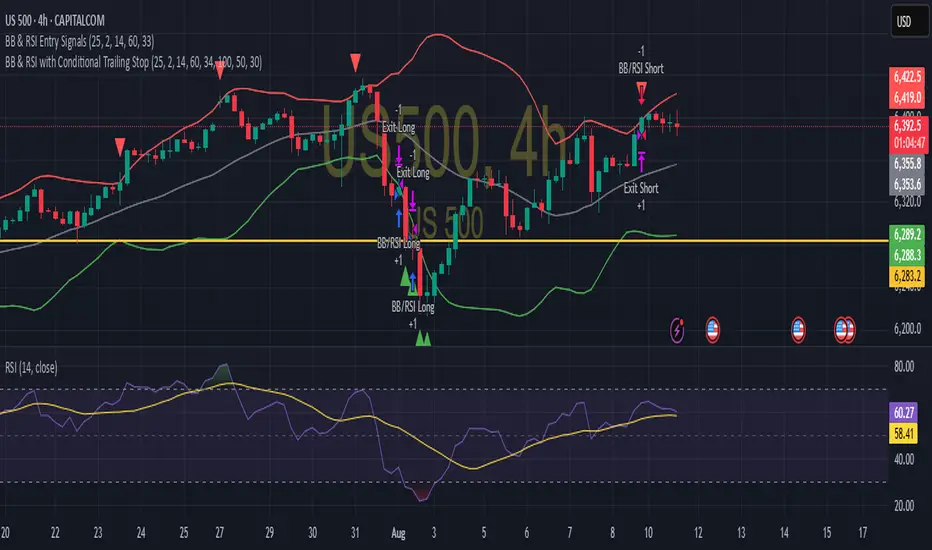
BB & RSI Trailing Stop StrategySimple BB & RSI generated using AI, gets 60% on S&P 500 with the right settings
TOT Strategy, The ORB Titan (Configurable)This is a strategy script adapted from Deniscr 's indicator script found here:
All feedback welcome!

Dubic EMA StrategyThe Dubic EMA Strategy is a trend-following and volatility-aware strategy that combines dual EMA filters with intelligent range and noise detection to provide clean, actionable entries. It's designed to avoid choppy markets, enhance trade precision, and adapt to different market conditions.
✅ Key Features:
Dual EMA Filter: Enters long when price is above both EMA High & EMA Low, and short when below both.
Range Filter: Avoids entries during tight consolidations or sideways markets.
Volatility Filter: Prevents trading in low-ATR conditions.
Dynamic Risk Management:
ATR-based or fixed % Stop Loss and Take Profit.
Optional Parabolic SAR trailing stop.
One Trade per Trend: Prevents re-entry until trend direction changes.
Unbroken Range Visualization: Detects and displays consolidation zones that can lead to breakouts.
Alerts & Labels: Clean BUY/SELL signals with alerts and chart labels.
🧩 Customization Options:
Adjustable EMA length
Toggle between ATR or % based SL/TP
Volatility threshold
Range detection sensitivity
Enable/disable SAR trailing stop
This strategy works best on trending assets and timeframes with volatility (e.g., crypto, forex, indices). Suitable for both manual trading and automation.
🛠️ Built for clarity, control, and precision.
📈 Backtest, optimize, and deploy with confidence.

Opening-Range BreakoutNote: Default trading date range looks mediocre. Set date range to "Entire History" to see full effect of the strategy. 50.91% profitable trades, 1.178 profit factor, steady profits and limited drawdown. Total P&L: $154,141.18, Max Drawdown: $18,624.36. High R^2
█ Overview
The Opening-Range Breakout strategy is a mechanical, session‑based day‑trading system designed to capture the initial burst of directional momentum immediately following the market open. It defines a user‑configurable “opening range” window, measures its high and low boundaries, then places breakout stop orders at those levels once the range closes. Built‑in filters on minimum range width, reward‑to‑risk ratios, and optional reversal logic help refine entries and manage risk dynamically.
█ How It Works
Opening‑Range Formation
Between 9:30–10:15 AM ET (configurable), the script tracks the highest high and lowest low to form the day’s opening range box.
On the first bar after the range window closes, the range high (OR_high) and low (OR_low) are “locked in.”
Range‑Width Filter
To avoid false breakouts in low‑volatility mornings, the range must be at least X% of the current price (default 0.35%).
If the measured opening-range width < minimum threshold, no orders are placed that day.
Entry & Order Placement
Long: a stop‑buy order at the opening‑range high.
Short: a stop‑sell order at the opening‑range low.
Only one side can trigger (or both if reverse logic is enabled after a losing trade).
Risk Management
Once triggered, each trade uses an ATR‑style stop-loss defined as a percentage retracement of the range (default 50% of range width).
Profit target is set at a configurable Reward/Risk Ratio (default 1.1×).
Optional: Reverse on Stop‑Loss – if the initial breakout loses, immediately reverse into the opposite side on the same day.
Session Exit
Any open positions are closed at the end of the regular trading day (default 3:45 PM ET window end, with hard flat at session close).
Visual cues are provided via green (range high) and red (range low) step‑line plots directly on the chart, allowing you to see the range box and breakout triggers in real time.
█ Why It Works
Early Momentum Capture: The first 15 – 60 minutes of trading encapsulate overnight news digestion and institutional order flow, creating a well‑defined volatility “range.”
Mechanical Discipline: Clear, rule‑based entries and exits remove emotional guesswork, ensuring consistency.
Volatility Filtering: By requiring a minimum range width, the system avoids choppy, low‑range days where false breakouts are common.
Dynamic Sizing: Stops and targets scale with the opening range, adapting automatically to each day’s volatility environment.
█ How to Use
Set Your Instruments & Timeframe
-Apply to any futures contract on a 1‑ to 5‑minute chart.
-Ensure chart timezone is set to America/New_York.
Configure Inputs
-Opening‑Range Window: e.g. “0930-1015” for a 45‑minute range.
-Min. OR Width (%): e.g. 0.35 for 0.35% of current price.
-Reward/Risk Ratio: e.g. 1.1 for a modest profit target above your stop.
-Max OR Retracement %: e.g. 50 to set stop at 50% of range width.
-One Trade Per Day: toggle to limit to a single breakout.
-Reverse on Stop Loss: toggle to flip direction after a losing breakout.
Monitor the Chart
-Watch the green and red range boundaries form during the session open.
-Orders will automatically submit on the first bar after the range window closes, conditioned on your filters.
Review & Adjust
-Backtest across multiple months to validate performance on your preferred contract.
-Tweak range duration, minimum width, and R/R multiple to fit your risk tolerance and desired win‑rate vs. expectancy balance.
█ Settings Reference
Input Defaults
Opening‑Range Window - Time window to form OR (HHMM-HHMM) - 0930–1015
Regular Trading Day - Full session for EOD flat (HHMM-HHMM) - 0930–1545
Min. OR Width (%) - Minimum OR size as % of close to trigger orders - 0.35
Reward/Risk Ratio - Profit target multiple of stop‑loss distance - 1.1
Max OR Retracement (%) - % of OR width to use as stop‑loss distance - 50
One Trade Per Day - Limit to a single breakout order per day - false
Reverse on Stop Loss - Reverse direction immediately after a losing trade - true
Disclaimer
This strategy description and any accompanying code are provided for educational purposes only and do not constitute financial advice or a solicitation to trade. Futures trading involves substantial risk, including possible loss of capital. Past performance is not indicative of future results. Traders should assess their own risk tolerance and conduct thorough backtesting and forward-testing before committing real capital.
