Ichimoku Cloud and ADX with Trailing Stop Loss (by Coinrule)The Ichimoku Cloud is a collection of technical indicators that show support and resistance levels, as well as momentum and trend direction. It does this by taking multiple averages and plotting them on a chart. It also uses these figures to compute a “cloud” that attempts to forecast where the price may find support or resistance in the future.
The Ichimoku Cloud was developed by Goichi Hosoda, a Japanese journalist, and published in the late 1960s. It provides more data points than the standard candlestick chart. While it seems complicated at first glance, those familiar with how to read the charts often find it easy to understand with well-defined trading signals.
The Ichimoku Cloud is composed of five lines or calculations, two of which comprise a cloud where the difference between the two lines is shaded in.
The lines include a nine-period average, a 26-period average, an average of those two averages, a 52-period average, and a lagging closing price line.
The cloud is a key part of the indicator. When the price is below the cloud, the trend is down. When the price is above the cloud, the trend is up.
The above trend signals are strengthened if the cloud is moving in the same direction as the price. For example, during an uptrend, the top of the cloud is moving up, or during a downtrend, the bottom of the cloud is moving down.
DMI is simple to interpret. When +DI > - DI, it means the price is trending up. On the other hand, when -DI > +DI, the trend is weak or moving on the downside. The ADX does not give an indication of the direction but about the strength of the trend.
Typically values of ADX above 25 mean that the trend is steeply moving up or down, based on the -DI and +DI positioning. This script aims to capture swings in the DMI, and thus, in the trend of the asset, using a contrarian approach.
Trading on high values of ADX, the strategy tries to spot extremely oversold and overbought conditions. Values of ADX above 45 may suggest that the trend has overextended and is maybe about to reverse.
This strategy combines the Ichimoku Cloud with the ADX indicator to better enter trades.
Long orders are placed when these basic signals are triggered.
Long Position:
Tenkan-Sen is above the Kijun-Sen
Chikou-Span is above the close of 26 bars ago
Close is above the Kumo Cloud
MACD line crosses over the signal line
-DI is greater than +DI
ADX is greater than 45
Close Position:
3% increase trailing
3% decrease trailing
The script is backtested from December 2022 and provides good returns.
A trading fee of 0.1% is also taken into account and is aligned to the base fee applied on Binance.
스크립트에서 "bands"에 대해 찾기

supertrend with multiple filter strategythis indicator filters buy and sell signal from the supertrend base on various condition that the user can manually select.
as of now the following filter are included
buy and sell filter;
-Macd
-CCI
-EMA200
-LUX TRAMA
-Stochastic rsi
-MFI
EXIT SIGNAL CAN BE CHOSE BETWEEN ATR BAND OR BOLLINGER BAND
i am planning on keeping to add filters so if you have suggestion fell free to message me.
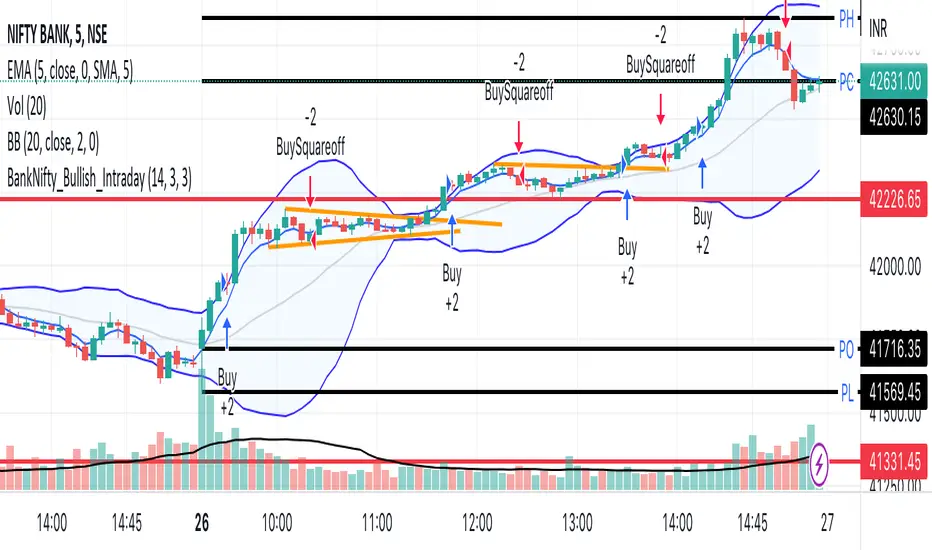
BankNifty_Bullish_Intraday
The script uses following mechanism to give a signal of BUY if multiple parameters evaluated are all passed.
ENTRY-
1. 5 min MACD should be more than its previous tick
2. 15 min MACD should be more than its previous tick
3. 60 min MACD should be more than its previous tick
4. ADX should be more than 12
5. RSI should be more than 60
6. Stochastic %k should have cross over with %d
7. Bollinger band upper band value should be more than previous tick
EXIT
If the 5 min bar price closes below 5 min EMA , it gives an exit signal.
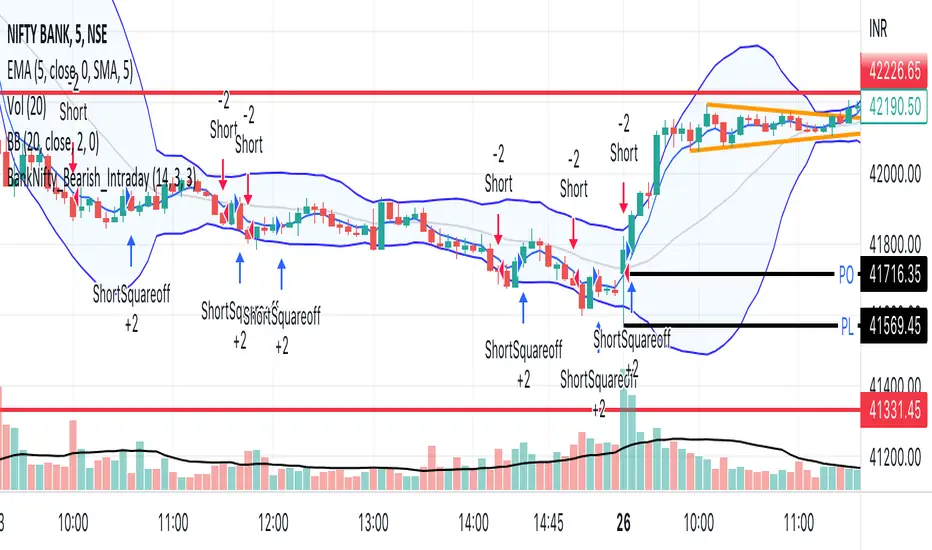
BankNifty_Bearish_Intraday
The script uses following mechanism to give a signal of SELL if multiple parameters evaluated are all passed.
ENTRY-
1. 5 min MACD should be less than its previous tick
2. 15 min MACD should be less than its previous tick
3. 60 min MACD should be less than its previous tick
4. ADX should be more than 12
5. RSI should be less than 40
6. Stochastic %k should have negative cross over with %d
7. Bollinger band lower band value should be less than previous tick
EXIT
If the 5 min bar price closes above 5 min EMA , it gives an exit signal.
M0PB (Momentum Pullback)Long/short strategy that identifies extreme readings on the rsi as a *momentum signal*, unlike most RSI strategies the script will look to buy or sell the first pullback in the direction of the extreme RSI reading.
Enters positions on the first pullback to the 5ema(low)/ 5ema(high) and exits at rolling 12 bar high/ low. The rolling high/ low feature means that if the price enters into a prolonged consolidation the profit target will begin to reduce with each new bar. The best trades tend to work within 2-6 bars.
Built for use on 5 min intervals on FX, Indexes, and Crypto. Lower than 5 minute time frames tend to be noisier and mean more commissions and a higher risk of slippage so the suggested timeframe is 5 mins.
Hard stop is X ATR (users can experiment with this) from the position entry price. This can be adjusted in user inputs.
There is a lot of slack left in entries and exits but the overall strategy is fairly robust across timeframes and markets and has between 60%-70% win rate with larger winners.
Signals that occur from economic news volatility are best avoided.

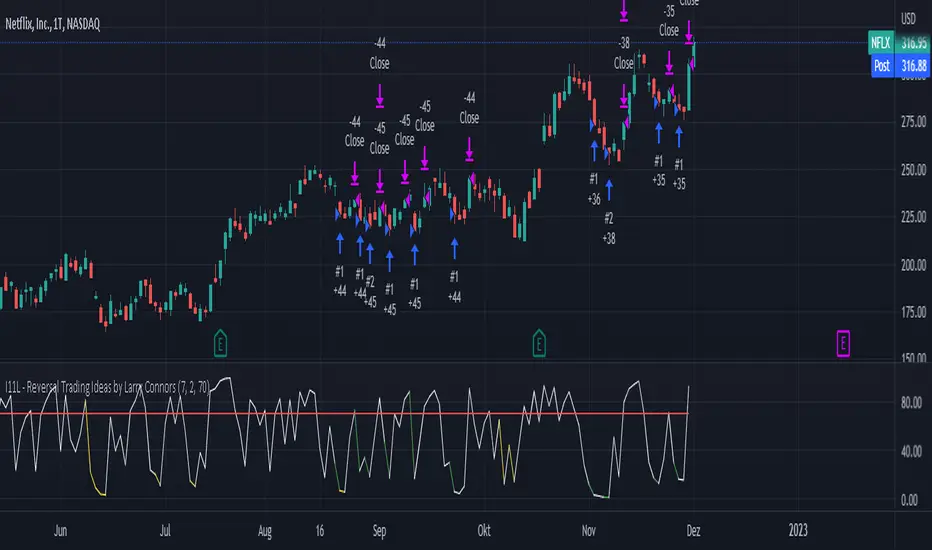
I11L - Reversal Trading Ideas by Larry ConnorsThis is my own Twist on Larry Connors Simple Tradingideas.
It Combines the RSI, Averaging In and the Lowest Bars in a Single System.
The current Configuration is designed for the Daily Timeframe.
Feel free to play with the Parameters and keep in mind that Larry Intended to buy fear and sell the greed!
The Rules are the following:
---Buy---
Buy, if the lowest Bar of your Configuration has been hit (default is set to 7).
---Average Down--
Buy, if the lowest Bar of your Configuration * Your open trades has been hit AND only if the buyin is atleast 1% cheaper.
---Close---
Close, if the RSI closes above a certain level (default is set to 70).
---TP---
There is no TP
---SL---
There is no SL, so be cautions of your tail Risk!
Bollinger Band strategy with split, limit, stopEntering a short position after breaking the upper Bollinger Band, entering a long position when entering after breaking the lower Bollinger Band
Provides templates for how to display position average price, stop loss, and profit price using the plot function on the chart, and how to buy splits
After entering the position, if the price crosses the mid-band line, the stop loss is adjusted to the mid-band line.

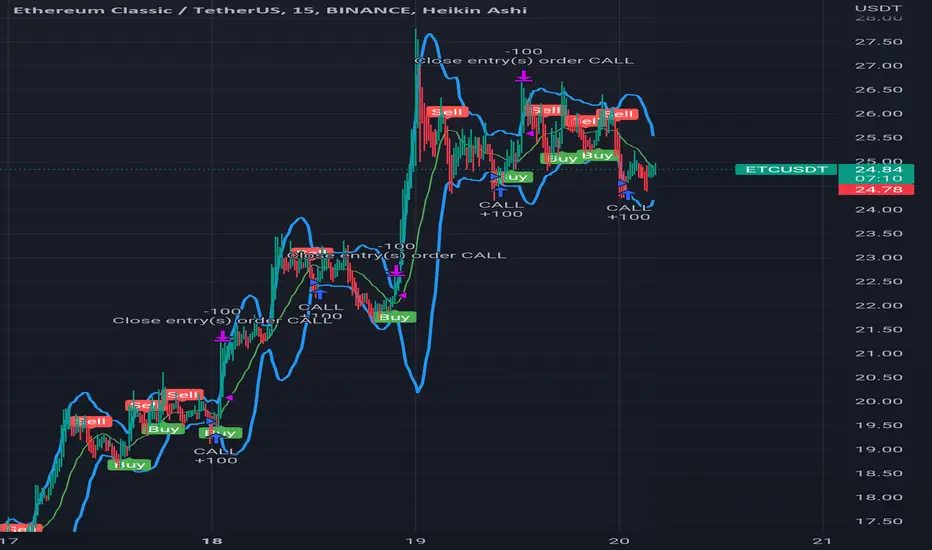
Heikin Ashi SupertrendAbout this Strategy
This supertrend strategy uses the Heikin Ashi candles to generate the supertrend but enters and exits trades using normal candle close prices. If you use the standard built in Supertrend indicator on Heikin Ashi candles, it will produce very unrealistic backtesting results because it uses the Heikin Ashi prices instead of the real prices. However, by signaling the supertrend reversals using Heikin Ashi while using standard candle close prices for the entries and exits, it corrects the backtesting errors and gives you a more realistic equity curve. You should set the chart to use standard candles and then hide them (the strategy creates the candles).
This strategy includes:
Plotting of Heikin Ashi candles
Heikin Ashi Supertrend
Long and Short Entry Signals
Move stop loss after trade is X% in profit
Profit Target
Stop Loss
Built in Alertatron automation
Alertatron Trade Automation Integration
For Alertatron integration, be sure to configure the strategy settings and "Enable Webhook Messages" before creating an alert with {{strategy.order.alert_message}} in the body of your alert message. Be sure to enable webhooks and point it to your Incoming Alertatron webhook URL.
Notes
While this strategy does pretty well during trending markets, It's worth noting that the Buy and Hold ROI is much better during peak times of the bull market
Not financial advice. Do not risk more than you can afford to lose.

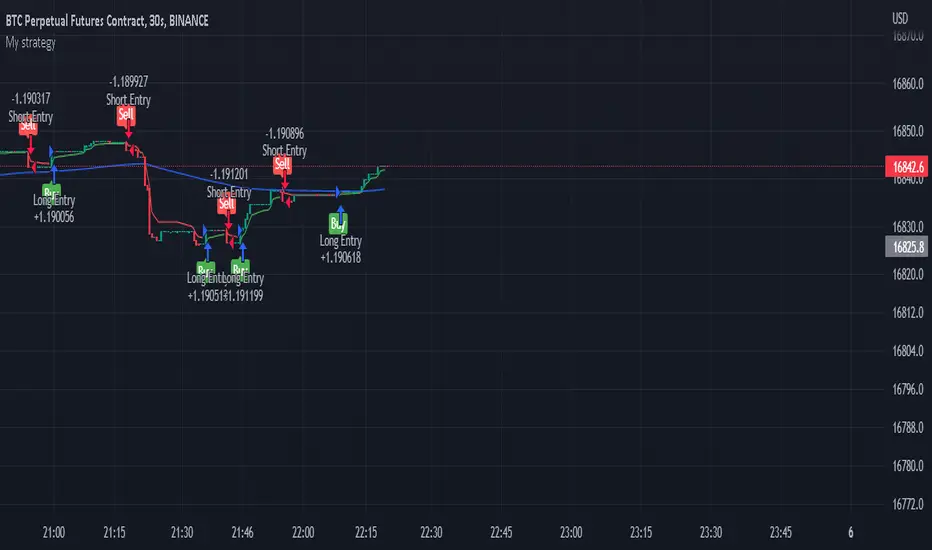
[Sniper] SSL Hybrid + QQE MOD + Waddah Attar StrategyHi. I’m DuDu95.
**********************************************************************************
This is the script for the series called "Sniper".
*** What is "Sniper" Series? ***
"Sniper" series is the project that I’m going to start.
In "Sniper" Series, I’m going to "snipe and shoot" the youtuber’s strategy: to find out whether the youtuber’s video about strategy is "true or false".
Specifically, I’m going to do the things below.
1. Implement "Youtuber’s strategy" into pinescript code.
2. Then I will "backtest" and prove whether "the strategy really works" in the specific ticker (e.g. BTCUSDT) for the specific timeframe (e.g. 5m).
3. Based on the backtest result, I will rate and judge whether the youtube video is "true" or "false", and then rate the validity, reliability, robustness, of the strategy. (like a lie detector)
*** What is the purpose of this series? ***
1. To notify whether the strategy really works for the people who watched the youtube video.
2. To find and build my own scalping / day trading strategy that really works.
**********************************************************************************
*** Strategy Description ***
This strategy is from "SSL QQE MOD 5MIN SCALPING STRATEGY" by youtuber "Daily Investments".
"Daily Investments" claimed that this strategy will make you some money from 100 trades in any ticker in 5 minute timeframe.
### Entry Logic
1. Long Entry Logic
- close > SSL Hybrid Baseline.
- QQE MOD should turn into blue color.
- Waddah Attar Explosion indicator must be green.
2. Short Entry Logic
- close < SSL Hybrid Baseline
- QQE MOD should turn into red color.
- Waddah Attar Explosion indicator must be red.
### Exit Logic
1. Long Exit Logic
- When QQE MOD turn into red color.
2. Short Entry Logic
- When QQE MOD turn into blue color.
### StopLoss
1. Can Choose Stop Loss Type: Percent, ATR, Previous Low / High.
2. Can Chosse inputs of each Stop Loss Type.
### Take Profit
1. Can set Risk Reward Ratio for Take Profit.
- To simplify backtest, I erased all other options except RR Ratio.
- You can add Take Profit Logic by adding options in the code.
2. Can set Take Profit Quantity.
### Risk Manangement
1. Can choose whether to use Risk Manangement Logic.
- This controls the Quantity of the Entry.
- e.g. If you want to take 3% risk per trade and stop loss price is 6% below the long entry price,
then 50% of your equity will be used for trade.
2. Can choose How much risk you would take per trade.
### Plot
1. Added Labels to check the data of entry / exit positions.
2. Changed and Added color different from the original one. (green: #02732A, red: #D92332, yellow: #F2E313)
3. SSL Hybrid Baseline is by default drawn on the chart.
4. If you check EMA filter, EMA would be drawn on the chart.
5. Should add QQE MOD and Waddah Attar Explosion indicator manually if you want to see QQE MOD.
**********************************************************************************
*** Rating: True or False?
### Rating:
→ 1.5 / 5 (0 = Trash, 1 = Bad, 2 = Not Good, 3 = Good, 4 = Great, 5 = Excellent)
### True or False?
→ False
→ Doesn't Work on 5 minute timeframe. Also, it doesn't work on crypto.
### Better Option?
→ Use this for Day trading or Swing Trading, not for Scalping. (Bigger Timeframe)
→ Although the result was bad at 5 minute timeframe, it was profitable in 1h, 2h, 4h, 8h, 1d timeframe.
→ BTC, ETH was ok.
→ The result was better when I use EMA filter (only on longer timeframe).
### Robust?
→ So So. Although result was bad in short timeframe (e.g. 30m 15m 5m), backtest result was "consistently" profitable on longer timeframe.
→ Also, MDD was not that bad under risk management option on.
**********************************************************************************
*** Conclusion?
→ Don't use this on short timeframe.
→ Better use on longer timeframe with filter, stoploss and risk management.

Trend #4 - ATR+EMA channelOverview:
This strategy use ATR to take-profit, Red-EMA to stop-loss, Blue-EMA channel to judgment breakout.
This strategy use commission setting is 0.05%, slippage setting is 2 ticks, you can set the appropriate value size in the properties page.
What it does:
This strategy detects when a trend is emerging and buy or sell.
How it does it:
When the price breaks through the blue EMA channel, the trend is judged to be strong in the short term, strategy generates a buy or sell order.
After buying or selling,, if the price moves in the expected direction, uses ATR to determine the appropriate spread to take profit, otherwise use red EMA for stop loss.
How to use it:
Start Date and Stop Date - This parameter adjusts the time range used by the strategy.
Stoploss - This parameter adjusts the stop loss amount after each order is placed.
Blue EMA length - This parameter adjusts the length of the channel.
Blue EMA multy - This parameter adjusts the width of the top and bottom of the channel.
ATR Period - This parameter adjusts the number of candles used by the ATR.
ATR mult - This parameter adjusts the upper and lower widths of the ATR. Lowering this parameter can improve the win rate, but not necessarily the profitability.
Red EMA length - This parameter adjusts the number of candles used by the red EMA .
Long - This switch is used to turn Long position on or off.
Short - This switch is used to turn short position on or off.

[DuDu95] SSL 4C MACD Laugerre RSI StrategyHello Guys! Nice to meet you all!
Before I start, my nickname has changed to 'DuDu95'!!
This is the Strategy introduced by youtube channel.
I made this based on the open source indicator by kevinmck100, vkno422, KivancOzbilgic. Thank you All!
### Entry Logic
1. Long Entry Logic
- close > SSL Hybrid baseline upper k (keltner channel)
- macd signal > 0 and current MACD value > previous MACD value
- Laguerre RSI < overbought Line.
2. short Entry Logic
- close < SSL Hybrid baseline lower k (keltner channel)
- macd signal < 0 and current MACD value < previous MACD value
- Laguerre RSI > overbought Line.
### Exit Logic
1. Long Exit Logic
- close < SSL Hybrid baseline lower k (keltner channel)
- macd signal < 0
2. short Entry Logic
- close > SSL Hybrid baseline upper k (keltner channel)
- macd signal > 0
### StopLoss
1. Can Choose Stop Loss Type: Percent, ATR, Previous Low / High.
2. Can Chosse inputs of each Stop Loss Type.
### Take Profit
1. Can set Risk Reward Ratio for Take Profit.
- To simplify backtest, I erased all other options except RR Ratio.
- You can add Take Profit Logic by adding options in the code.
2. Can set Take Profit Quantity.
### Risk Manangement
1. Can choose whether to use Risk Manangement Logic.
- This controls the Quantity of the Entry.
- e.g. If you want to take 3% risk per trade and stop loss price is 6% below the long entry price,
then 50% of your equity will be used for trade.
2. Can choose How much risk you would take per trade.
### Plot
1. Added Labels to check the data of entry / exit positions.
2. Changed and Added color different from the original one. (green: #02732A, red: #D92332, yellow: #F2E313)

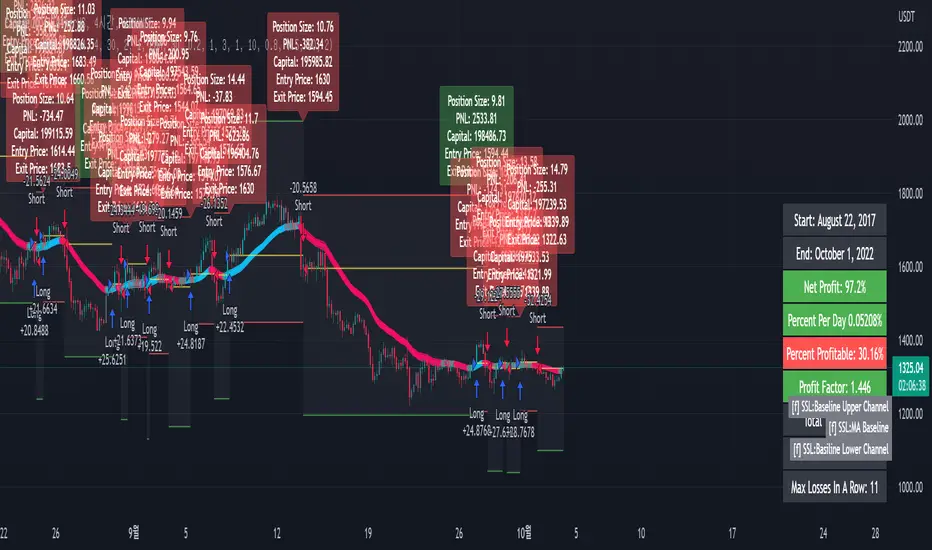
[fpemehd] SSL Baseline StrategyHello Guys! Nice to meet you all!
This is my third script!
This Logic is trend following logic, This detects long & short trends based on SSL Hybrid Baseline.
This fits to the longer time frame like 4hr and 1d.
### Long Condition
1. close > SSL Hybrid baseline upper k
- Baseline is the ma of close price. (You can choose ma type and length)
- Upper k is the upper Keltner Channel.
### Short Condition
1. close < SSL Hybrid baseline lower k
- Baseline is the ma of close price. (You can choose ma type and length)
- Lower k is the lower Keltner Channel.
### Etc
1. Added Stoploss based on highest high or lowest low with lookback.
2. Strategy Template is based on @kevinmck100 template. Thank you!
supertrend advanceHELLO FRIENDS ...............THIS IS SUPERTREND ADVANCE WITH HENKIASHI CANDLE ...I got so many request on supertrend with henkiashi. This is for all of them ..I am making it open for all so you can change its coding according to your need
SOME IMPONTENT UPDATE IN THIS SUPERTRNED
1) You Can Use It for option trading ...you can do algo option trading using this strategy
2) YOU CAN USE CUSTOME SYNTAX TO ALGO TRADE IN STOCK,FOREX,COMMODITY AND CRYPTO
3) YO CAN USE IT IN INTRADAY TIME PERIOD ALSO U CAN SET ITS ENTRY AND EXIT TIME
4) YOU CAN USE HENKIASHI SUPERTREND ON NORMAL CANDLE STICK CHART
5) YOU CAN USE ITS QUNTITY FEATURE .BY THIS WAY U CAN DOUBLE YOUR QUNTITY SIZE ON LOSSING TRADE AND WHEN PROIFT TRADE OCCUR ITS QUNTITY AGAIN AUTOMATICALLY SHIFTED TO NORMAL QUNTITY ....THIS FEATURE ONLY HELP TRADER WITH MORE MARGIN....USE THIS FEATURE PROPERLY.THIS FEATURE BEST WORK ON ONE SIDE MEANS ONLY BUY SIDE TRADE OR SELL SIDE TRADE
6)YOU CAN SET YOUR TARGET AND STOPLOSS IN POINTS AND IN PERCENTAGE
7) YOU CAN CHOSE ONE SIDE TO TRADE ONLY BUY SIDE OR SELL SIDE
HOPE THIS FEARTURES HELPS EVERY ONE
ALL THE BEST FOR SUCESSFULL TRADING

HHLL Strategy This is simple Highest high and Lowest low strategy.
Buy when break HH+offset
Sell when break LL+offset
Offset = (HH-LL)/2

Consolidation Breakout [Indian Market Timing]OK let's get started ,
A Day Trading (Intraday) Consolidation Breakout Indication Strategy that explains time condition for Indian Markets .
The commission is also included in the strategy .
The basic idea is ,
1) Price crosses above upper band , indicated by a color change (green) is the Long condition .
2) Price crosses below lower band , indicated by a color change (red) is the Short condition .
3) ATR is used for trailing after entry
// ═══════════════════════════════//
// ————————> TIME CONDITION <————————— //
// ═══════════════════════════════//
The Indian Markets open at 9:15am and closes at 3:30pm.
The time_condition specifies the time at which Entries should happen .
"Close All" function closes all the trades at 2:57pm.
All open trades get closed at 2:57pm , because some brokers dont allow you to place fresh intraday orders after 3pm.
NSE:NIFTY1!
// ═══════════════════════════════════════════════ //
// ————————> BACKTEST RESULTS ( 114 CLOSED TRADES )<————————— //
// ═══════════════════════════════════════════════ //
LENGTH , MULT (factor) and ATR can be changed for better backtest results.
The strategy applied to NIFTY (3 min Time-Frame and contract size 5) gives us 60% profitability , as shown below
It was tested for a period a 8 months with a Profit Factor of 2.2 , avg Trade of 6000Rs profit and Sharpe Ratio : 0.67
The graph has a Linear Curve with consistent profits.
NSE:NIFTY1!
Save it favorites.
Apply it to your charts Now !!
Thank me later ;)

Mou Value AreasUse in CORRELATION with KEY AREAS - its only CONFIRMATION tool
May ONLY BUY when its GREEN and ONLY SELL when RED
Helps prevent buying the top and selling the bottom.
Good for showing pullbacks during strong trends.

Buy/Sell Signal Template/Boilerplate Strategy [MyTradingCoder]This script allows the user to connect an external indicator output/plot value to allow for a no-code solution to setup a simple buy/sell signal strategy. For those of you who do not know how to program, do not be intimidated as this is a very easy setup process.
Maybe you want to buy when the 'RSI' value drops below '30' and then sell when the 'RSI' value climbs above '70', but you don't want to code it. You can do that with this indicator along with thousands of others found on the free TradingView indicator library.
Step #1:
Put the strategy on the chart.
Step #2:
Apply a secondary indicator onto the chart, such as an RSI .
Step #3:
Open the strategy settings and change the source to the RSI
Step #4:
Change the 'Signal Settings' to match when you want a buy, or a sell. For example, if you want to get a buy signal when the RSI crosses above 50, and get a sell when it crosses below 50, set the 'buy value' to 50, and the 'buy type' to greater than, then set the 'sell value' to 50 and the 'sell type' to less than. BOOM! It works :)

Ok signalPlz add this is very true signal is liye ni no Kuni to ni no Kuni to ni no Kuni to ni no Kuni to ni no Kuni to ni no Kuni to ni no Kuni is love you ❤️🥀 Congratulations to e iqball WEs e eW to
DELAYED FIBOfibo delayed and real value wave design. Burada bandlar arası dalgalanmadan faydalanılmakta.

Chande Kroll Stop今天和大家分享Chande Kroll Stop 回测, 信号采用了上限线和下限线共通反向趋势而决定买卖信号,如果有新的构思能提高买卖信号欢迎在留言区发表你的建议,祝你交易开心!

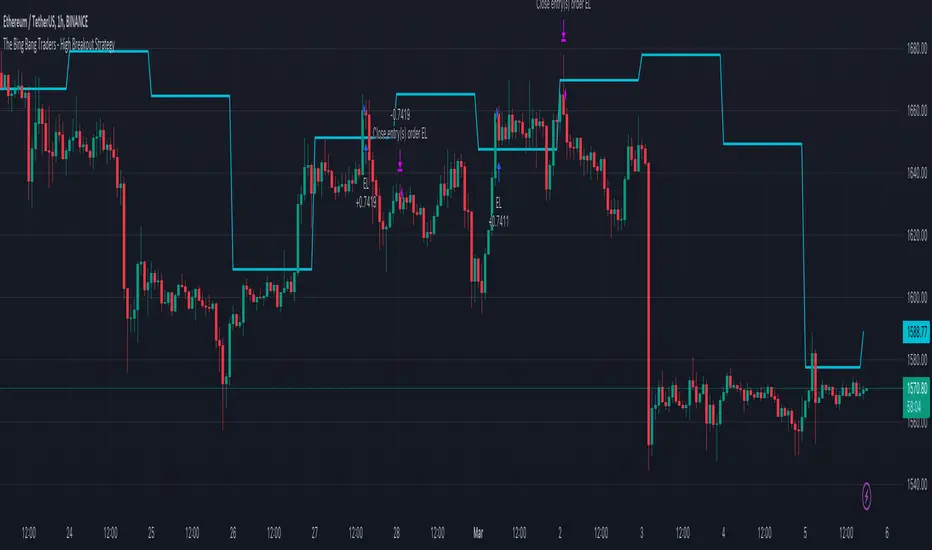
TheBigBangTraders BreakoutName: TheBigBangTraders Breakout
Category: Trend Follower
Operating mode: Spot
Trades duration: Intraday
Timeframe: 1H
Suggested usage: the purpose of this strategy is to help to investigate if the asset is sensitive to breakout approach.
Entry: Trigger point can be choose by the user between:
High of the N days ago
High of the N weeks ago
Exit: End of Day
Usage:
⁃ It can be useful to use this script to test the behaviour of a definite asset
⁃ This is a raw system that can be considered a base to realize a complete breakout strategy
Configuration:
- N/A
Backtesting
⁃ Exchange: BINANCE
⁃ Pair: ETHUSDT
⁃ Timeframe: !H
⁃ Fee 0.075%
⁃ Slippage 0
- Start : 2020-01-03
How you or we can improve? Source code is open so share your ideas!
Buy/Sell on the levelsThis script is generally
My describe is:
There are a lot of levels we would like to buy some crypto.
When the price has crossed the level-line - we buy, but only if we have the permission in array(2)
When we have bought the crypto - we lose the permission for buy for now(till we will sell it on the next higher level)
When we sell some crypto(on the buying level + 1) we have the permission again.
There also are 2 protect indicators. We can buy if these indicators both green only(super trend and PIVOT )
Jun 12
Release Notes: Hello there,
Uncomment this section before use for real trade:
if array.get(price_to_sellBue, i) >= open and array.get(price_to_sellBue, i) <= close// and
//direction < 0 and permission_for_buy != 0
Here is my script.
In general - this is incredible simple script to use and understand.
First of all You can see this script working with only long orders, it means we going to get money if crypto grows only. Short orders we need to close the position on time.
In this script we buy crypto and sell with step 1% upper.
You can simply change the step by changing the price arrays.
Please note, if You want to see where the levels of this script is You Have to copy the next my indicator called LEVEL 1%
In general - if the price has across the price-level we buy some crypto and loose permission for buying for this level till we sell some crypto. There is ''count_of_orders" array field with value 2. When we bought some crypto the value turns to 0. 0 means not allowed to by on this level!!! The script buy if the bar is green only(last tick).
The script check every level(those we can see in "price_to_sellBue" array).
If the price across one of them - full script runs. After buying(if it possible) we check is there any crypto for sell on the level.
We check all levels below actual level( of actual level - ''i'' than we check all levels from 0 to i-1).
If there is any order that has value 0 in count of orders and index <= i-1 - we count it to var SELL amount and in the end of loop sell all of it.
Pay attention - it sells only if price across the level with red bar AND HAS ORDERS TO SELL WHICH WAS BOUGHT BELOW!!!
In Strategy tester it shows not-profitables orders sometimes, because if You have old Long position - it sells it first. First in - first out.
If the price goes down for a long time and You sell after 5 buys You sell the first of it with the highest value.
There is 2 protection from horrible buying in this strategy. The first one - Supertrend. If the supertrend is red - there is no permission for buy.
The second one - something between PIVOT and supertrend but with switcher.
If the price across last minimum - switcher is red - no permission for buy and the actual price becomes last minimum . The last maximum calculated for last 100 bars.
When the price across last maximum - switcher is green, we can buy. The last minimum calculation for last 100 bars, last maximum is actual price.
This two protections will save You from buying if price get crash down.
Enjoy my script.
Should You need the code or explanation, You have any ideas how to improve this crypt, contact me.
Vladyslav.
Jun 12
Release Notes: Here has been uncommented the protection for buy in case of price get down.
5 hours ago
Release Notes: Changed rages up to actual price to make it work

BUY/SELL on the levels onlyMy discribe is:
There ara a lot of levels we would like to buy some crypto.
When the price has acrossed the level-line - we buy, but only if we have the permission in array(2)
When we have bought the crypto - we lose the permission for buy for now(till we will sell it on the next hiegher level)
When we sell some crypto(on the buying level + 1) we have the permission again.
There also are 2 protect indicators. We can buy if these indicators both green only(supertrend and PIVOT)
