스크립트에서 "KELTNER"에 대해 찾기

Moving Average with Multiplier [aamonkey]Moving Average with the possibility to modify the length and the multiplicator.
That way it is possible to move the MAs up or down creating your own Bollinger Bands / Keltner channel type of indicator.

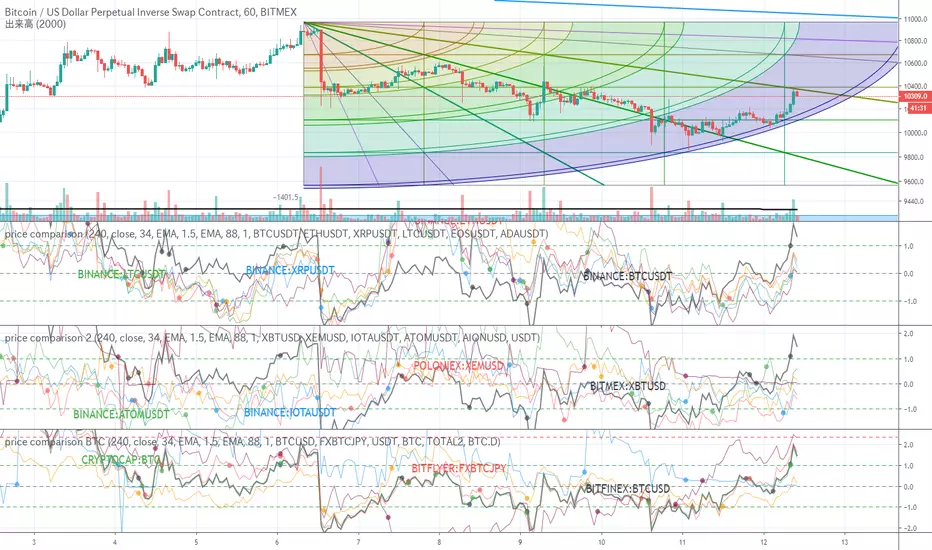
price comparisonI wanted to compare multiple prices, so I created it.
The price of 6 can be compared at once.
Since simply different ones cannot be compared, the Keltner channel is made into an oscillator and compared.
I added an alert that broke the Bollinger Band.
複数の価格比較をしたかったので、作成しました。
6個の価格が一気に比較できます。
単純に異なるものは比較できないので、ケルトナーチャンネルをオシレータ化して比較しています。
ついでにボリンジャーバンドをブレイクしたアラートを付けておきました。
APEX - Moving Averages [v1]A moving average is the most known indicator that takes into consideration price from the last several periods of the price and calculates a smoothed line also known as a Moving average. This way you will cut out a lot of the noise and have a different view.
The most common usage is the moving average crossover system when you buy and sell when a crossover happens. This system is in general not very profitable but can be used effectively in trending markets.
There is really no general rule to what length should be used. The most well-known and respected lengths are 20 / 50 / 100 / 200 for almost all average. These values are respected as strong resistance and support levels. but if you plan to use a crossover Systems the most profitable settings tend to be when the averages are close together 14 and 28 etc. But this is an area I would appeal to for you to really try out what works and what does not.
Other uses of moving averages are the following:
Crossover system
Moving averages are pointing up and price crosses below (Buy Pullback)
The slow-moving average is Below the fast moving average to help to identify possible bullishness
Can be used as support and resistance lines
If you are an advanced user you may want to try out the following techniques:
Create your own moving average by combining several of those together with the source function
Using the Average True Range to create Keltner Channels
Using Standard deviation to create Bollinger bands (Bollinger bands are also accessible on their own)
You can use Moving averages to smooth the noise on other indicators such as RSI / CCI / MFI
Fund Tracking Error EnvelopeUse this channel to help control your emotional buying. You can follow the lead of the Mutual Funds & other Institutions. Institutions will buy between the MA and the upper band, but will slow or stop approaching the upper band. They will sell below the MA but not below the lower band. If ranging between the MA and the lower band they will start raising cash in anticipation of redemptions. Works best with a separate 50 SMA overlaying the centerline. This is a simple percentage offset envelope, not a Bollinger Band, Keltner Channel or Standard Deviation Channel.
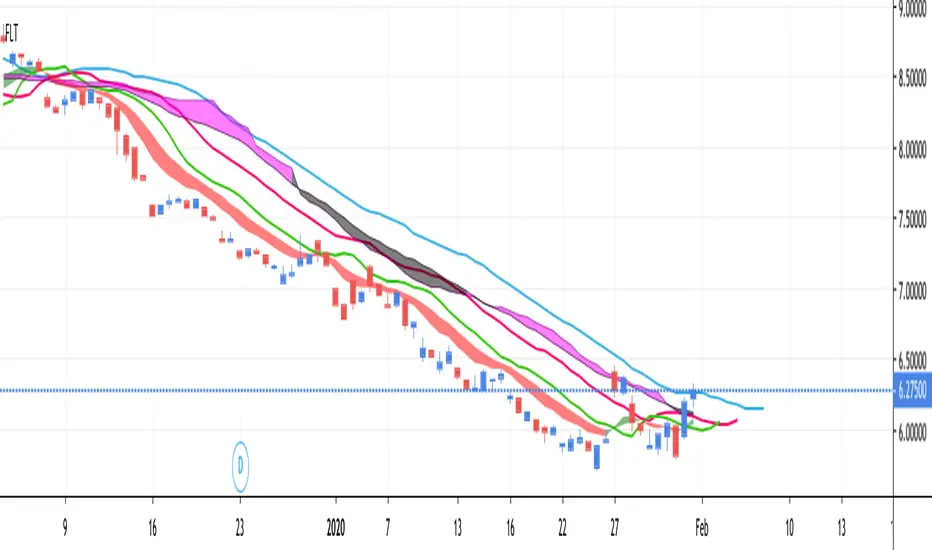
FLT - Fully Loaded TacoThis is a very full indicator.
NOTICE: By default, ALL indicators are turned off in the settings, except for the Bollinger Band, in order to facilitate faster load times.
Features can easily be turned on/off in the settings. You can have as many or as few as you want.
FEATURE LIST:
3 SMAs (Fast, Medium, Slow)
3 EMAs (Fast, Medium, Slow)
Support & Resistance Lines (Lime Color)
Parabolic Support & Resistance (Red dots above, Blue dots below)
Keltner Channel (purple channel lines)
Bollinger Band (Blue Cloud; Center & Borders hidden by default)
TTM Squeeze (Purple Background Color on Chart)
VWAP (Vibrant Blue Glowing Line, Intraday Only)
Fibonacci Retracement (Multicolor, Intraday Only)
Ichimoku Cloud (Standard Colors)
Percentile Trend Channel [DW]This is an experimental study designed to identify the trend of price action over a specified period using percentiles.
First, the 50th percentile is calculated over the sampling period using the nearest rank method. I've found that this calculation is useful as a proxy for moving averages and other filters of that class.
Next, the channel levels are calculated. In this study, there are three channel methods to choose from:
-Percentile Donchian, which calculates Donchian Channels using the 100th and 0th percentile ranks
-Percentile Keltner, which calculates the 50th percentile true range multiplied by a specified amount, then adds it to and subtracts it from the 50th percentile
-Percentile Bollinger, which calculates 50th percentile standard deviation multiplied by a specified amount, then adds it to and subtracts it from the 50th percentile
I also included a squeeze box option within this script, which is derived from my original Squeeze Box tool.
This option detects squeezes in the specified channel's range by a specific percentage, and plots the channel values where the squeeze begins.
The box also has a range multiplier, which can be used to expand or contract its range.
Custom bar colors are included. The color scheme is based on the perceived trend over the specified sampling period.

Donchian Channel with Range AdditionA Donchian Channel with additional zones at places where its range is smaller than a set amount of atr. Thus it kind of combines with Keltner Channel qualities. Purpose is to set a stop loss wide enough to avoid shaking out of a position. The example chart shows a Philips day chart, where I opened position on 16 juli at 37,50 and set the stop loss at low border level 35,60, on 23 juli was an earnings rapport, the wick of the candle shows that quotes went very low, obviously smart traders had to fill a huge order and hunted for stops, triggering my stop closing the position. next days quotes went a lot better, so I missed the fun. The Donchian Channel was too narrow because quotes had ranged in the previous weeks. If I had placed my stop on the additional low, setting it 5 atr below the high border, my stop would have been safe.

BolBand & Keltner Squeeze with fillCan't be bothered adding it at the moment, but I like to turn the second set of bol bands off and decrease the transparency of the orange and red plot to make the squeezes stand out a bit more.

Index Adaptive Keltner Channels [DW]This study is an experiment in adaptive filtering. The process in this study was inspired by KAMA and ZLEMA filtering techniques.
First, data is given an optional modification for lag reduction.
Then, an adaptive filter of your choice is calculated. There are 6 different adaptive filters to choose from in this study:
-Commodity Channel Index Adaptive Moving Average (CCIAMA)
-Relative Strength Index Adaptive Moving Average (RSIAMA)
-%R Adaptive Moving Average (%RAMA)
-Klinger Volume Oscillator Adaptive Moving Average (KVOAMA)
-Money Flow Index Adaptive Moving Average (MFIAMA)
-Correlation Coefficient Adaptive Moving Average (CCAMA)
Next, ATR is calculated using the specified adaptive filter.
A set of ranges is calculated by multiplying ATR by the square root of the sampling period, then dividing it by 2 and 4.
And Finally, the ranges are added to and subtracted from the adaptive filter to generate the channels.
Custom bar colors are included. The formula for the color scheme is based on filter direction and price.

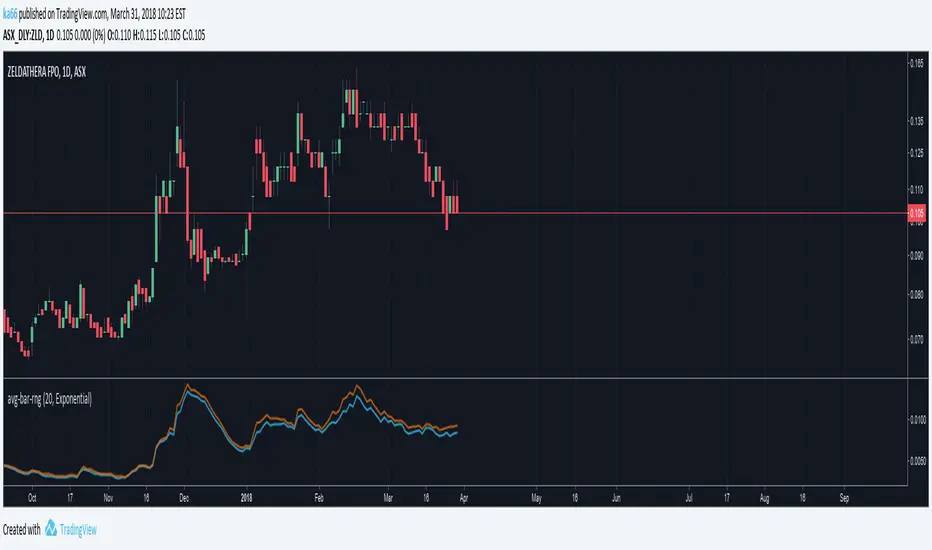
ka66: Average Bar RangeAverages price ranges (high - low) across a set of bars in a given timeframe. Additionally, also plots the Average True Range (ATR) as a better comparison for volatility.
Configurable period and averaging mechanism.
Useful for gauging minimum profits and price movement over a period, a filter for historical volatility.
Furthermore, executing trades is better done with channels like ATR/Keltner channels, or Bollinger Bands.
Ethan BB and KC Script - Antarticafor 4h chart, based on bollinger and keltner channels. For BTC only

Bollinger Band Ribbon R1.0 by JustUncleLThis study is a Bollinger Band indicator that shows the fractional stddev levels between the main bands. You can choose upto 6 Stddev Main Levels (ie 6*StdDev), with 0,1,3,4, or 9 fractional levels.
Other options available are:
Use different MA types for Basis of Bollinger: SMA, EMA, WMA and VWMA are good choices.
Show previous days closing price.
Show Previous days High and Low prices.
Use Keltner Channel in place of Bollinger.

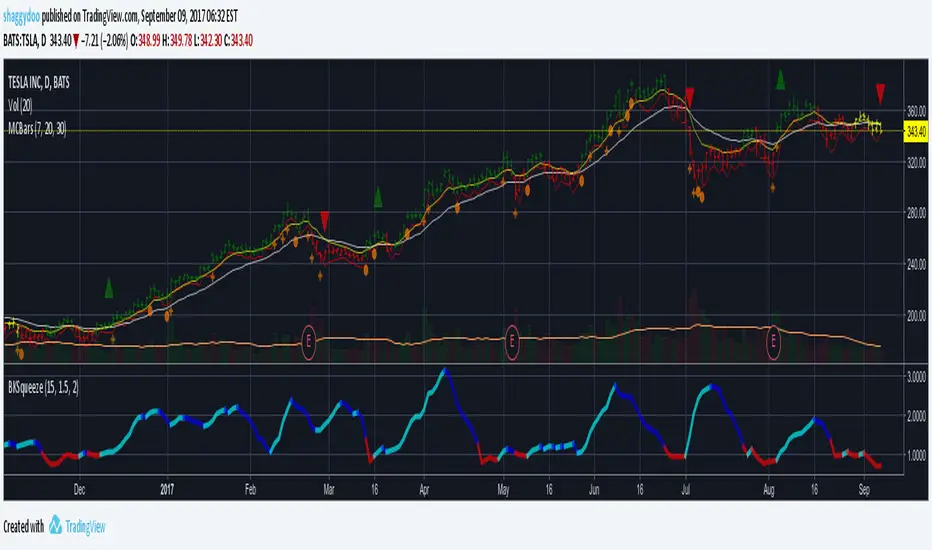
BKSqueezeThis is a price volatility compression and expansion indicator that uses the ratio of the Bollinger Band and Keltner Ratio.
Red segments indicate extreme price volatility compression that can be ideal entry points for stock/futures/forex and/or options positions.
Aqua segments indicate price volatility is expanding.
Blue segments indicate price volatility is compressing - can be used as an exit point or partial scale out point.
Note that the indicator doesn't indicate direction. One suggestion is to use the DMI indicator for this purpose - really depends on how early you enter the trade.
Suggest using a time period of 15 bars for volatile stocks, such as TSLA for example, otherwise a period of 20 bars suits most stocks/futures/forex symbols.
Price Action Channel Master by JustUncleLThis indicator combines a number of PAC types into one indicator and will replace some of my previously PAC scripts (some were not published).
It draws a Moving Average (MA) channel based on various boundary criteria. Even though the MA choices are not limited to SMA and EMA, these would be the your first choices with most PAC requirements, feel free to experiment though.
Optional Bar colouring around that channel.
Options Available:
(1) Select between 11 different types of moving averages for the base (centre) MA line choices are :
SMA = Simple Moving Average (default)
EMA = Exponential Moving Average.
WMA = Weighted Moving Average
VWMA = Volume Weighted Moving Average
SMMA = Smoothed Simple Moving Average.
DEMA = Double Exponential Moving Average
TEMA = Triple Exponential Moving Average.
HullMA = Hull Moving Average
SSMA = Ehlers Super Smoother Moving average
ZEMA = Near Zero Lag Exponential Moving Average.
TMA = Triangular (smoothed) Simple Moving Average.
(2) Select Channel Boundary Criteria:
HILO = Channel boundaries based on High and Low MAs (default).
ATR = Channel boundaries are Multiplier * ATR distance from base line
PIP = Channel boundaries are Multiplier * PIPs distance from base line
STDEV = Channel boundaries are Multiplier * StdDev(price) distance from base line (this is the same as Bollinger bands if SMA is the base MA)
KC = Channel boundaries are Multiplier * StdDev(True Range) distance from base line (this is the same as Keltner channel if SMA is the base MA)
(3) Option to display coloured Candles around the Ribbon, the colouring uses the Default candle 3-tone colour scheme:
Lime = candle closed above Ribbon.
Red = candle closed below Ribbon.
Gray = Candle Closed inside Ribbon.
The Grab candles 6-tone colour scheme:
Lime = Bull candle closed above Ribbon.
Green = Bear candle closed above Ribbon.
Red = Bull candle closed below Ribbon.
DarkRed = Bear candle closed below Ribbon.
Aqua = Bull candle closed inside Ribbon.
Blue = Bear candle closed inside Ribbon.

LBR Paintbars [LazyBear]
Added coloring of LB bars above/below Keltner Channel (as suggested by user @20813 below in the comments).
Updated code: pastebin.com
See comments section below for a sample chart. Copy the code from the pastebin above and update your local copy (TV doesn't allow me to update an already published code -- yet!).
Added features:
- Switch ON/OFF KC
- Mark LB bars above/below KC
----------------------------------------------------------------------
The LBR PaintBars indicator changes the colour of the price bars based on the trend direction (derived from price & volatility bands). This is mostly used as a confirmation indicator.
For the Pine coders: I suggest trying stdev() in lieu of atr()...some wild combinations can be derived from this simple idea :)
Indicator supports the following options:
- Switching on/off volatility bands
- Switching on/off LBR colors (lime/maroon).
- Color non-LBR bars (blue).
Thanks @mseaworthy for pinging me with this idea.
Complete list of my indicators:
-----------------------------
docs.google.com

Squeeze Momentum Indicator [LazyBear]
Fixed a typo in the code where BB multiplier was stuck at 1.5. Thanks @ucsgears for bringing it to my notice.
Updated source: pastebin.com
Use the updated source instead of the what TV shows below.
This is a derivative of John Carter's "TTM Squeeze" volatility indicator, as discussed in his book "Mastering the Trade" (chapter 11).
Black crosses on the midline show that the market just entered a squeeze (Bollinger Bands are with in Keltner Channel). This signifies low volatility, market preparing itself for an explosive move (up or down). Gray crosses signify "Squeeze release".
Mr.Carter suggests waiting till the first gray after a black cross, and taking a position in the direction of the momentum (for ex., if momentum value is above zero, go long). Exit the position when the momentum changes (increase or decrease --- signified by a color change). My (limited) experience with this shows, an additional indicator like ADX / WaveTrend, is needed to not miss good entry points. Also, Mr.Carter uses simple momentum indicator, while I have used a different method (linreg based) to plot the histogram.
More info:
- Book: Mastering The Trade by John F Carter
List of all my indicators:
