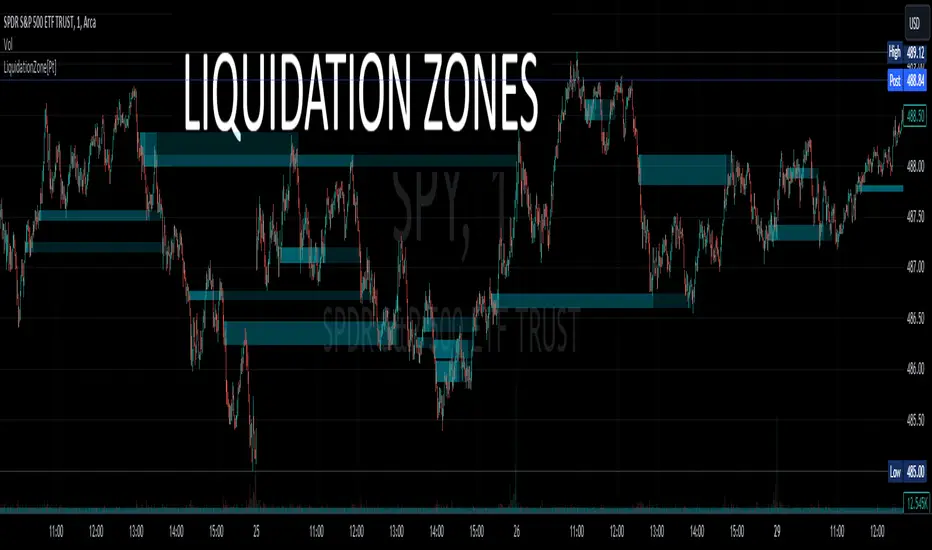
Liquidation Zone [Pt]█ Introduction
The Liquidation Zone indicator is designed to identify key price ranges where significant market activity, such as the liquidation of positions, is likely to occur. These zones are identified based on a specific candlestick pattern, offering insights into potential areas of market sensitivity.
█ Key Features:
► Specific Candlestick Pattern Identification: The indicator identifies liquidation zones by detecting a pattern where a red candle is encased within a series of green candles (in bullish scenarios) or a green candle within red candles (in bearish scenarios). This pattern often suggests a point where the market pauses to liquidate positions before continuing the prevailing trend.
► Market Reaction Points: These liquidation zones represent significant levels where the market previously decided to liquidate or adjust positions, indicating potential areas where price might react upon revisit.
► Integration with Volatility and Volume Data: The script combines these candlestick patterns with volatility (using ATR) and volume data, adding depth to the analysis and increasing the reliability of these zones as potential reaction areas.
► Visual Zone Mapping on Charts: Liquidation Zones are clearly marked on the trading chart for easy identification, aiding traders in visualizing these critical market areas.
█ Possible Use Cases
► Identifying Potential Reaction Areas
Traders can use the Liquidation Zone indicator to pinpoint zones where the market might pause or reverse due to previous liquidation activities. These areas can be key for planning entries, exits, or expecting increased market volatility.
► Enhancing Trading Strategy
Incorporating the analysis of liquidation zones into a trading strategy allows for a more nuanced understanding of market behavior, particularly in recognizing potential areas where price might experience significant support or resistance.
► Complementing Technical Analysis
This indicator is a valuable addition to a technical analyst's toolkit. When used alongside other analysis tools, it provides a more comprehensive view of the market, enhancing decision-making and strategy formulation.
Reversalpattern
Golden Swap (Zeiierman)█ Overview
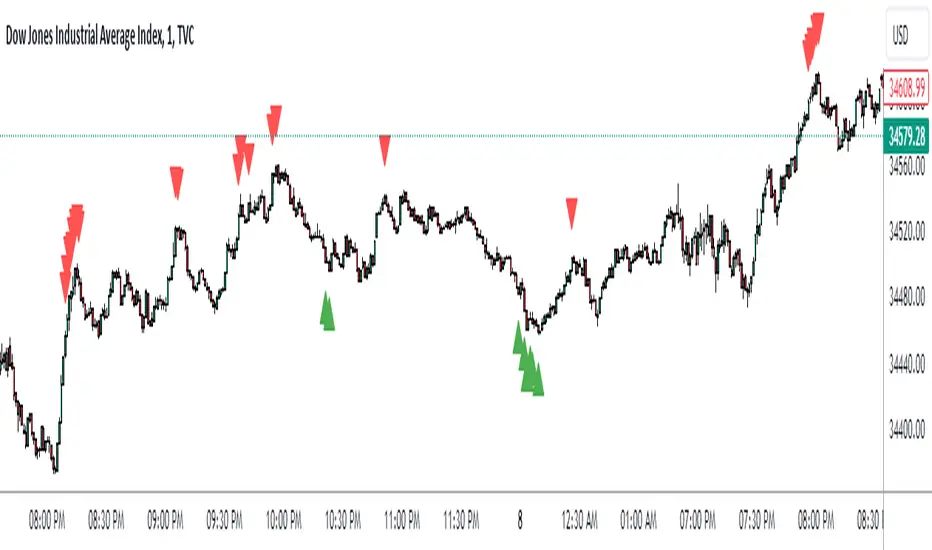
The Golden Swap indicator, as designed by Zeiierman, focuses on identifying reversal points around the key levels indicated by the indicator. This pattern works by analyzing the relationship between current and past price movements, considering factors like price symmetry, baseline boundaries, and precision pin bar formations. It can offer insights into potential market reversals, allowing for more precise entries and exits.
█ How It Works
Golden Swap Long
In a market with bullish momentum, we expect the price to dip a bit before it continues to rise again. This dip is like a small retreat in an overall march upwards. So, the pattern aims to assess whether the current period's dip is relatively shallow, indicating that the overall bullish momentum remains robust despite temporary price fluctuations.
Golden Swap Short
In a market with bearish momentum (indicating selling pressure or bearish sentiment), we may still see the price rise a bit before continuing its drop. This temporary rise is like a slight bounce in an overall downward movement. In simpler terms, even when the price bounces up a bit, it's not strong enough to overcome the recent pressure of selling. The sellers are still dominating, and the price will likely continue to drop.
█ The signal is reinforced by symmetry, BaselineBound criteria, and a bearish Precision PinBar.
⚪ Symmetry in Price Movements: The pattern uses the Symmetry Precision filter to analyze the symmetry of recent price movements. This helps in determining the likelihood of a reversal. A high degree of symmetry suggests a more reliable reversal signal.
⚪ BaselineBound Criteria: This component involves the BaselineBound Threshold, which acts as a filter to validate the strength of the potential reversal. Bullish and bearish conditions are assessed based on how the current close price compares to a calculated range around the high and low of the previous period.
⚪ Precision PinBar Analysis: The pattern also incorporates the Precision PinBar filter, which evaluates the characteristics of the recent price bars. A Precision PinBar is a candlestick with a small body and a long tail, indicating a potential reversal.
⚪ Display of Key Levels: The indicator can show Open, High, and Low levels for selected timeframes, helping traders identify key price points.
█ How to Use
The Golden Swap pattern is a valuable confirmation tool, particularly around key levels or session highs and lows. It highlights instances where a previous high or low has been respected, followed by a price reversal—flipping back up in an upward trend (Golden Swap Long) or flipping back down in a downward trend (Golden Swap Short). When this pattern emerges near a key level, it strongly suggests that the price will continue moving in the direction indicated by the current trend.
Consider it akin to a minor liquidity hunt above the previous high or below the previous low. The presence of the Golden Swap pattern, especially when aligned with other indicators and filters, enhances its reliability as a signal for the continuation of the prevailing market trend.
█ Settings
Timeframe Selection: Choose from various timeframes for signal calculation.
Filter Adjustments: Fine-tune the Symmetry Precision, BaselineBound Threshold, and Precision PinBar settings to filter signals according to specific criteria.
Display Options for Key Levels: Enable or disable the display of key price levels and select timeframes for these levels.
█ Related script using the same pattern filtering techniques
-----------------
Disclaimer
The information contained in my Scripts/Indicators/Ideas/Algos/Systems does not constitute financial advice or a solicitation to buy or sell any securities of any type. I will not accept liability for any loss or damage, including without limitation any loss of profit, which may arise directly or indirectly from the use of or reliance on such information.
All investments involve risk, and the past performance of a security, industry, sector, market, financial product, trading strategy, backtest, or individual's trading does not guarantee future results or returns. Investors are fully responsible for any investment decisions they make. Such decisions should be based solely on an evaluation of their financial circumstances, investment objectives, risk tolerance, and liquidity needs.
My Scripts/Indicators/Ideas/Algos/Systems are only for educational purposes!

Fibonacci Timing Pattern IIThe Fibonacci Timing Pattern II is a price-based counter that seeks to determine medium-term reversals in price action. It is based on the following set of conditions:
* For a bullish Fibonacci timing signal II: The current close must be lower than the close prices from one and two periods ago. Simultaneously, the close price from two periods ago must be lower than the close price from three periods ago, and the close price from three periods ago must be lower than the close price from five periods ago. The Fibonacci sequence continues until the close price from thirty four periods ago which must be above the close price from fifty five periods ago.
* For a bearish Fibonacci timing signal II: The current close must be higher than the close prices from one and two periods ago. Simultaneously, the close price from two periods ago must be higher than the close price from three periods ago, and the close price from three periods ago must be higher than the close price from five periods ago. The Fibonacci sequence continues until the close price from thirty four periods ago which must be lower the close price from fifty five periods ago.
The signals of the pattern are ideally used in a sideways market or used in tandem with the trend (bullish signals are taken in a bullish market and bearish signals are taken in a bearish market).

SpiceIn the chart photo is a description for each shape and letter, saying what each one is.
BB, Reversals are off by default.
BB + Reversals + Next bar confirmation - The way this should be used is by waiting for a 1 or 2 bar confirmation closed above/below the high/low of the Reversal candle. So if its a Top R, a yellow box will print as a confirmed 1 bar if it closed below the top R's low, then you can wait for the second bar to close also below the Top R's low. Vice versa with the Bot R.
RSI arrows - Essentially showing you when the multi time frame RSIs are coming back up above 30, or below 70. Respective to what time frames you have selected.
Three Line Strike - A trend continuation candlestick pattern consisting of four candles
Leledc Exhaustion suggest the trend may be reversing. Combined with the moving average as a trend filter, the indicator can signal the end of a pull back and the continuation of the trend.
EMAs - Help measuring the trend direction over a period of time.
Credit to all these amazing creators -
Multi Timeframe RSI (LTF) by @millerrh
3 Line Strike by @Lij_MC 'MarketVision A'
Leledc Exhaustion by @glaz, used updated version by @Joy_Bangla
If anyone uses the BB reversals source code to put into their own indicator/strategy, you are free to do so. Just send me a message I'd love to see your work with it! :)
Thanks to Lij_MC's MarketVision A indicator for inspiring me to add more features. At first it was just the RSI Arrows and the BB reversals candles + Condition but then I found MarketVision A and loved the extra Leledc and 3 Line Strike features.
Hope you enjoy this Spice!
No Signal is 100% correct at what it's trying to do. Use caution when trading!
Practice Risk Management.

Reversal Confirmations [QuantVue]The Reversal Confirmation Indicator is based on price action and looks to provide opportunities when price gets stretched.
The indicator works by finding the highest and lowest points over the user selected lookback period.
If price closes below the low of the highest bar or closes above the high of the lowest bar a possible reversion to the mean may occur and the indicator will plot a triangle and fire an alert.
This indicator works a reversion to the mean or to potentially time entries in trending markets.
Fully customizable settings:
🔹Lookback Period
🔹Colors
🔹Show / hide upper & lower channels
🔹Show / hide the mean
Give this indicator a BOOST and COMMENT your thoughts!
We hope you enjoy.
Cheers!

ATR Trend Reversal Zone indicatorThis indicator helps avoid taking reversal trades too close to the 21 EMA, which may fail since the market often continues its trend after retracing from the 21 EMA level. It does not generate a direct signal for reversal trades but rather indicates points where you can consider potential reversal trades based on your trading methodology
This script defines an indicator that calculates the 21 Exponential Moving Average (EMA) and the Average True Range (ATR) for a given period. It then computes the distance between the most recent closing price and the 21 EMA in terms of ATR units. If this distance is equal to or greater than 3 ATRs, a small green circle is plotted below the corresponding bar on the chart, indicating a potential reversal condition.
Baha'i Reversal Points [CC]The Baha'i Reversal Points is a custom creation that combines some of my favorite passions, creating stock indicator scripts and my faith. The Baha'i Faith believes in the oneness of God and all religions, and sees the number 9 as significant because that is the number of major world religions as well as the Baha'i symbol is a nine-pointed star. The number 19 is also seen as significant because in the Baha'i calendar, there are 19 months, and each month is made up of 19 days. Anyway, with all that being explained, I created these reversal points to find the points where the last 19 highs or lows are higher or lower, respectively than the previous high or low nine days ago. As with many indicators, this does have some hits and misses but does a pretty good job of finding reversal points based on these criteria.
There are a few different ways to analyze this data to determine when to buy or sell. I have set the default behavior for when we encounter the first time that the amount of highs or lows is greater than or equal to the length amount using a crossover or crossunder alert. You could also ignore the crossover or crossunder alerts and buy when the count is greater than or equal to the length, which can happen for extended periods depending on the underlying trend. Overall, buy when the buy label appears and sell when the sell label appears.
Let me know if there are any other custom indicators or scripts you would like to see me publish!

Reversal Candles UG [5ema]The indicator can be find 8 reversal candlestick patterns of bullish or bearish.
-----
How to build?
Based on available reversal patterns that was be share by a group trader.
With name: T1, T1S, T2, T2S, T3, T3S, T3 Pro, T3 Max.
Ex1 - T1 Bull Candles and T3 Bull Candles:
Ex2 - T2 Bull Candles:
Ex2 - T1S Bull Candles:
-----
How to use?
Combine with other indicators like MA, EMA, RSI, Support, Resistance,... to set up a trading strategy.
Make a Alert to get a notification when a reversal candles appear.
-----
This indicator is for reference only, you need your own method and strategy.
If you have any questions, please let me know in the comments.

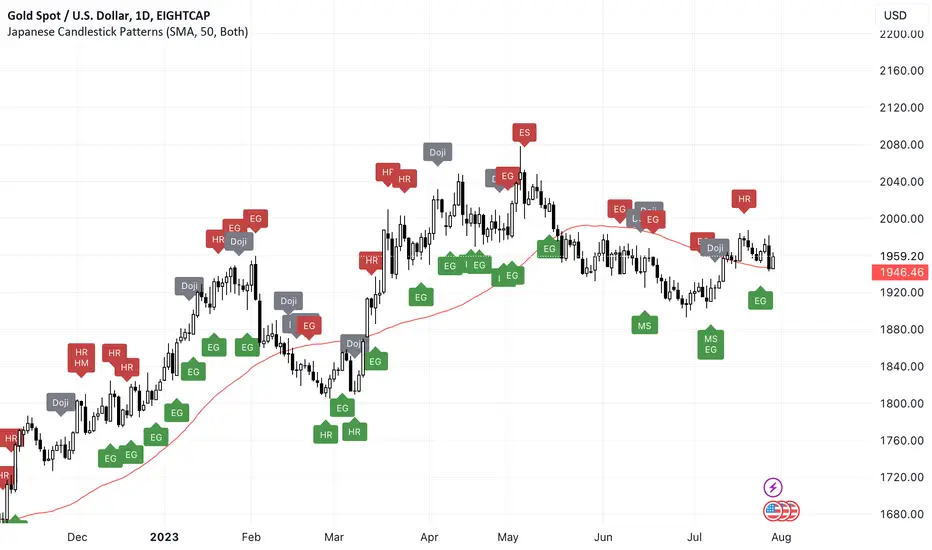
Japanese Candlestick Patterns💡 Japanese Candlesticks are a visual representation of price movements in financial markets. They were first developed by Japanese rice traders in the 18th century to analyze the price of rice contracts, and have since been adopted by traders across the world for a wide range of assets.
📌 A candlestick is composed of a rectangular body and two thin lines, known as wicks, that extend from the top and bottom of the body. The body represents the difference between the opening and closing prices of the asset during a specific time period, while the wicks indicate the high and low prices reached during that period.
📌 By using these and other candlestick patterns, traders can identify potential buying and selling opportunities and manage their risk accordingly. However, it's important to note that candlestick patterns should be used in conjunction with other technical and fundamental analysis tools to make well-informed trading decisions.
📌 Candlestick patterns are particularly useful because they are based on price action rather than external factors such as news or economic data. This makes them useful for traders who employ technical analysis, as they can use candlestick patterns to identify potential trading opportunities and manage their risk accordingly.
🚀 Candlesticks can be used to identify market trends, as well as potential buying and selling opportunities. By analyzing the patterns formed by multiple candlesticks, traders can gain insights into the behavior of the market and make informed trading decisions. Overall, Japanese Candlesticks are a powerful tool for technical analysis that can provide valuable insights into financial markets.
🔍 THE PATTERNS THAT ARE RECOGNIZED:
🔄 Reversal Patterns
* Counterattack Lines
* Dark-Cloud Cover
* Engulfing ( Bearish / Bullish )
* Hammer
* Hanging Man
* Harami ( Bearish / Bullish )
* In Neck
* On Neck
* Piercing
* Three Black Crows
* Thrusting
* Upside Gap Two Crows
⭐️ Stars
* Abandoned Baby
* Evening star
* Inverted Hammer
* Morning Star
* Shooting Star
🎯 Doji
* Doji
* Dragonfly Doji
* Evening Doji Star
* Gravestone Doji
* Long Legged Doji
* Morning Doji Star
🔥 Continuation Patterns
* Falling Three Methods
* Rising Three Methods
* Tasuki ( Upside / Downside )
🥊 Utility
* Long Lower Shadow
* Long Upper Shadow
❤️ Please, support the work with like & comment! ❤️
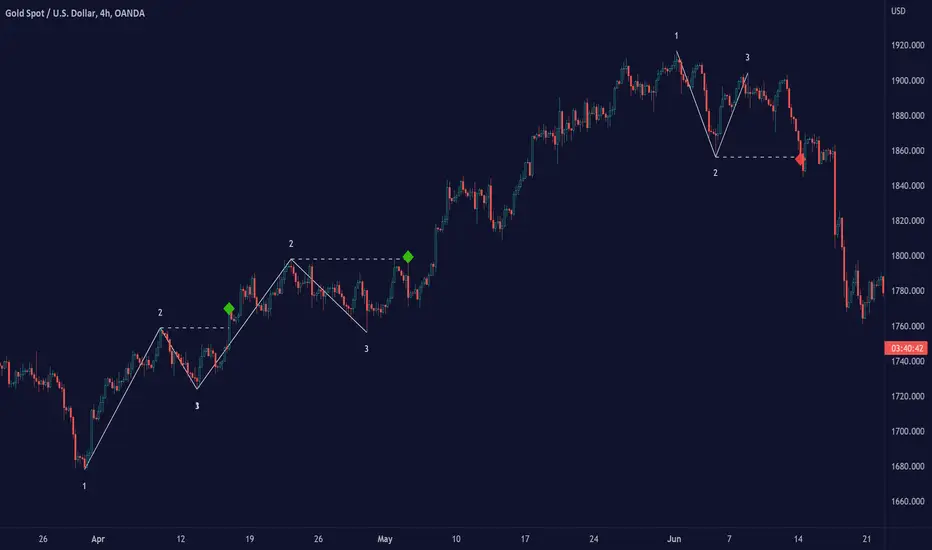
Price breakout and reversal [TCS] | PAThis indicator is designed to identify potential breaks and reversals in price movements for a financial instrument.
The indicator displays several elements to assist users in spotting specific market conditions:
1. High and Low Pivots : The indicator marks the highest and lowest points on the price chart within a customizable lookback period. These pivots represent important turning points in the price movement and serve as reference levels for potential breakouts and reversals.
2. Fair Value Line : A horizontal line is drawn at the midpoint between the high and low pivots. This line represents the "fair value" based on the recent price action. Traders may consider this level as a reference for evaluating the price's deviation from its average value.
3. Bullish Breakouts : When the closing price of the financial instrument crosses above the high pivot the indicator identifies a potential bullish breakout. This suggests a possible buying opportunity.
4. Bearish Breakouts : Conversely, a bearish breakout is identified when the closing price crosses below the low pivot. This may indicate a selling opportunity.
5. Fair Value Breakouts : In addition to regular breakouts, the indicator can detect breakouts based on the fair value line. If the closing price crosses above or below the fair value line, it may signal a fair value breakout, indicating the price's potential return to its average level.
6. Reversals : Reversal patterns are essential in technical analysis. The indicator identifies potential bullish and bearish reversals .
The indicator enhances its visual signals with geometric shapes (triangles and diamonds) placed above or below the price bars to represent different types of breakouts and reversals.
Moreover, the indicator can be configured to send alerts to the user when any of these specific events occur, helping traders stay informed and respond promptly to potential trading opportunities.
Please note that this code is for educational purposes only and should not be used for trading without further testing and analysis.

Reversion Zone IndexThe Reversion Zone Index (RZI) is an indicator that combines the Commodity Channel Index (CCI), Choppiness Index (CI), and Bollinger Bands Percentage (BBPct) to identify mean reversion signals in the market. It is plotted as an Exponential Moving Average (EMA) smoothed oscillator with overbought and oversold zones, and mean reversion signals are represented by red and green arrows.
The three indicators are combined to benefit from their complementary aspects and create a more comprehensive view of mean reversion conditions. Here's a brief overview of each indicator's benefits:
1. Commodity Channel Index (CCI): CCI measures the current price level relative to its average over a specified period. It helps identify overbought and oversold conditions, as well as potential trend retracements. By incorporating CCI, the RZI gains insights into momentum and potential turning points.
2. Choppiness Index (CI): CI quantifies the market's choppiness or trendiness by analyzing the range between the highest high and lowest low over a specific period. It indicates whether the market is in a trending or ranging phase. CI provides valuable information about the market state, which can be useful in mean reversion analysis.
3. Bollinger Bands Percentage (BBPct): BBPct measures the current price's position relative to the Bollinger Bands. It calculates the percentage difference between the current price and the bands, identifying potential overbought or oversold conditions. BBPct helps gauge the market's deviation from its typical behavior and highlights potential reversal opportunities.
The RZI combines the three indicators by taking an average of their values and applying further calculations. It smooths the combined oscillator using an EMA to reduce noise and enhance the visibility of the trends. Smoothing with EMA provides a more responsive representation of the overall trend and helps filter out short-term fluctuations.
The overbought and oversold zones are marked on the chart as reference levels. When the combined oscillator is above the overbought zone or below the oversold zone, it suggests a potential mean reversion signal. Red and green arrows are displayed to visually indicate these mean retracement signals.
The RZI is a valuable tool for identifying mean reversion opportunities in the market. It incorporates multiple indicators, each providing unique insights into different aspects of mean reversion, such as momentum, volatility, and price positioning. Traders can use this indicator to spot potential turning points and time their trades accordingly.

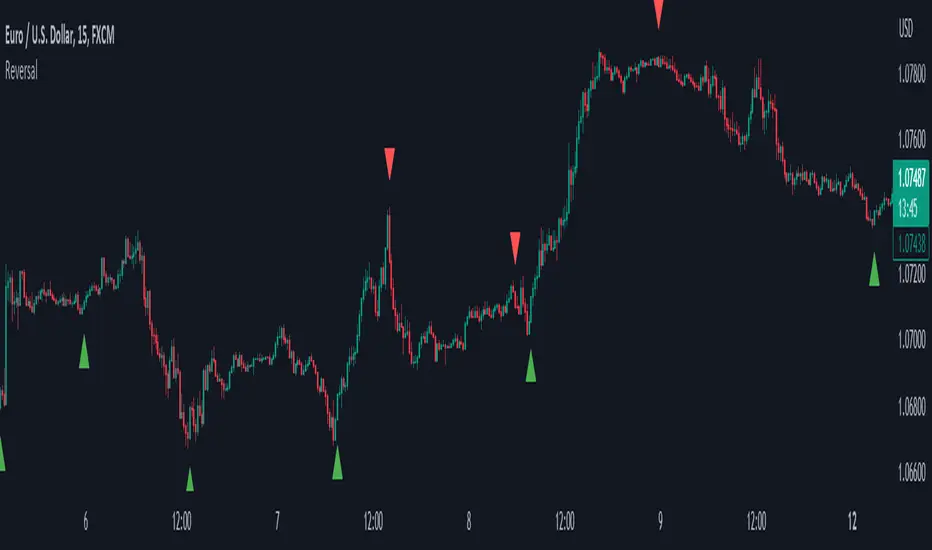
ReversalThe primary objective of this indicator is to discern candles that exhibit characteristics suggestive of potential market reversals through the application of candlestick analysis. Extensive observation across various assets and timeframes has revealed the existence of a recurrent reversal pattern. This pattern typically manifests as a sequence of one to three candles that abruptly diverge from the prevailing price action or trend, offering a distinctive signal indicating a potential reversal.
By leveraging the insights gained from this observation, the indicator aims to assist traders in identifying these noteworthy candle patterns that hold the potential to indicate significant market shifts.
The indicator operates as follows: initially, it identifies the lowest close (in the case of a bullish reversal) or the highest close (in the case of a bearish reversal) within a specified number of previous candles, as determined by user input (referred to as "Candle Lookback").
Next, the indicator examines whether the closing price surpasses the high of the previously identified lowest (bullish reversal) or highest (bearish reversal) closed candle within a designated number of candles, as specified by the user (referred to as "Confirm Within").
Turtle Soup IndicatorTurtle Soup Indicator plots a shape when we have a 20-period high or 20-period low.
Turtle Soup Setup
The Turtle Soup setup was published in the book Street Smarts by Laurence A Connors and Linda Raschke. You can learn about it there. It is a great setup for false breakouts or breakdowns in the group failure tests.
Going long
1) We have a new 20-period low
2) that must have occured at least four trading sessions earlier <- this is very important
Then we place a buy stop above 5-10 ticks or 5 to 10 cents above the previous 20-period low.
If filled immediately place a good til cancelled sell stop one tick or one cent below todays low.
Turtle Soup Plus One
Similar to above but occurs one day later. It should close at/below previous 20-period low.
Buy stop at earlier 20 day low. Cancel fi not filled on day 2.
Take partials within 2-6 bars on this one and trail stop rest of position.
Going short
Reverse
Time frames
Works on all timeframes. Only adjust stoplosses accordingly to chosen timeframe.
Settings
You can change the color, shape and placement of the indicator shape. I actually prefer a grey color for both highs and lows as the color actually doesn't add much information. The placement says it all but it is up to you to change this as you like.

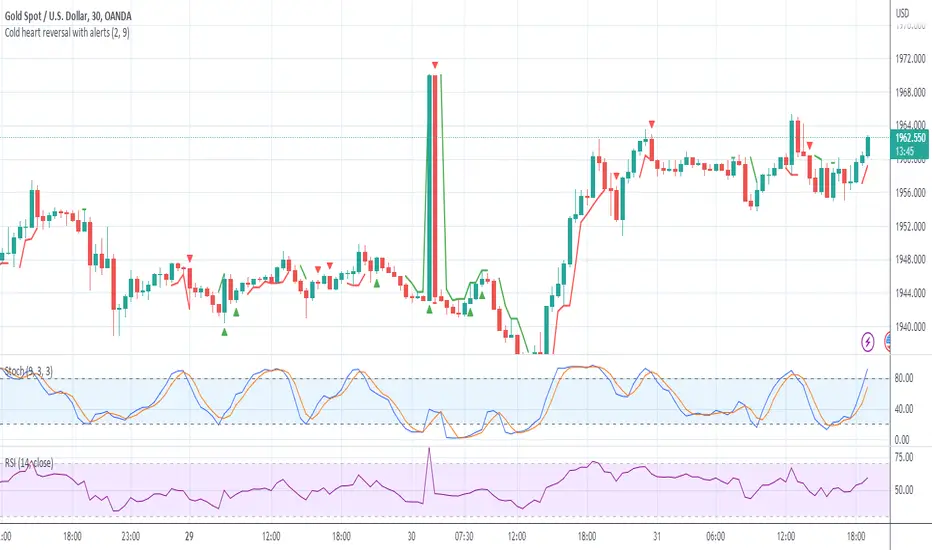
Cold heart reversal with alertsThis will help you find reversal point pinpoint to its candle actually crossed the lowest or highest in the overbought and oversold zone (stochastic 9,3,3)
Various input parameters are defined . These inputs allow the user to customize the lookback period which is the number of candle before the low or high, Stochastic length.
User can also define their own high and low values that will plot on the chart.
It will be super convenient for traders who want confirmed price closed that is actually its significant point.
I used barstate confirmed in this code so you don't have to worry about repaint
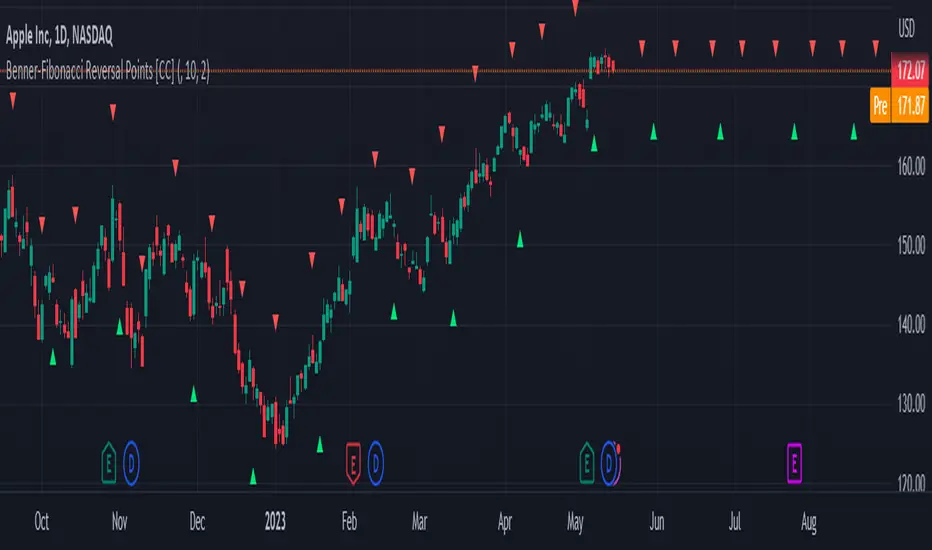
Benner-Fibonacci Reversal Points [CC]This is an original script based on a very old idea called the Benner Theory from the Civil War times. Benner discovered a pattern in pig iron prices (no clue what those are), and this turned out to be a parallel idea to indicators based on Fibonacci numbers. Because a year is 365 days (nearly 377, which is a Fibonacci number), made up of 52 weeks (nearly 55, which is another Fibonacci number), or 12 months (nearly 13, which is another Fibonacci number), Benner theorized that he could find both past and future turning points in the market by using a pattern he found. He discovered that peaks in prices seemed to follow a pattern of 8-9-10, meaning that after a recent peak, it would be 8 bars until the next peak, 9 bars until after that peak for the next, and 10 bars until the following peak. For past peaks, he would just need to reverse this pattern, and so the previous peak would be 10 bars before the most current peak, 9 bars before that peak, and 8 bars before the previous one, and these patterns seemed to repeat. For troughs, he found a pattern of 16,18,20 which follows the same logic, and this idea also seemed to work on long-term peaks and troughs as well.
This is my version of the Benner theory and the major difference between my version and his is that he would manually select a year or date and either work backwards or forwards from that point. I chose to go with an adaptive version that will automatically detect those points and plot those past and future points. I have included several options such as allowing the algorithm to be calculated in reverse which seems to work well for Crypto for some reason. I also have both short and long term options to only show one or both if you choose and of course the option to enable repainting or leave it disabled.
Big thanks to @HeWhoMustNotBeNamed and @RicardoSantos for helping me fix some bugs in my code and for @kerpiciwuasile for suggesting this idea in the first place.
Reversal Points [CC]This original script was created based on a suggestion from @kerpiciwuasile. My original Reversal Points script was removed because I modeled it after an indicator by Demark, but this script will have no such issues. Reversal points are an exciting concept for me because it is such a useful tool when placing trades. This is my first attempt at a new overall layout for my script and I included a bunch of customization so let me know what you think.
My script works by finding lows that are surrounded by bars that have higher lows and highs that are surrounded by lower highs. I use this logic to find short term lows or highs and I use the same concept to find mid-term lows or highs but a mid-term high is a short term high surrounded by lower short term highs and a mid-term low is a short term low surrounded by higher short term lows. And of course this means that long term highs or lows use the same logic to find highs or lows that are surrounded by mid-term highs or lows. I would recommend to buy at the long term low points or sell at the long term high points.
Keep in mind of course that short term highs and lows are very common and reversal points will get rarer as you look for longer term reversal points. I would recommend to experiment and see which reversal points work best for you and of course, know that there is no magical formula to use for all stocks.
Also there are a few scenarios where you want to enable or disable the inside bar setting. You would want to ignore inside bars if the market is currently very volatile or if you are using this indicator on a crypto chart. This is not an exact science but more of a recommendation, so feel free to experiment with it.
Reversal points are crucial for traders as they signal a potential change in the market trend, providing opportunities for entry or exit.
In summary, this code snippet is a powerful tool for traders to detect and visualize reversal points on a trading chart, providing valuable insights into potential trend changes and facilitating more informed trading decisions.
Let me know if you would like me to publish other scripts or if you want me to do something custom for you!

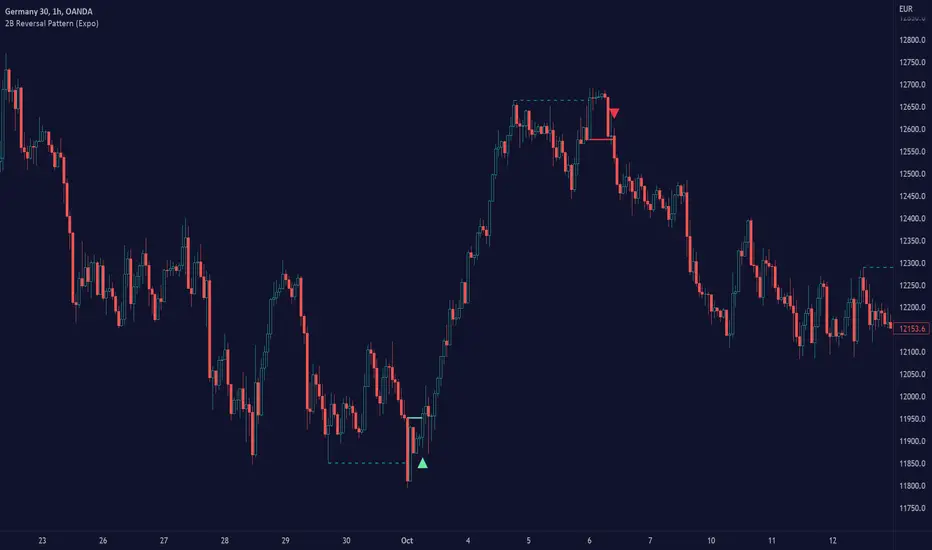
2B Reversal Pattern (Expo)█ Overview
The 2B reversal pattern , also called the "spring pattern", is a popular chart pattern professional traders use to identify potential trend reversals. It occurs when the price appears to be breaking down or up and then suddenly bounces back up/down, forming a "spring" or "false breakout" pattern. This pattern indicates that the trend is losing momentum and that a reversal is coming.
In a bearish market , the "spring pattern" occurs when the price of an asset breaks below a support level, causing many traders to sell their positions and causing the price to drop even further. However, the selling pressure eases at some point, and the price begins to rebound, "springing" back above the support level. This rebound creates a long opportunity for traders who can enter the market at a lower price.
In a bullish market , the "spring pattern" occurs when the price of an asset breaks above a resistance level, causing many traders to buy into the asset and drive the price up even further. However, the buying pressure eases at some point, and the price begins to decline, "springing" below the resistance level. This decline creates a selling opportunity for traders who can short the market at a higher price.
█ What are the benefits of using the 2B Reversal Pattern?
The benefits of using the 2B Reversal pattern as a trader include identifying potential buying or selling opportunities with reduced risk. By waiting for the price to "spring back" to the initial breakout level, traders can avoid entering the market too soon and minimize the risk of potential losses.
█ How to use
Traders can use the 2B reversal pattern to identify reversals. If the pattern occurs after an uptrend, traders may sell their long positions or enter a short position, anticipating a reversal to a downtrend. If the pattern occurs after a downtrend, traders may sell their short positions or enter a long position, anticipating a reversal to an uptrend.
█ Consolidation Strategy
First, traders should identify a period of price consolidation or a trading range where the price has been trading sideways for some time. The key feature of the "spring pattern" is a sudden, sharp move downward/upwards through the lower/upper boundary of this trading range, often accompanied by high volume.
However, instead of continuing to move lower/higher, the price then quickly recovers and moves back into the trading range, often on low volume. This quick recovery is the "spring" part of the pattern and suggests that the market has rejected the lower/higher price and that buying/selling pressure is building.
Traders may use the "spring pattern" as a signal to buy/sell the asset, suggesting strong demand/supply for the stock at the lower/higher price level. However, as with all trading strategies, it is important to use other indicators and to manage risk to minimize potential losses carefully.
-----------------
Disclaimer
The information contained in my Scripts/Indicators/Ideas/Algos/Systems does not constitute financial advice or a solicitation to buy or sell any securities of any type. I will not accept liability for any loss or damage, including without limitation any loss of profit, which may arise directly or indirectly from the use of or reliance on such information.
All investments involve risk, and the past performance of a security, industry, sector, market, financial product, trading strategy, backtest, or individual's trading does not guarantee future results or returns. Investors are fully responsible for any investment decisions they make. Such decisions should be based solely on an evaluation of their financial circumstances, investment objectives, risk tolerance, and liquidity needs.
My Scripts/Indicators/Ideas/Algos/Systems are only for educational purposes!
Bellcurves (Zeiierman)█ Overview
Bellcurves (Zeiierman) models impulse-driven expansion and contraction in price using a pair of adaptive “Bellcurve” flows (positive/negative), momentum dots, a sensitivity/normalization layer, pre-alerts, decline detection, and a built-in divergence suite. Instead of treating every bar equally, it builds scale-aware impulse fields from a weighted price source, normalizes them into comparable magnitudes, and then highlights impulse clusters, pre-alerts (rising pressure), and impulse declines. These waves behave like impulse envelopes: when expansion persists, columns cluster and momentum dots fire; when pressure fades, decline signals and divergences appear.
Use it to spot the first thrust of a new leg, the final push before exhaustion, or quiet accumulation/distribution within ranges.
⚪ Why This One Is Unique
Bellcurves (Zeiierman) combines several adaptive mechanisms into a single, self-tuning framework that captures both momentum expansion and directional decay. Its dual Bellcurve core extracts directional strength through asymmetric smoothers and non-linear amplification, isolating genuine impulses from random volatility. A Quick-Response mode enhances sensitivity in fast markets, while the normalization layer preserves consistency across instruments and timeframes.
█ Main features
⚪ Bellcurves
The Positive and Negative Bellcurves form the foundation of the indicator, visualizing directional expansion in price. Each curve is derived from weighted price dynamics and transformed into an adaptive field that expands with trend acceleration and contracts during exhaustion. Displayed as column waves (or oscillator-style), they reveal the rhythm of market impulses; steady clustering denotes continuation, while isolated bursts or fading peaks hint at potential reversals.
Price Acceleration
Trend Acceleration
Note: To visualize trend acceleration and sustained high-momentum trends, increase the Bellcurve Trend Length parameter to 200. This setting emphasizes long-term directional strength and filters out short-term noise.
Reversals
⚪ Impulse Dots
Impulse Dots mark the first and last bursts within a momentum cluster. Detected through adaptive clustering logic, these dots appear as green (positive) or red (negative) signals that often coincide with early breakouts or terminal exhaustion zones. Traders can interpret the first dot as potential momentum ignition. Alerts are provided for each stage, enabling fast reaction to shifting impulse conditions.
⚪ Divergences
The built-in Divergence Engine automatically identifies regular bullish and bearish divergences between price and the Bellcurves. By analyzing the declining and rising segments of the curves, it detects subtle mismatches between price movements and underlying impulse strength.
█ How to Use
⚪ Trend Trading
The Bellcurves help visualize the rhythm of market trends through alternating Positive (green) and Negative (red) Bellcurves. These represent periods of directional expansion when momentum builds and contraction when momentum fades.
Tip: To enable the Trend Bellcurves, increase Bellcurve Trend Length to 100–200. To detect regime shifts earlier, consider enabling Quick Response to respond more quickly to emerging trends.
Positive Trend (Green Bellcurve): Indicates bullish control. Sustained green clusters show stable upward participation and consistent buying pressure.
Negative Trend (Red Bellcurve): Indicates bearish control. Sustained red clusters reveal dominant selling pressure and downside continuation.
Trend Transitions
Positive Trend is Strengthening: When the green Bellcurve expands and height increases, momentum is accelerating and bullish conviction is building.
Positive Trend is Weakening: When the green Bellcurve contracts or begins to shrink, upward pressure is fading and potential exhaustion is developing.
Negative Trend is Strengthening: Red columns expand and deepen below the midline, bearish momentum building, and downside pressure increasing.
Negative Trend is Weakening: When the red Bellcurve contracts or softens, it signals that bearish pressure is losing force, a possible early sign of reversal or accumulation.
⚪ Reversal Trading
Reversal trading with the Bellcurves is one of the most effective and visually intuitive strategies, especially when going long after a Negative Bellcurve. These events often occur quickly and sharply, and when combined with key price levels such as the previous day’s close, high, or low, they can provide high-probability entry opportunities.
To focus on only the most meaningful reversals, disable “Activate Sensitive Bellcurves”. This filters out minor impulses and displays only the most significant Bellcurves across the chart, helping you isolate genuine exhaustion or inflection points.
Note: Reversal trading is inherently more challenging due to the increased volatility and emotional intensity (fear and greed) surrounding turning points. Use the Bellcurves as a confirmation tool, not a standalone entry signal. Always consider the broader market context. In strong trending markets, Bellcurve peaks may reflect continued strength rather than reversal.
A Green Positive Bellcurve forming after a fast upward move and rejection from a resistance zone can indicate a potential bearish reversal.
A Red Negative Bellcurve appearing near a support level often acts as confirmation for a potential bullish reversal, suggesting downside exhaustion and renewed buying interest.
⚪ Momentum / Impulse Trading
Momentum (or Impulse) Trading is designed for traders looking to enter in the direction of a strong, ongoing move. The Bellcurves indicator helps identify significant impulses on a higher timeframe, moments where directional pressure expands decisively. Once those impulses are identified, traders can refine entries on a lower timeframe, using an opposite Bellcurve as a trigger signal. This multi-timeframe approach allows for precise entries within larger momentum phases.
Bullish Momentum Trading
Start by analyzing a higher timeframe, for example, the 15-minute chart.
Identify a Positive (Green) Bellcurve and mark the first impulse dot, signaling the beginning of upward momentum.
Drop down to a lower timeframe (such as the 1-minute chart).
Wait for a Negative (Red) Bellcurve to peak; this short-term counter-impulse serves as a pullback entry point.
Enter long as the lower timeframe Bellcurve fades, aligning your trade with the dominant bullish impulse seen on the higher timeframe.
This approach ensures that your long entries occur within an expanding bullish phase, rather than chasing late moves.
Bearish Momentum Trading
Begin on a higher timeframe, such as the 1-hour chart, and locate a Negative (Red) Bellcurve with a visible impulse dot, confirming strong bearish momentum.
Shift to a lower timeframe like the 15-minute chart.
Wait for a Positive (Green) Bellcurve to peak; this short-term upward counter-move acts as a setup for continuation.
Enter short as that green Bellcurve begins to decline, synchronizing with the dominant bearish impulse from the higher timeframe.
This ensures that short trades align with expanding downside momentum, entering at moments of retracement within a broader selling phase.
█ How It Works
⚪ Bellcurve Construction Framework
The indicator generates directional Bellcurves through an adaptive modeling process that measures price displacement and trend curvature over time. Each Bellcurve reflects the evolving balance between expansion and absorption in market flow, forming the characteristic “bell” structures that widen during directional acceleration and compress during consolidation.
Calculation: Employs a multi-layered smoothing and normalization process to enhance directional clarity while preserving overall balance within the signal field.
⚪ Momentum & Cluster Engine
Momentum dots are generated through a multi-stage transformation that identifies the initiation and termination points of impulse clusters. By scanning for statistically relevant minima and maxima within the Bellcurve stream, the system isolates bursts of meaningful directional activity.
Calculation: Applies recursive power mapping and localized clustering to detect temporal impulse boundaries and validate “first” and “last” bursts within each momentum sequence.
⚪ Divergence Module
The divergence framework maps relationships between price structure and Bellcurve dynamics to uncover weakening or strengthening flows beneath visible price action. It detects classical bullish and bearish divergences and projects them directly onto the chart as lines and markers.
Calculation: Uses anchored decline-state tracking, relative high–low comparison, and vector slope analysis to measure phase displacement between price and impulse flow, confirming divergence integrity without lag.
-----------------
Disclaimer
The content provided in my scripts, indicators, ideas, algorithms, and systems is for educational and informational purposes only. It does not constitute financial advice, investment recommendations, or a solicitation to buy or sell any financial instruments. I will not accept liability for any loss or damage, including without limitation any loss of profit, which may arise directly or indirectly from the use of or reliance on such information.
All investments involve risk, and the past performance of a security, industry, sector, market, financial product, trading strategy, backtest, or individual's trading does not guarantee future results or returns. Investors are fully responsible for any investment decisions they make. Such decisions should be based solely on an evaluation of their financial circumstances, investment objectives, risk tolerance, and liquidity needs.
유료 스크립트

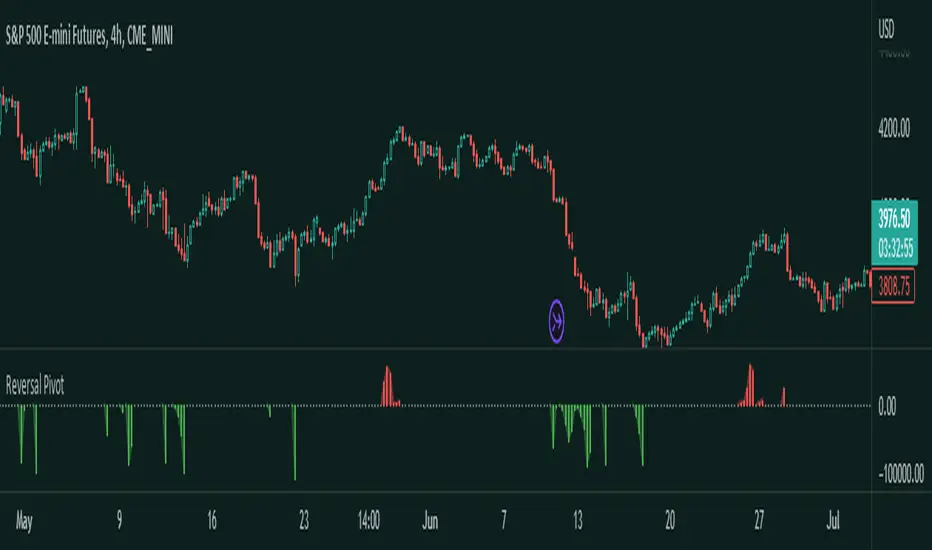
Reversal Pivot
Overview
Introducing the Reversal Pivot indicator - a tool for identifying potential reversal points in price. This algorithm takes into account multiple factors, including price action, volume, and pivot points, to give you a clear and accurate picture of where the market is heading to.
How it works
The indicator gets expansions and the highs and lows and uses the conditions along with pivots to determine whether a reversal is possible or not. Then it gets the volume to determine how strong this chance of reversal is.
How to use
The Reversal Pivot indicator alone shouldn't be used to find reversal points but it helps you get a clear insight on where possible reversals could happen for example, you could use it with mean reversion strategies to find the best entries.
Red bars signal a bearish reversal
Green bars signal a bullish reversal
This here is an example of a long entry if you are trading lets say the mean. You can wait for a bullish reversal on the Histogram plot and then enter, a reversal could happen.
This is an example of a short entry if you are also trading the mean.
Other features
This indicator allows you to customize the colors, and the histogram. If you don't like the histogram then you can change its plot style to whatever you would like.
Try the Reversal Pivot indicator today and find more possible reversal points!
GRIDBOT Scalper by nnamWhat is this Indicator used for?
Made specifically for GRID Bots
note: before continuing... this indicator works on any timeframe, but it WORKS BEST ON THE 15 MINUTE TIMEFRAME
Straters and Forex Master Pattern Value Line Traders use this to help determine when the price could reverse.
This indicator is a scalping indicator that produces signals when a "potential" reversal in price is indicated. When the price moves UP and a Potential Bearish Reversal Signal occurs, traders can use this signal as a potential SHORT entry signal for their Short Grid Bot. The process is the same in reverse. After a sustained move down, a Potential Bullish Signal can be used by the trader as a potential LONG entry signal for their GridBot.
As shown in the screenshot below, lines develop on the chart (either RED or GREEN) indicating that a sustained move in one direction is currently occurring; however, there is no potential reversal signal plotted (this means that price action is currently moving in one direction only).
As shown in the screenshot below, lines can be used as a stop-loss after entering the GRIDbot. (usually, by this time, the Grid Bot is in Profit as it usually moves in the opposite direction first)
What this Indicator Does
The GRIDBOT Scalper provides information regarding potential reversals in the market after a sustained movement in one direction (either Bullish or Bearish).
The indicator is based on PRICE-ACTION ONLY and does not take into account the current state of the market (Bullish or Bearish).
Once the price moves in a particular direction for at least 14 bars , a line appears as shown in a previous screenshot. Once the price stops moving in that direction and begins moving in the opposite direction - and after a sustained run - a "signal" appears alerting the trader that a "potential" reversal could be on the horizon soon.
If price moves in one direction and plots both a line and a signal and then begins moving back in the other direction in a sustained manner, the original signal will remain even when a NEW line begins forming (the original line will disappear). (see below) This line will continue to move as the price continues to move. Not until a signal plots on the chart is the potential reversal forming. THE LINE DOES NOT SIGNAL A REVERSAL . Some traders, however, use this information to "ride the wave UP or DOWN" and exit their positions once the signal prints.
As shown below, optional input settings allow the trader to set the line at CLOSE or HIGH/LOW of the candle preceding the potential reversal.
It is suggested to use Close instead of High or Low but the setting allows one to use either.
As shown in the screenshot below, it is typical on LOWER TIME FRAMES to see the price pass the signal line. The Indicator works best on the 15 minute timeframe, as it gives the trader time to make the decisions required as the volatility is less on the 15 minute chart vs the 1 minute or 5 minute charts.
If you have any questions or suggestions for this indicator, please join our Discord. We offer free training on this Indicator on our Discord Server.

1-2-3 Pattern (Expo)█ Overview
The 1-2-3 pattern is the most basic and important formation in the market. Almost every great market move has started with this formation. That is why you must use this pattern to detect the next big trend. In fact, every trader has used the 1-2-3 formation to detect a trend change without realizing it.
Our 1-2-3 Pattern (Expo) indicator helps traders quickly identify the 1-2-3 Reversal Pattern automatically. By analyzing the price action data, the indicator shows the pattern in real-time. When the pattern is discovered, the 1-2-3 Pattern (Expo) Indicator notifies you via its built-in alert feature! Catching the upcoming big move can't be that much simpler.
█ How to use
The 1-2-3 pattern is used to spot trend reversals. The pattern indicates that a trend is coming to an end and a new one is forming.
-----------------
Disclaimer
The information contained in my Scripts/Indicators/Ideas/Algos/Systems does not constitute financial advice or a solicitation to buy or sell any securities of any type. I will not accept liability for any loss or damage, including without limitation any loss of profit, which may arise directly or indirectly from the use of or reliance on such information.
All investments involve risk, and the past performance of a security, industry, sector, market, financial product, trading strategy, backtest, or individual's trading does not guarantee future results or returns. Investors are fully responsible for any investment decisions they make. Such decisions should be based solely on an evaluation of their financial circumstances, investment objectives, risk tolerance, and liquidity needs.
My Scripts/Indicators/Ideas/Algos/Systems are only for educational purposes!
MTFT Reversal Lines, TheStrat Suite (5of5)Multi Time Frame Tools
Multi Time Frame Tools (MTFT) is a suite of scripts aimed to establish a standard timeframe-based color scheme. This can be utilized to overlay different timeframes calculations/values over a single timeframe. As one example, this would allow to observe the 5-month moving average, 5-week moving average, and 5-day moving average overlaid over each other. This would allow to study a chart, get accustomed to the color scheme and study all these at the same time much easier.
All indicators calculated using the below specific timeframes as input, will always use the color scheme outlined below. This is to get you in habit of recognizing the different timeframes overlaid in top of each other. These can be personalized.
Longer TF analysis.
Yearly - Black
Semi-Annual - Yellow
Quarterly - White
Monthly - Maroon
Weekly - Royal Blue
Daily - Lime
Shorter TF analysis.
4 hour - Fuchsia
1 hour - Orange
30 min - Red
15 min - Brown
10 min - Purple
5 min - Lilac
All color coordination is able to be modified in either the “Inputs” or “Style” section. If you need to make changes, make sure to select “Save as Default” on the bottom right of the settings menu.
Recommended Chart Color Layout
I played around with color coordination a lot. The final product was what worked best for me. I personally use the following chart settings to accent all available TF colors.
-> Click on the settings wheel on your chart. -> Click on “Appearance”.
Background - Solid -> On the top row pick the 6th color from the left.
Vert Grid Lines and Horz Grid Lines -> On the top row pick the 7th color from the left.
You may of course change these and the indicator line colors as you like.
Adding indicator to Chart
-> Open the TradingView “Indicators & Strategies” library, the icon has “ƒx”. -> All premium scripts will be located under “Invite-Only Scripts” -> Click indicator to add to your chart.
MTFT TheStrat Suite (5 Scripts)
Rob Smith is the creator of ‘TheStrat’ trading strategy. For ‘TheStrat’ I have put together a suite of 5 premium scripts that combined will offer people interested in learning ‘TheStrat’ a cleaner learning process. For 2 of the 5 scripts specifically, the MTFT approach of overlaying multiple longer timeframes(TF) over a shorter TF selected as a display cannot be utilized. The other 2 scripts will have full MTFT functionality and they are my personal favorite. I will be providing very basic info to utilize this script; it is up to you to dive deep into learning this strategy. I am not an expert with the tool or a financial advisor. As with all aspects of life, I recommend you research, learn, discern and practice extensively in order to become a master.
1. MTFT Patterns Pro/Noob
2. MTFT Full Time Frame Continuity Table
3. MTFT Last HML wOpen
4. MTFT Actionable Signal Targets
*5. MTFT Reversal Lines
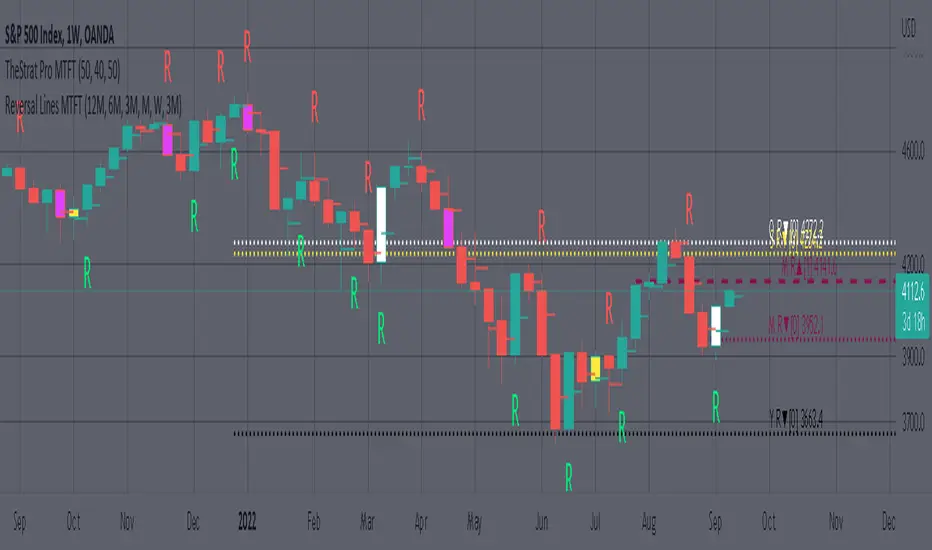
MTFT Reversal Lines, TheStrat Suite (5of5)
This script will plot the line at the point that the reversal was formed for multiple timeframes. Often times price retraces to these points before making more explosive moves in continuation of the reversal direction.
The script has the following features.
Six user selected time frames per script instance can be enabled/disabled. Timeframes include: Yearly(Y), Semi-annually(S), Quarterly(Q), Monthly(M), Weekly(W), Daily(D), 4 hour, 1 hour, 30 min, 15 min, 10 min, and 5 min. Image below shows the Weekly TF selected, and only the W, Q, M, and W are enabled. I’ve included some comments on basic observations.
2. Auto hide lower timeframe calculations. Auto Hide feature will hide smaller TF calculations when a larger timeframe is selected as the display TF. Example, when the Daily timeframe candlestick selected the 4 hour and smaller calculations are hidden because they produce irrelevant results relative to the selected timeframe. If a lower TF is selected such as the 30 min candlestick, the previously hidden timeframes are now displayed. This allows easier study as you change between displayed timeframes.
This script works best in conjunction with ‘MTFT Last HML Band wOpen’. In the image below I have the W candlestick selected, along with the Q HML Lines, and the Q Reversal Line shown. It shows you a clearer picture of how price moves on a TheStrat continuation CS and after a TheStrat reversal point is made. This lets you break into the fine details of what happened inside Quarter 1, 2022 and after the reversal point was formed.
IMPORTANT NOTE for TradingView admin: One of the lessons I would consider most important in attaining clarity regarding trading, is “TheStrat” by Rob Smith. His lesson on “actionable signals” is something that can be applied to any strategy. For this reason, I am including “MTFT TheStrat Patterns Pro” script in all images that will depict confluence for a better trade selection.
Example using TheStrat Pro MTFT with this indicator.
Look for a “TheStrat actionable signal” or a “TheStrat Reversal signal” on a smaller timeframe that has an instance of this indicator on a larger timeframe calculation that is in range of the candlestick that formed your actionable signal. This means that the indicators plot you are observing must be above the low and below the high of the candlestick that is the actionable signal/reversal signal. Image below shows what this would look like with this indicator.
The Image below shows what this would look like with this indicator. The selected candlestick is the 3-day, it shows a 2U-1-potential 2D Reversal pattern and the Quarter Reversal Down line in range. This actionable signal is meant to be played for SHORTS. If the low is breached, you would enter a SHORT position from the low of the inside candlestick. For targets you would look at the previous pivots, for this example all targets were hit. This won’t always play out so nice and clean, but given that there is so many stocks and so many signals this is just a thought to improve the quality of the signal as it has extra confluence.
The $trat | by Octopu$1️⃣2️⃣3️⃣ The $trat | by Octopu$
The $trat: The Strat by Octopu$
Absolute Solution for The Strat Traders!
The Strat is a Strategy created by Rob Smith's and is well known by being an innovative trading system.
Continues to grow in popularity as more traders discover this method.
It is a simplified way to understand Price Action. It is based on three principles: Types of candles, 1, 2, and 3.
Other things to be known about The Strat are Actionable Signals and Time Frame Continuity.
The $trat has it all.
This Indicator includes Bar Types (1, 2 and 3) also known as Inside Bars, Twos (Up or Down) and Outside Bars.
It is also well crafted with a built-in Time Frame Continuity (TFC) which shows Price Movement at a glimpse.
On top of that, in the best of both worlds, also comes with information about the Bars Status for other TFs as well.
It means that you can know how another TF of you preference is performing. Right there.
Works in Any Time Frame.
On Any Ticker.
(Using SPY 5m just as an example:)
www.tradingview.com
SPY
Features:
• Candle Types (1, 2 and 3) IB, 2U & 2D and OB.
• Time Frame Continuity (TFC) for Price Movement/Trend Check
• Bar Status shortcut. So you can know Price Action/Direction fast.
• Reversal indicators for Action-taking and Situational Awareness
• Combos Labels. So nothing ever goes unnoticed.
Options:
• Absolutely fully Customizable: Colors, Sizes, Numbers. Everything.
• On/Off Switches for most of the Information and Optionable Selections
• Hammer/Shooter Indicator automatically inserted to Chart
• Candle/Bars Coloring for ease of reading.
• Highlight options for specific setups
Notes:
v1.0
$trat Indicator release
Changes and updates can come in the future for additional functionalities or per requests.
Did you like it? Boost it. Shoot a message! I'd appreciate if you dropped by to say thanks.
- Octopu$
🐙
