BUY/SELL/R/BBuy/Sell/R/B by SeanKidd
Purpose: A clean, anchored signal system combining StochRSI crossovers, CVI top/bottom detection, and a MACD direction line that moves with price.
⚙️ How It Works
BUY / SELL – Generated from a higher-timeframe StochRSI crossover.
BUY (Green) → %K crosses above %D
SELL (Red) → %K crosses below %D
R (Reverse) – Yellow “R” appears above the candle when the CVI model detects a local top or exhaustion point.
B (Bottom) – Blue “B” appears below the candle when CVI detects a local bottom.
MACD Direction Line –
Green = MACD above Signal → bullish momentum
Red = MACD below Signal → bearish momentum
The line rides just above the candles, offset by ATR so it always tracks price.
🧭 How to Use It
Add the indicator:
Search for Buy/Sell/R/B by SeanKidd under Community Scripts.
Click ★ to favorite it.
Apply it to your chart.
Open ⚙️ Settings → Inputs
Calculation Timeframe (StochRSI) → pick how fast or slow you want signals (default Weekly).
MACD Line Offset (ATR ×) → raise or lower the MACD line if it overlaps candles.
Adjust Top/Bottom thresholds to control how often R/B appear.
Toggle Highlight bars or Color candles for visual clarity.
Go to Settings → Scales and ensure it’s set to
✅ “Scale with Price Chart” or
✅ same scale side as the candles.
This keeps everything perfectly attached to the chart.
Optional: Add alerts
Create → Alert → Condition → Buy/Sell/R/B by SeanKidd
Choose: SRSI BUY, SRSI SELL, Top (R), or Bottom (B).
📈 Reading the Chart
Marker Meaning Color Position
BUY StochRSI %K cross above %D Lime Below bar
SELL StochRSI %K cross below %D Red Above bar
R CVI-detected top / reversal Yellow Above bar
B CVI-detected bottom Blue Below bar
Line MACD momentum direction Green/Red Above highs
💡 Tips
Works on any symbol or timeframe.
Slower charts (Daily–Weekly) give cleaner swing signals.
Faster charts (15m–1h) show short-term reversals.
Combine the MACD line direction with BUY/SELL for stronger confirmation.
Reversal

BB SPY Mean Reversion Investment StrategySummary
Mean reversion first, continuation second. This strategy targets equities and ETFs on daily timeframes. It waits for price to revert from a Bollinger location with candle and EMA agreement, then manages risk with ATR based exits. Uniqueness comes from two elements working together. One, an adaptive band multiplier driven by volatility of volatility that expands or contracts the envelope as conditions change. Two, a bias memory that re arms the same direction after any stop, target, or time exit until a true opposite signal appears. Add it to a clean chart, use the markers and levels, and select on bar close for conservative alerts. Shapes can move while the bar is open and settle on close.
Scope and intent
• Markets. Currently adapted for SPY, needs to be optimized for other assets
• Timeframes. Daily primary. Other frames are possible but not the default
• Default demo. SPY on daily
• Purpose. Trade mean reversion entries that can chain into a longer swing by splitting holds into ATR or time segments
Originality and usefulness
• Novelty. Adaptive band width from volatility of volatility plus a persistent bias array that keeps the original direction alive across sequential entries until an opposite setup is confirmed
• Failure modes mitigated. False starts in chop are reduced by candle color and EMA location. Missed continuation after a take profit or stop is addressed by the re arm engine. Oversized envelopes during quiet regimes are avoided by the adaptive multiplier
• Testability. Every module has Inputs and visible levels so users can see why a suggestion appears
• Portable yardstick. All risk and targets are expressed in ATR units
Method overview in plain language
The engine measures where price sits relative to Bollinger bands, confirms with candle color and EMA location, requires ADX for shorts(in our case long close since we use it currently as long only), and optionally requires a trend or mean reversion regime using band width percent rank and basis slope. Risk uses ATR for stop, target, and optional breakeven. A small array stores the last confirmed direction. While flat, the engine keeps a pending order in that direction. The array flips only when a true opposite setup appears.
Base measures
• Range basis. True Range smoothed over a user defined ATR Length
• Return basis. Not required
Components
• Bollinger envelope. SMA length and standard deviation multiplier. Entry is based on cross of close through the band with location bias
• Candle and EMA filter. Close relative to open and close relative to EMA align direction
• ADX gate for shorts. Requires minimum trend strength for short trades
• Adaptive multiplier. Band width scales using volatility of volatility so envelopes breathe with conditions
• Regime gate optional. Band width percent rank and basis slope identify trend or mean reversion regimes
• Risk manager. ATR stop, ATR target, optional breakeven, optional time exit
• Bias memory. Array stores last confirmed direction and re arms entries while flat
Fusion rule
Minimum satisfied gates count style. All required gates must be true. Optional gates are controlled in Inputs. Bias memory never overrides an opposite confirmed setup.
Signal rule
• Long setup when close crosses up through the lower band, the bar closes green, and close is above the long EMA
• Short setup when close crosses down through the upper band, the bar closes red, close is below the short EMA, and ADX is above the minimum
• While flat the model keeps a pending order in the stored direction until a true opposite setup appears
• IN LONG or IN SHORT describes states between entry and exit
What you will see on the chart
• Markers for Long and Short setups
• Exit markers from ATR or time rules
• Reference levels for entry, stop, and target
• Bollinger bands and optional adaptive bands
Inputs with guidance
Setup
• Signal timeframe. Uses the chart timeframe
• Invert direction optional. Flips long and short
Logic
• BB Length. Typical 10 to 50. Higher smooths more
• BB Mult. Typical 1.0 to 2.5. Higher widens entries
• EMA Length long. Typical 10 to 50
• EMA Length short. Typical 5 to 30
• ADX Minimum for short. Typical 15 to 35
Filters
• Regime Type. none or trend or mean reversion
• Rank Lookback. Typical 100 to 300
• Basis Slope Length and Threshold. Larger values reduce false trends
Risk
• ATR Length. Typical 10 to 21
• ATR Stop Mult. Typical 1.0 to 3.0
• ATR Take Profit Mult. Typical 2.0 to 5.0
• Breakeven Trigger R. Move stop to entry after the chosen multiple
• Time Exit. Minimum bars and extension when profit exceeds a fraction of ATR
Bias and rearm
• Bias flips kept. Array depth
• Keep rearm when flat. Maintain a pending order while flat
UI
• Show markers and levels. Clean defaults
Usage recipes
Alerts update in real time and can change while the bar forms. Select on bar close for conservative workflows.
Properties visible in this publication
• Initial capital 25000
• Base currency USD
• If any higher timeframe calls are enabled, request.security uses lookahead off
• Commission 0.03 percent
• Slippage 3 ticks
• Default order size method Percent of equity with value 5
• Pyramiding 0
• Process orders on close On
• Bar magnifier Off
• Recalculate after order is filled Off
• Calc on every tick Off
Realism and responsible publication
No performance claims. Costs and fills vary by venue. Shapes can move intrabar and settle on close. Strategies use standard candles only.
Honest limitations and failure modes
High impact releases and thin liquidity can break assumptions. Gap heavy symbols may require larger ATR. Very quiet regimes can reduce contrast in the mean reversion signal. If stop and target can both be touched inside one bar, outcome follows the TradingView order model for that bar path.
Regimes with extreme one sided trend and very low volatility can reduce mean reversion edges. Results vary by symbol and venue. Past results never guarantee future outcomes.
Open source reuse and credits
None.
Backtest realism
Costs are realistic for liquid equities. Sizing does not exceed five percent per trade by default. Any departure should be justified by the user.
If you got any questions please le me know

Liquidation Reversal Signals [AlgoAlpha]🟠 OVERVIEW
This tool detects potential liquidation-driven reversals by combining z-score analysis of up/down volume with the classic Supertrend. It watches for abnormal surges in directional volume (on a lower timeframe) and links them to trend flips on the main chart. When both align within a short window, it flags a probable reversal caused by forced liquidations. The goal is to help traders identify exhaustion points where aggressive liquidation moves may mark the end of a trend leg.
🟠 CONCEPTS
The logic revolves around Z-score normalization of up and down volume to locate statistical extremes. When up-volume z-scores exceed a threshold during a bearish Supertrend, it implies trapped shorts being squeezed; the opposite applies for long liquidations. The script tracks these liquidation spikes and monitors whether a Supertrend regime change follows soon after. If confirmed within the allowed timeout, a colored signal marks the event.
In essence:
Z-score outliers = potential forced liquidations.
Supertrend = structural regime context.
Combined = statistically confirmed reversal signals, not random flips.
This pairing reduces false positives by ensuring that both volatility structure and order-flow extremes agree before flagging a reversal.
🟠 FEATURES
Z-score detection for liquidation spikes with adjustable lookback and threshold.
Confirmation logic linking liquidations to Supertrend flips.
Alerts for liquidation spikes and confirmed reversal starts.
On-chart “No Volume” warning to avoid misreads on illiquid assets.
🟠 USAGE
Setup : Add the script to your main chart. Choose a lower timeframe (default 15m) to capture more granular liquidation flows. Adjust Z-Score Length to control how far back the script measures normal behavior and Threshold to decide what counts as extreme. Keep Timeout Bars low (e.g. 20–50) for faster reversals, or higher for slower markets.
Read the chart :
• Circles appear below bars when long liquidations occur; above bars for short liquidations.
• A Supertrend flip with a recent liquidation spike will display an arrow and color shift.
• Fills between candles and trend lines show which side dominates: green for bullish reversal, red for bearish.
• Candle color fades based on the magnitude of liquidation pressure.
Settings that matter :
• Z-Score Length : Longer smooths noise but delays signal; shorter reacts faster.
• Z-Score Threshold : Higher means only extreme liquidations trigger; lower finds smaller squeezes.
• Timeout Bars : Defines how long after a liquidation the Supertrend flip remains valid.
• Lower Timeframe : Determines the precision of volume readings; too low may increase noise.

Island Reversal [LuxAlgo]The Island Reversal tool allows traders to identify reversal patterns directly on the chart. These patterns signal a potential change in trend, either from bullish to bearish or vice versa.
The tool enables traders to filter these patterns by trend, volume, and range, making it easy to display pure or less constrained island reversals.
🔶 USAGE
An island reversal pattern may indicate a change in trend. It occurs when prices change direction from an uptrend to a downtrend, or vice versa.
This pattern is a great tool for timing the market. Traders should be aware of when these patterns develop and watch how prices behave after the pattern forms.
Now, let's take a closer look at one of these island reversal patterns to highlight its different components.
The different parts are depicted in the image above.
1. A trend prior to the pattern
2. A gap starts the pattern.
3. A range of prices
4. A final gap, opposite to the first one, closes the pattern.
5. In this case, the pattern leads to a bearish trend, which is opposite to the trend in the first step.
🔹 Trend, Volume and Range Filters
Enabling the trend filter causes the tool to only detect top island reversals during a bullish trend and bottom island reversals during a bearish trend.
Traders can adjust the size of the detected trend in the settings panel. The larger the trend size, the more relevant the reversal patterns can be.
The volume filter only detects reversal patterns if there is more volume within the range of the pattern than in the preceding trend.
The idea is that more people tend to participate at the top and bottom of a trend as it changes direction.
The tool has two range filters that discriminate the range within the island reversal pattern:
Horizontality Filter (R2): Based on the R-squared statistic from linear regression, it detects whether the price is moving sideways within the range.
Volatility Filter: Based on long-term volatility, it detects the size of the range within the pattern.
The smaller the value in the Horizontality Filter, the more horizontal the prices will be within the range. A larger value will detect more reversal patterns.
The larger the value in the Volatility Filter, the larger the ranges will be. A smaller value will detect fewer reversal patterns.
🔶 SETTINGS
🔹 Trend Filter
Trend Filter: Enable or disable the trend filter.
Trend Length: Select the size of the detected trend.
🔹 Volume Filter
Volume Filter: Enable or disable the volume filter.
🔹 Range Filter
Horizontality Filter (R2): Enable or disable the Horizontality filter and select a threshold value.
Volatility Filter: Enable or disable the Volatility filter and select the multiplier value.
🔹 Style
Bullish: Select a color for bullish sessions.
Bearish: Select a color for bearish sessions.
Transparency: Select a transparency level from 100 to 0.

Ultimate RSI Suite [BigBeluga]🔵 OVERVIEW
The Ultimate RSI Suite elevates the classic RSI into a full professional trading system.
It combines momentum analysis, advanced divergence detection, volatility-based RSI channels, multi-timeframe signals, deviation tracking, and reversal alerts into one powerful tool.
This is no ordinary RSI — it’s a complete momentum intelligence engine designed to identify trend strength, exhaustion, breakout conditions, and reliable reversal points with high precision.
⚠️ Note:
This suite enhances RSI with MTF dashboards, dynamic channels, deviation logic, and smart alerting — ideal for scalpers, swing traders, and institutional-style trend followers.
🔵 CONCEPTS
Measures market momentum to detect overbought/oversold zones and trend health
Tracks RSI behavior relative to dynamic channels (BB/Keltner/Donchian)
Identifies regular bullish & bearish divergences
Detects deviation moves after divergence to confirm trend continuation or exhaustion
Multi-timeframe RSI conditions reveal higher-timeframe confluence
Reversal triggers confirm early momentum shifts
Overbought/oversold gradients visually highlight exhaustion zones
🔵 FEATURES
Classic + Enhanced RSI with configurable lookback & price source
RSI-Channel System (Bollinger, Keltner, Donchian) for volatility-adaptive trend structure
RSI-Smoothing MA for trend direction filters
RSI Reversal Signals for early trend inflection detection
RSI Reversal Signals Deviation Levels +1 / +2 for advanced continuation confirmation
Overbought/Oversold Gradient Zones at 35/65 or user-defined levels
Divergence Engine for bullish & bearish momentum exhaustion signals
On-Chart Divergence & Signals (full overlay capability)
Divergence Engine Deviation Levels +1 / +2 for advanced continuation confirmation
Multi-Timeframe Dashboard (RSI OB/OS, signals, divergences, channel breaks)
• Hover your mouse over any signal cell to see how many bars ago it was triggered
• Signals automatically expire after 50 bars
Smart Alerts for divergence, reversals, channel breaks, and deviation triggers
🔵 HOW TO USE
Enter long when RSI reverses from oversold & prints bullish divergence or a ▲ signal
Enter short when RSI reverses from overbought & prints bearish divergence or ▼
Use channel breaks to confirm momentum expansions or trend shifts
Look for deviation crosses (+1 / +2) for strong confirmation after divergence
Track MTF table — more timeframe agreement = stronger conviction
Avoid trading against MTF RSI extremes (OB/OS stacked zones)
Combine with market structure or volume-based tools for maximum precision
🔵 ALERTS
Includes full automation suite:
Bullish / Bearish divergence
Reversal signals (▲ / ▼)
Channel breakouts (Up/Down)
Deviation +1 / +2 confirmation triggers
Extra RSI signal deviation alerts for precision continuation reads
Great for automated systems, confirmation models, and high-probability intraday/swing entries.
🔵 CONCLUSION
The Ultimate RSI Suite transforms RSI into a smart momentum-analysis system.
With multi-timeframe logic, dynamic channels, advanced divergence/deviation systems, and powerful visual cues, it offers institutional-grade trend, exhaustion, and reversal detection.
If you rely on RSI, this toolkit provides superior clarity, deeper context, and stronger execution timing — making it an elite upgrade for professional traders.
유료 스크립트

Ultimate Scalping IndicatorOverview
The Confluence Signal Indicator is a precision-built scalping tool designed to identify high-probability reversal points in the market.
It combines three core technical elements:
Trend
Mean reversion
Momentum
into a single, efficient system.
By filtering out weak RSI signals and focusing only on setups that align with trend direction and recent momentum shifts, this indicator delivers cleaner and more accurate short-term trade signals.
Core Components
200-Period Moving Average (MA200, 5-Minute Timeframe)
The MA200 is always calculated from the 5-minute chart, regardless of your current timeframe. It defines the macro trend direction and ensures that all trades align with the prevailing momentum.
Session VWAP (Volume-Weighted Average Price)
The VWAP tracks the real-time average price weighted by volume for the current trading session. It acts as a dynamic mean-reversion level and helps identify key areas of institutional activity and short-term balance.
RSI (Relative Strength Index)
The indicator uses a standard 14-period RSI to detect overbought and oversold market conditions.
A “recency filter” is added to ensure signals only appear when RSI has recently transitioned from strength to weakness or vice versa, reducing false signals in trending markets.
Signal Logic
Bullish Signal (Green Arrow)
A bullish reversal signal is plotted below a candle when:
Price is above both the 5-minute MA200 and the Session VWAP.
RSI is oversold (below 30).
The last time RSI was above 50 occurred within the last 10 candles before going oversold.
This ensures that the dip is a fresh pullback within an uptrend, not a prolonged oversold condition.
Bearish Signal (Red Arrow)
A bearish reversal signal is plotted above a candle when:
Price is below both the 5-minute MA200 and the Session VWAP.
RSI is overbought (above 70).
The last time RSI was below 50 occurred within the last 10 candles before going overbought.
This ensures that the overbought reading follows a recent move from weakness, identifying potential short entries in a downtrend.
Recommended Usage
This is a scalping-focused indicator, intended for use on timeframes of 5 minutes or lower. Therefore I would highly recommend to use it on Equity futures trading, such as NQ!, ES!, GC! and so on.
It performs best when combined with additional tools such as support and resistance zones, order blocks, or liquidity levels for context.
Avoid counter-trend signals unless confirmed by price structure or volume behavior.

LucciThis indicator identifies trade setups based on session liquidity levels and price structure analysis during New York trading sessions.
Unlike basic support/resistance indicators, this system tracks untested session extremes and monitors their interaction with price. It combines break-and-retest mechanics with bounce detection at key liquidity zones, providing multiple entry methodologies within a single framework.
METHODOLOGY:
The system maps high/low points from each trading session (Asia: 6PM-3AM, London: 3AM-8AM, NY: 8AM-5PM EST) and monitors price behavior around these levels. It identifies two primary setup types: momentum continuation after level breaks and reversal bounces at untested extremes. Visual differentiation shows which levels remain untested (darker) versus swept levels (lighter).
SETUP IDENTIFICATION:
Break & Retest Signals:
- Detects breaks of NY Open range (15-minute candle at 8:00 AM EST)
- Waits minimum bars after break before validating retest
- Triggers when price returns to level within tolerance zone
Bounce Signals:
- Identifies approaches to untested session highs/lows
- Optional wick confirmation for reversal validation
- Signals when price rejects from liquidity zone
CONFIGURATION OPTIONS:
Entry Parameters:
- Min Bars After Break: 1-10 (delay before retest valid)
- Retest Tolerance: 0.1-10 points (precision of level test)
- Bounce Zone: 0.5-5 points (distance from level)
- Wick Confirmation: On/off reversal filter
Risk Management:
- Risk Reward Options: 1:3, 1:5, or Custom (1:1 to 1:10)
- Stop Loss: Configurable in points
- Max Daily Signals: 1-5 trade limiter
- Trading Hours: Customizable active window
Visual Elements:
- Session Levels: Orange (Asian), Yellow (London), Blue (NY)
- Signal Markers: Triangles (B&R), Diamonds (Bounce)
- TP/SL Lines: Automatic calculation and display
- Info Table: Shows bias, untested levels, daily signals
OPTIMAL USAGE:
Trading Windows:
- 9:30-11:00 AM EST: Primary trading window
- First touch of untested levels: Highest probability
- 15-minute timeframe: Recommended for futures
- Volume filter: Optional quality enhancement
Signal Prioritization:
- Untested levels provide stronger reactions
- Multiple confirmations increase probability
- Respect market structure and session context
- Combine with volume for filtering
TECHNICAL SPECIFICATIONS:
- Multi-timeframe: Uses 15-minute data for NY Open
- Session-based: Resets levels at session transitions
- Alert system: Detailed messages with levels
- Position tracking: Manages active trades visually
IMPORTANT NOTES:
This tool maps liquidity zones based on session extremes and price structure. No trading system guarantees profits. Combine with market context and proper risk management. Designed for active intraday trading on liquid instruments.
The indicator provides objective level identification while requiring trader discretion for optimal results.

Tristan's Tri-band StrategyTristan's Tri-band Strategy - Confluence Trading System
Strategy Overview:
This strategy combines three powerful technical indicators - RSI, Williams %R, and Bollinger Bands - into a single visual trading system. Instead of cluttering your chart with separate indicator panels, all signals are displayed directly on the price chart using color-coded gradient overlays, making it easy to spot high-probability trade setups at a glance.
How It Works:
The strategy identifies trading opportunities when multiple indicators align (confluence), suggesting strong momentum shifts:
📈 Long Entry Signals:
RSI drops to 30 or below (oversold)
Williams %R reaches -80 to -100 range (oversold)
Price touches or breaks below the lower Bollinger Band
All three conditions must align during your selected trading session
📉 Short Entry Signals:
RSI rises to 70 or above (overbought)
Williams %R reaches 0 to -20 range (overbought)
Price touches or breaks above the upper Bollinger Band
All three conditions must align during your selected trading session
Visual Indicators:
(faint) Green gradients below candles = Bullish oversold conditions (buying opportunity)
(faint) Red/Orange gradients above candles = Bearish overbought conditions (selling opportunity)
Stacked/brighter gradients = Multiple indicators confirming the same signal (higher probability) will stack and show brighter / less faint
Blue Bollinger Bands = Volatility boundaries and mean reversion zones
Exit Strategy:
Long trades exit when price reaches the upper Bollinger Band OR RSI becomes overbought (≥70)
Short trades exit when price reaches the lower Bollinger Band OR RSI becomes oversold (≤30)
Key Features:
✅ Session Filters - Trade only during NY (9:30 AM-4 PM), London (3 AM-11:30 AM), or Asia (7 PM-1 AM EST) sessions
✅ No Repainting - Signals are confirmed on candle close for realistic backtesting and live trading
✅ Customizable Parameters - Adjust RSI levels, BB standard deviations, Williams %R periods, and gradient visibility
✅ Visual Clarity - See all three indicators at once without switching between panels
✅ Built-in Alerts - Get notified when entry and exit conditions are met
How to Use Effectively:
Choose Your Trading Session - For day trading US stocks, enable only the NY session. For forex or 24-hour markets, select the sessions that match your schedule.
Look for Gradient Stacking - The brightest, most visible gradients occur when both RSI and Williams %R signal together. These are your highest-probability setups.
Confirm with Price Action - Wait for the candle to close before entering. The strategy enters on the next bar's open to prevent repainting.
Respect the Bollinger Bands - Entries occur at the outer bands (price extremes), and exits occur at the opposite band or when momentum reverses.
Backtest First - Test the strategy on your preferred instruments and timeframes. Works best on liquid assets with clear trends and mean reversion patterns (stocks, major forex pairs, indices).
Adjust Gradient Visibility - Use the "Gradient Strength" slider (lower = more visible) to make signals stand out on your chart style.
Best Timeframes: 5-minute to 1-hour charts for intraday trading; 4-hour to daily for swing trading (I have also found the 3 hour timeframe to work really well for some stocks / ETFs.)
Best Markets: Liquid instruments with volatility - SPY, QQQ, major stocks, EUR/USD, GBP/USD, major indices
Risk Management: This is a mean reversion strategy that works best in ranging or choppy markets. In strong trends, signals may appear less frequently. Always use proper position sizing and stop losses based on your risk tolerance.
----------------------------------------------
Note: Past performance does not guarantee future results. This strategy is provided for educational purposes. Always backtest thoroughly and practice proper risk management before live trading.RetryClaude can make mistakes. Please double-check responses. Sonnet 4.5

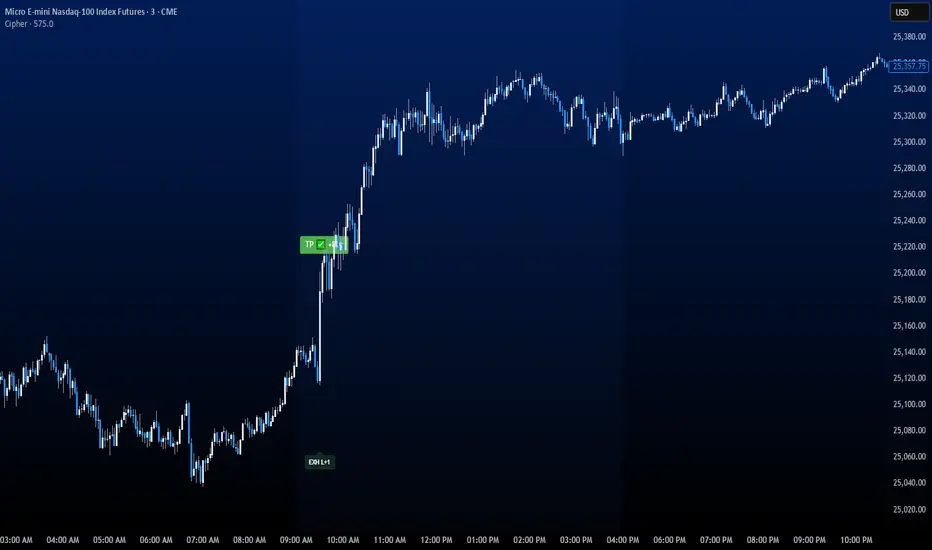
CipherThis indicator identifies potential reversal points through volume exhaustion analysis combined with multi-factor confirmation, volume distribution patterns at price extremes, market state classification based on volatility characteristics, and time-weighted probability calculations. Each component reduces false signals that single-factor indicators typically produce.
METHODOLOGY:
The system continuously monitors market conditions across multiple dimensions. When volume patterns indicate potential exhaustion at significant price levels, it checks for alignment with favorable market conditions and statistical probabilities. Signals only generate when multiple factors confirm, with entry triggered on momentum continuation beyond the exhaustion point.
COMPLETE USAGE GUIDE:
Signal Identification:
- "EXH L+2" = Long exhaustion with 2 confirmations
- "EXH S+3" = Short exhaustion with 3 confirmations
- Higher confirmation numbers indicate stronger setups
Entry Execution:
- Dashed lines mark entry trigger levels
- Entry activates when price breaks trigger within specified bar window
- Buffer setting controls distance from exhaustion bar (ticks)
Position Management:
- Automatic stop loss and target levels display on entry
- Green lines = profit targets
- Red lines = stop loss levels
- Info panel shows real-time position status
CONFIGURABLE PARAMETERS:
Timing Controls:
- Entry Buffer: 0-5 ticks (momentum confirmation distance)
- Max Bars to Wait: 3-10 bars (entry window duration)
- Session Times: Separate London/New York parameters
Sensitivity Settings:
- Volume Multiplier: 1.5-3.0 (vs 20-bar average)
- Lambda Values: Setup frequency expectations per session
- Stop Distances: Session-specific risk parameters
Risk Controls:
- Daily Win Limit: Stops after profitable day
- Daily Loss Limit: Prevents excessive drawdown
- Maximum Daily Trades: Controls overtrading
PERFORMANCE OPTIMIZATION:
Best Trading Windows:
- 10:00 AM EST: Primary reversal window
- 9:30-9:45 AM EST: Opening range exhaustion
- 3:00-4:00 AM EST: European session setups
- 2:30 PM EST: Afternoon reversal potential
Session Characteristics:
- London (2-9 AM EST): Lower frequency, cleaner setups
- New York (9 AM-4 PM EST): Higher frequency, requires filtering
- Background colors indicate active sessions
RISK PARAMETERS:
- Default Stops: 30-40 ticks (session-dependent)
- Risk:Reward Ratios: 1:1.5 to 1:3 (configurable)
- Trade Frequency: 2-4 quality setups weekly
VISUAL REFERENCE:
- Orange Background: London session active
- Blue Background: New York session active
- Yellow Markers: Exhaustion points identified
- Dashed Lines: Pending entry levels
- Solid Lines: Active trade levels
- Info Table: Statistics and system status
IMPORTANT CONSIDERATIONS:
This tool identifies potential setups based on rule-based analysis. Traders should understand that no system guarantees profits and should use appropriate risk management. The indicator works best on 3-minute and 5-minute timeframes in liquid markets. Combine with market context and price action understanding for optimal results.
TECHNICAL REQUIREMENTS:
- Best suited for index and commodites
- Optimized for 3M and 5M
- Requires volume data for proper function
- Best results with consistent market participation
v2.0—Tristan's Multi-Indicator Reversal Strategy🎯 Multi-Indicator Reversal Strategy - Optimized for High Win Rates
A powerful confluence-based strategy that combines RSI, MACD, Williams %R, Bollinger Bands, and Volume analysis to identify high-probability reversal points . Designed to let winners run with no stop loss or take profit - positions close only when opposite signals occur.
Also, the 3 hour timeframe works VERY well—just a lot less trades.
📈 Proven Performance
This strategy has been backtested and optimized on multiple blue-chip stocks with 80-90%+ win rates on 1-hour timeframes from Aug 2025 through Oct 2025:
✅ V (Visa) - Payment processor
✅ MSFT (Microsoft) - Large-cap tech
✅ WMT (Walmart) - Retail leader
✅ IWM (Russell 2000 ETF) - Small-cap index
✅ NOW (ServiceNow) - Enterprise software
✅ WM (Waste Management) - Industrial services
These stocks tend to mean-revert at extremes, making them ideal candidates for this reversal-based approach. I only list these as a way to show you the performance of the script. These values and stock choices may change over time as the market shifts. Keep testing!
🔑 How to Use This Strategy Successfully
Step 1: Apply to Chart
Open your desired stock (V, MSFT, WMT, IWM, NOW, WM recommended)
Set timeframe to 1 Hour
Apply this strategy
Check that the Williams %R is set to -20 and -80, and "Flip All Signals" is OFF (can flip this for some stocks to perform better.)
Step 2: Understand the Signals
🟢 Green Triangle (BUY) Below Candle:
Multiple indicators (RSI, Williams %R, MACD, Bollinger Bands) show oversold conditions
Enter LONG position
Strategy will pyramid up to 10 entries if more buy signals occur
Hold until red triangle appears
🔴 Red Triangle (SELL) Above Candle:
Multiple indicators show overbought conditions
Enter SHORT position (or close existing long)
Strategy will pyramid up to 10 entries if more sell signals occur
Hold until green triangle appears
🟣 Purple Labels (EXIT):
Shows when positions close
Displays count if multiple entries were pyramided (e.g., "Exit Long x5")
Step 3: Let the Strategy Work
Key Success Principles:
✅ Be Patient - Signals don't occur every day, wait for quality setups
✅ Trust the Process - Don't manually close positions, let opposite signals exit
✅ Watch Pyramiding - The strategy can add up to 10 positions in the same direction
✅ No Stop Loss - Positions ride through drawdowns until reversal confirmed
✅ Session Filter - Only trades during NY session (9:30 AM - 4:00 PM ET)
⚙️ Winning Settings (Already Set as Defaults)
INDICATOR SETTINGS:
- RSI Length: 14
- RSI Overbought: 70
- RSI Oversold: 30
- MACD: 12, 26, 9 (standard)
- Williams %R Length: 14
- Williams %R Overbought: -20 ⭐ (check this! And adjust to your liking)
- Williams %R Oversold: -80 ⭐ (check this! And adjust to your liking)
- Bollinger Bands: 20, 2.0
- Volume MA: 20 periods
- Volume Multiplier: 1.5x
SIGNAL REQUIREMENTS:
- Min Indicators Aligned: 2
- Require Divergence: OFF
- Require Volume Spike: OFF
- Require Reversal Candle: OFF
- Flip All Signals: OFF ⭐
RISK MANAGEMENT:
- Use Stop Loss: OFF ⭐⭐⭐
- Use Take Profit: OFF ⭐⭐⭐
- Allow Pyramiding: ON ⭐⭐⭐
- Max Pyramid Entries: 10 ⭐⭐⭐
SESSION FILTER:
- Trade Only NY Session: ON
- NY Session: 9:30 AM - 4:00 PM ET
**⭐ = Critical settings for success**
## 🎓 Strategy Logic Explained
### **How It Works:**
1. **Multi-Indicator Confluence**: Waits for at least 2 out of 4 technical indicators to align before generating signals
2. **Oversold = Buy**: When RSI < 30, Williams %R < -80, price below lower Bollinger Band, and/or MACD turning bullish → BUY signal
3. **Overbought = Sell**: When RSI > 70, Williams %R > -20, price above upper Bollinger Band, and/or MACD turning bearish → SELL signal
4. **Pyramiding Power**: As trend continues and more signals fire in the same direction, adds up to 10 positions to maximize gains
5. **Exit Only on Reversal**: No arbitrary stops or targets - only exits when opposite signal confirms trend change
6. **Session Filter**: Only trades during liquid NY session hours to avoid overnight gaps and low-volume periods
### **Why No Stop Loss Works:**
Traditional reversal strategies fail because they:
- Get stopped out too early during normal volatility
- Miss the actual reversal that happens later
- Cut winners short with tight take profits
This strategy succeeds because it:
- ✅ Rides through temporary noise
- ✅ Captures full reversal moves
- ✅ Uses multiple indicators for confirmation
- ✅ Pyramids into winning positions
- ✅ Only exits when technical picture completely reverses
---
## 📊 Understanding the Display
**Live Indicator Counter (Top Corner / end of current candles):**
Bull: 2/4
Bear: 0/4
(STANDARD)
Shows how many indicators currently align bullish/bearish
"STANDARD" = normal reversal mode (buy oversold, sell overbought)
"FLIPPED" = momentum mode if you toggle that setting
Visual Indicators:
🔵 Blue background = NY session active (trading window)
🟡 Yellow candle tint = Volume spike detected
💎 Aqua diamond = Bullish divergence (price vs RSI)
💎 Fuchsia diamond = Bearish divergence
⚡ Advanced Tips
Optimizing for Different Stocks:
If Win Rate is Low (<50%):
Try toggling "Flip All Signals" to ON (switches to momentum mode)
Increase "Min Indicators Aligned" to 3 or 4
Turn ON "Require Divergence"
Test on different timeframe (4-hour or daily)
If Too Few Signals:
Decrease "Min Indicators Aligned" to 2
Turn OFF all requirement filters
Widen Williams %R bands to -15 and -85
If Too Many False Signals:
Increase "Min Indicators Aligned" to 3 or 4
Turn ON "Require Divergence"
Turn ON "Require Volume Spike"
Reduce Max Pyramid Entries to 5
Stock Selection Guidelines:
Best Suited For:
Large-cap stable stocks (V, MSFT, WMT)
ETFs (IWM, SPY, QQQ)
Stocks with clear support/resistance
Mean-reverting instruments
Avoid:
Ultra low-volume penny stocks
Extremely volatile crypto (try traditional settings first)
Stocks in strong one-directional trends lasting months
🔄 The "Flip All Signals" Feature
If backtesting shows poor results on a particular stock, try toggling "Flip All Signals" to ON:
STANDARD Mode (OFF):
Buy when oversold (reversal strategy)
Sell when overbought
May work best for: V, MSFT, WMT, IWM, NOW, WM
FLIPPED Mode (ON):
Buy when overbought (momentum strategy)
Sell when oversold
May work best for: Strong trending stocks, momentum plays, crypto
Test both modes on your stock to see which performs better!
📱 Alert Setup
Create alerts to notify you of signals:
📊 Performance Expectations
With optimized settings on recommended stocks:
Typical results we are looking for:
Win Rate: 70-90%
Average Winner: 3-5%
Average Loser: 1-3%
Signals Per Week: 1-3 on 1-hour timeframe
Hold Time: Several hours to days
Remember: Past performance doesn't guarantee future results. Always use proper risk management.

Tristan's Multi-Indicator Reversal StrategyMulti-Indicator Reversal Strategy - Buy Low, Sell High
A comprehensive reversal detection system that combines multiple proven technical indicators to identify high-probability entry points for catching reversals at market extremes.
📊 Strategy Overview
This strategy is designed for traders who want to buy at lows and sell at highs by detecting when stocks are overextended and ready to reverse. It works by requiring multiple technical indicators to align before generating a signal, significantly reducing false entries.
Best Used On:
Timeframe: 1-hour charts (also works on 15min, 30min, 4hour)
Session: NY Trading Session (9:30 AM - 4:00 PM ET)
Assets: Stocks, ETFs, Crypto (particularly volatile tech stocks like ZM, TSLA, AAPL)
Trading Style: Swing trading, Intraday reversals
🔧 Technical Components
The strategy combines FIVE powerful technical indicators:
1. RSI (Relative Strength Index)
2. MACD (Moving Average Convergence Divergence)
3. Williams %R
4. Bollinger Bands
5. Volume Analysis
6. Divergence Detection (Optional)
🎨 Visual Signals
Entry Signals:
🟢 Green Triangle (below candle) = BUY LONG signal
🔴 Red Triangle (above candle) = SELL SHORT signal
Exit Signals:
🟣 Purple Label = Position closed (shows "x2", "x3" if multiple entries)
Additional Indicators:
💎 Aqua Diamond = Bullish divergence detected
💎 Fuchsia Diamond = Bearish divergence detected
🔵 Blue Background = NY Session active
🟡 Yellow Bar Tint = Volume spike detected
⚪ Small Circles = Near-signal conditions (2+ indicators aligned)
Live Counter:
Top corner shows: "Bull: X/4" and "Bear: X/4"
Indicates how many indicators currently align
⚙️ How to Use This Strategy
For Beginners (More Signals):
Set "Min Indicators Aligned" to 2
Turn OFF "Require Divergence"
Turn OFF "Require Volume Spike"
Turn OFF "Require Reversal Candle Pattern"
Keep "Allow Multiple Entries" OFF
This gives you more frequent signals to learn from.
For Advanced Traders (High Probability):
Set "Min Indicators Aligned" to 3 or 4
Turn ON "Require Divergence"
Turn ON "Require Volume Spike"
Turn ON "Require Reversal Candle Pattern"
Adjust stop loss to your risk tolerance
This filters for only the highest-quality setups.
Recommended Settings for 1-Hour Charts:
Min Indicators Aligned: 3
Stop Loss: 2.5%
Take Profit: 5.0%
RSI Length: 14
Williams %R Length: 14
Volume Multiplier: 1.5x
Session: NY only (for stocks)
BUY SIGNAL generated when:
2-4 indicators show oversold/bullish conditions:
RSI < 30 and turning up
MACD crossing bullish or histogram positive
Williams %R < -80 and turning up
Price at/below lower Bollinger Band
Optional confirmations (if enabled):
Bullish divergence detected
Volume spike present
Bullish reversal candle pattern
Session filter: Signals only during NY trading hours
SELL SIGNAL Generated When:
2-4 indicators show overbought/bearish conditions:
RSI > 70 and turning down
MACD crossing bearish or histogram negative
Williams %R > -20 and turning down
Price at/above upper Bollinger Band
Optional confirmations (if enabled):
Bearish divergence detected
Volume spike present
Bearish reversal candle pattern
🛡️ Risk Management Features
Automatic Stop Loss: Protects capital (default 2.5%)
Take Profit Target: Locks in gains (default 5.0%)
Pyramiding Control: Toggle to prevent position stacking
Session Filter: Avoids overnight risk and low-liquidity periods
Position Flipping: Automatically reverses when opposite signal appears
💡 Best Practices
✅ DO:
Wait for candle close before entering (built into strategy)
Use on volatile assets with clear trends
Combine with your own analysis and risk management
Backtest on your specific assets and timeframes
Start with paper trading to learn the signals
Adjust indicator requirements based on market conditions
❌ DON'T:
Use on very low timeframes (<5 min) without adjustment
Ignore the session filter on stocks
Use maximum leverage - these are reversal trades
Trade during major news events or earnings
Expect 100% win rate - focus on risk/reward ratio
📊 Performance Notes
This strategy prioritizes quality over quantity. With default settings, you may see:
2-5 signals per week on 1-hour charts
Higher win rate with stricter settings (3-4 indicators aligned)
Best performance during trending markets with clear reversals
Reduced performance in choppy, sideways markets
Tip: Adjust "Min Indicators Aligned" based on market conditions:
Trending markets: Use 3-4 (fewer but stronger signals)
Range-bound markets: Use 2 (more signals, but watch for false breakouts)

Smart Moving Average Dynamics [ChartNation]Smart Moving Average Dynamics (SMAD) — by Chart Nation
What it does:
SMAD maps how far price deviates from a chosen moving average and normalizes that distance into a bounded oscillator (−100…+100). It detects extreme expansions and prints non-repainting dots when the move exits an extreme. Price-level rails are drawn from those events (with optional fade/expiry) to highlight likely reaction zones. The MA line is colored by bias. A slim gauge summarizes the current oscillator percentile; a compact info panel shows TF, Trend, Volume rank, and Volatility rank.
How it works (high-level, closed-source)
Core signal: diff = price – MA(type, length) where MA can be SMA/EMA/RMA/WMA/VWMA.
Normalization (choose one):
Highest Abs (N): scales diff by the highest absolute excursion over N bars (fast, adaptive).
Z-Score: scales by stdev(diff, N) and maps ±σ to ±100 via a user factor.
ATR-Scaled: scales by ATR * k, relating deviation to current volatility.
Percent Rank: ranks the magnitude of |diff| over N bars and reapplies the original sign.
All methods clamp to −100…+100 to keep visuals consistent across assets/TFs.
Extremes & confirmation: Dots print only when an extreme exits ±100 (optionally on bar close) and can be filtered by linger bars and short-term slope flip, reducing one-bar spikes.
Rails: When an extreme confirms, a rail is anchored at the corresponding price swing and can soft-fade and/or expire after X bars.
Trend color: MA color = Up (green) when oscillator > threshold and MA slope > 0; Down (magenta) for the opposite; Neutral otherwise.
Context panels:
Slim Gauge: current oscillator bucket (0–20) with the exact normalized reading.
Info Panel: TF, Trend, and 0–100 percent-ranks of Volume and ATR-based volatility grouped as Low / Medium / High.
SMAD isn’t a collection of plots; it’s a single framework that integrates:
a deviation-from-MA engine,
four interchangeable normalization models (selected per market regime),
a gated extreme detector (linger + slope + confirm-on-close), and
time-aware rails with soft fade/expiry, presented with a minimal gauge and info panel so traders can compare regimes across TFs without recalibrating thresholds.
How to use (examples, not signals)
Mean-revert plays: When price exits an extreme and prints a dot, look for reactions near the new rail. Combine with your S/R and risk model.
Trend continuation: In strong trends the oscillator will spend more time above/below zero; the colored MA helps keep you aligned and avoid fading every push.
Regime switching: Try Percent Rank or ATR-Scaled on choppy/alts; Z-Score on majors; Highest Abs (N) when you want fastest adaptation.
Risk ideas: Rails can be used as partial-take or invalidate levels. Always backtest on your pair/TF.
Key settings
Normalization: Highest Abs / Z-Score / ATR-Scaled / Percent Rank (with N & factors).
Filters: Extreme threshold, linger bars, slope lookback, confirm on close.
Rails: Expire after X bars; soft-fade step.
Panels: Slim gauge (bottom-right), Info panel (middle-right).
Notes & limits
Prints confirm after the extreme exits ±100; nothing repaints retroactively.
Normalization can change sensitivity—choose the one matching your asset’s regime.

Percentile Rank Oscillator (Price + VWMA)A statistical oscillator designed to identify potential market turning points using percentile-based price analytics and volume-weighted confirmation.
What is PRO?
Percentile Rank Oscillator measures how extreme current price behavior is relative to its own recent history. It calculates a rolling percentile rank of price midpoints and VWMA deviation (volume-weighted price drift). When price reaches historically rare levels – high or low percentiles – it may signal exhaustion and potential reversal conditions.
How it works
Takes midpoint of each candle ((H+L)/2)
Ranks the current value vs previous N bars using rolling percentile rank
Maps percentile to a normalized oscillator scale (-1..+1 or 0–100)
Optionally evaluates VWMA deviation percentile for volume-confirmed signals
Highlights extreme conditions and confluence zones
Why percentile rank?
Median-based percentiles ignore outliers and read the market statistically – not by fixed thresholds. Instead of guessing “overbought/oversold” values, the indicator adapts to current volatility and structure.
Key features
Rolling percentile rank of price action
Optional VWMA-based percentile confirmation
Adaptive, noise-robust structure
User-selectable thresholds (default 95/5)
Confluence highlighting for price + VWMA extremes
Optional smoothing (RMA)
Visual extreme zone fills for rapid signal recognition
How to use
High percentile values –> statistically extreme upward deviation (potential top)
Low percentile values –> statistically extreme downward deviation (potential bottom)
Price + VWMA confluence strengthens reversal context
Best used as part of a broader trading framework (market structure, order flow, etc.)
Tip: Look for percentile spikes at key HTF levels, after extended moves, or where liquidity sweeps occur. Strong moves into rare percentile territory may precede mean reversion.
Suggested settings
Default length: 100 bars
Thresholds: 95 / 5
Smoothing: 1–3 (optional)
Important note
This tool does not predict direction or guarantee outcomes. It provides statistical context for price extremes to help traders frame probability and timing. Always combine with sound risk management and other tools.

CCI [Hash Adaptive]Adaptive CCI Pro: Professional Technical Analysis Indicator
The Commodity Channel Index is a momentum oscillator developed by Donald Lambert in 1980. CCI measures the relationship between an asset's price and its statistical average, identifying cyclical turns and overbought/oversold conditions. The indicator oscillates around zero, with values above +100 indicating overbought conditions and values below -100 suggesting oversold conditions.
Standard CCI Formula: (Typical Price - Moving Average) / (0.015 × Mean Deviation)
This indicator transforms the traditional CCI into a sophisticated visual analysis tool through several key enhancements:
Implements dual exponential moving average smoothing to eliminate market noise
Preserves signal integrity while reducing false signals
Adaptive smoothing responds to market volatility conditions
Dynamic Color Visualization System
Continuous gradient transitions from red (bearish momentum) to green (bullish momentum)
Real-time color intensity reflects momentum strength
Eliminates discrete color jumps for fluid visual interpretation
Adaptive Intelligence Features
Dynamic overbought/oversold thresholds adapt to market conditions
Reduces false signals during high volatility periods
Maintains sensitivity during low volatility environments
Momentum Vector Analysis
Incorporates velocity calculations for early trend identification
Crossover detection with momentum confirmation
Advanced signal filtering reduces market noise
Extreme Level Analysis
Values above +100: Strong overbought conditions, potential reversal zones
Values below -100: Strong oversold conditions, potential buying opportunities
Zero-line crossovers: Momentum shift confirmation
Optimization Parameters
CCI Period (Default: 14)
Shorter periods (10-12): Increased sensitivity, more signals
Standard periods (14-20): Balanced responsiveness and reliability
Longer periods (21-30): Reduced noise, stronger signal confirmation
Smoothing Factor (Default: 5)
Lower values (1-3): Maximum responsiveness, suitable for scalping
Medium values (4-6): Balanced approach for swing trading
Higher values (7-10): Institutional-grade smoothness for position trading
Signal Sensitivity (Default: 6)
Conservative (7-10): High-probability signals, reduced frequency
Balanced (5-6): Optimal risk-reward ratio
Aggressive (1-4): Maximum signal generation, requires additional confirmation
Strategic Implementation
Oversold reversals in red zones with momentum confirmation
Zero-line breaks with sustained color transitions
Extreme readings followed by momentum divergence
Risk Management
Use extreme levels (+100/-100) for position sizing decisions
Monitor color intensity for momentum strength assessment
Combine with price action analysis for comprehensive market view
Market Context Application
Trending markets: Focus on momentum direction and extreme readings
Range-bound markets: Utilize overbought/oversold levels for mean reversion
Volatile markets: Increase smoothing parameters and signal sensitivity
Professional Advantages
Instantaneous momentum assessment through color visualization
Reduced cognitive load compared to traditional oscillators
Professional presentation suitable for client reporting
Adaptive Technology
Self-adjusting parameters reduce manual optimization requirements
Consistent performance across varying market conditions
Advanced mathematics eliminate common CCI limitations
The Adaptive CCI Pro represents the evolution of momentum analysis, combining Lambert's foundational CCI concept with modern computational techniques to deliver institutional-grade market intelligence through an intuitive visual interface.

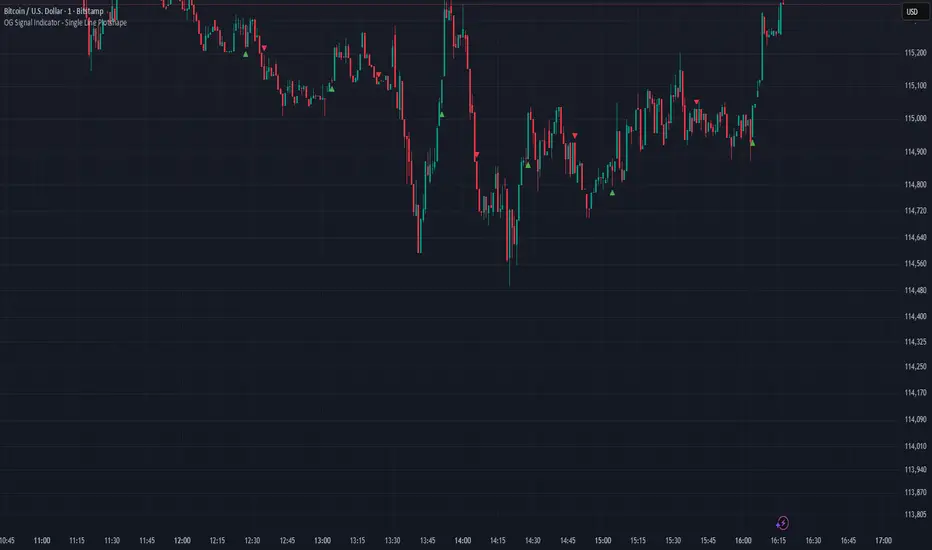
OG Signal Indicator - Single Line Plotshapethis signal help to identify strong buy and sell signal as price over bought and over sold. by sigma s lohar
PDB - RSI Buy & Sell Zones + SMA (PrintDemBandz)PDB - RSI Buy & Sell Zones
A clean, upgraded version of the RSI with shaded momentum zones to make entries and exits easier to spot. The background is divided into five color-coded zones so you instantly see when the market is shifting from bullish to bearish momentum.
Shaded Zones Explained:
| Zone | RSI Range | Zone Meaning |
| --------------------------- | --------- | ----------------------------------------------------- |
| Strong Buy (Dark Green) | < 30 | Oversold extreme – high probability bounce zone
| Buy Zone (Light Green) | 30–40 | Early accumulation & potential reversal area
| Neutral (Grey) | 40–60 | No edge zone – stay patient and wait for direction |
| Sell Zone (Light Red) | 60–70 | Market heating up – take profit or prepare to short |
| Strong Sell (Dark Red) | > 70 | Overbought extreme – high probability correction zone |
A dashed midline at 50 helps instantly gauge trend bias (above = bullish, below = bearish).
Use this RSI alone or combine with MACD or MA for stronger confirmations.
Search "PDB" in the indicators section for more free indicators.

HV Spike Strategy (HVP + OR Breakout + Reversal + TP/SL Modes)Here is a script that I tried to make it simple, although it has several parameters, I will try to explain, here we go:
Logic: Open Range Breakout: otherwise knows as First Candle Rule, usually used for the first candle in the opening of a market session, in my strategy there is an option to use it even for Crypto that operate 24/7, how to do that? Simply by detecting Volatility from the HVP (Historical Volatility Percentile). Then the ORB logic kicks in and the first candle with high volatility gives the ranges for the trades. The proper HVP Activation Threshold has to be selected for each currency pair/index/crypto in order to have maximum profit.
Enter a trade: when the price goes 100% above/below the First Candle Rule Range. That way it is filtering fake breakouts. Also if the price reverses back into the range the strategy takes the opposite trade.
Exit a trade: SL/TP By percentage or ATR, selection in the input menu.
My intention is to avoid using lagging indicators or guessing of Price Action, purely Bull/Bear indication by the first candle.
I hope you find this helpful! Wishing all successful Trades!

Statistical Price Deviation Index (MAD/VWMA)SPDI is a statistical oscillator designed to detect potential price reversal zones by measuring how far price deviates from its typical behavior within a defined rolling window.
Instead of using momentum or moving averages like traditional indicators, SPDI applies robust statistics - a rolling median and Mean Absolute Deviation (MAD) - to calculate a normalized measure of price displacement. This normalization keeps the output bounded (from −1 to +1 by default), producing a stable and consistent oscillator that adapts to changing volatility conditions.
The second line in SPDI uses a Volume-Weighted Moving Average (VWMA) instead of a simple price median. This creates a complementary oscillator showing statistically weighted deviations based on traded volume. When both oscillators align in their extremes, strong confluence reversal signals are generated.
How It Works
For each bar, SPDI calculates the median price of the last N bars (default 100).
It then measures how far the current bar’s midpoint deviates from that rolling median.
The Mean Absolute Deviation (MAD) of those distances defines a “normal” range of fluctuation.
The deviation is normalized and compressed via a tanh mapping, keeping the oscillator in fixed boundaries (−1 to +1).
The same logic is applied to the VWMA line to gauge volume-weighted deviations.
How to Use
The blue line (Price MAD) represents pure price deviation.
The green line (VWMA Disp) shows the volume-weighted deviation.
Overbought (red) zones indicate statistically extreme upward deviation -> potential short-term overextension.
Oversold (green) zones indicate statistically extreme downward deviation -> potential rebound area.
Confluence signals (both lines hitting the same extreme) often mark strong reversal points.
Settings Tips
Lookback length controls how much historical data defines “normal” behavior. Larger = smoother, smaller = more sensitive.
Smoothing (RMA length) can reduce noise without changing the overall statistical logic.
Output scale can be set to either −1..+1 or 0..100, depending on your visual preference.
Alerts and color fills are fully customizable in the Style tab.
Summary:
SPDI transforms raw price and volume data into a statistically bounded deviation index. When both Price MAD and VWMA Disp reach joint extremes, it highlights probable market turning points - offering traders a clean, data-driven way to spot potential reversals ahead of time.

RSI Reversal + BB RSIReversal Alerts
SELL Reversal (reversalSELL)
Triggers when:
RSI touches or crosses above the upper BB, and
The current candle is bearish (close < open).
→ Plots a small red circle above the candle
→ Fires alert named “reversalSELL”
BUY Reversal (reversalBUY)
Triggers when:
RSI touches or crosses below the lower BB, and
The current candle is bullish (close > open).
→ Plots a small green circle below the candle
→ Fires alert named “reversalBUY”

AUTOMATIC ANALYSIS MODULE🧭 Overview
“Automatic Analysis Module” is a professional, multi-indicator system that interprets market conditions in real time using TSI, RSI, and ATR metrics.
It automatically detects trend reversals, volatility compressions, and momentum exhaustion, helping traders identify high-probability setups without manual analysis.
⚙️ Core Logic
The script continuously evaluates:
TSI (True Strength Index) → trend direction, strength, and early reversal zones.
RSI (Relative Strength Index) → momentum extremes and technical divergences.
ATR (Average True Range) → volatility expansion or compression phases.
Multi-timeframe ATR comparison → detects whether the weekly structure supports or contradicts the local move.
The system combines these signals to produce an automatic interpretation displayed directly on the chart.
📊 Interpretation Table
At every new bar close, the indicator updates a compact dashboard (bottom right corner) showing:
🔵 Main interpretation → trend, reversal, exhaustion, or trap scenario.
🟢 Micro ATR context → volatility check and flow analysis (stable / expanding / contracting).
Each condition is expressed in plain English for quick decision-making — ideal for professional traders who manage multiple charts.
📈 How to Use
1️⃣ Load the indicator on your preferred asset and timeframe (recommended: Daily or 4H).
2️⃣ Watch the blue line message for the main trend interpretation.
3️⃣ Use the green line message as a volatility gauge before entering.
4️⃣ Confirm entries with your own strategy or price structure.
Typical examples:
“Possible bullish reversal” → early accumulation signal.
“Compression phase → wait for breakout” → avoid premature trades.
“Confirmed uptrend” → trend continuation zone.
⚡ Key Features
Real-time auto-interpretation of TSI/RSI/ATR signals.
Detects both bull/bear traps and trend exhaustion zones.
Highlights volatility transitions before breakouts occur.
Works across all assets and timeframes.
No repainting — stable on historical data.
✅ Ideal For
Swing traders, position traders, and institutional analysts who want automated context recognition instead of manual indicator reading.

PDB 4 MA + Candle Strength/Weakness Detector
4MA Strength & Reversal Detector
Unlock the power of momentum with this advanced 4 Moving Average system (20, 50, 100, 200) designed to pinpoint market strength and early reversal zones with precision.
How It Works:
- Bearish Reversal: Triggered when all moving averages align (20 < 50 < 100 < 200) and bearish reversal candles appear — highlighting potential tops.
- Bullish Reversal: Triggered when all moving averages align (200 < 100 < 50 < 20) and bullish reversal candles form — marking potential bottoms
:Best For:
⚡ Scalpers and day traders using 1–5 minute timeframes
📈 Identifying momentum shifts and trend exhaustion early
Tip: Combine this with volume or RSI for stronger confirmation and fewer false signals.

Tweezer & Kangaroo Zones [WavesUnchained]Tweezer & Kangaroo Zones
Pattern Recognition with Supply/Demand Zones
Indicator that detects tweezer and kangaroo tail (pin bar) reversal patterns and creates supply and demand zones. Includes volume validation, trend context, and confluence scoring.
What You See on Your Chart
Pattern Labels:
"T" (Red) - Tweezer Top detected above price → Bearish reversal signal
"T" (Green) - Tweezer Bottom detected below price → Bullish reversal signal
"K" (Red) - Kangaroo Bear (Pin Bar rejection from top) → Bearish signal
"K" (Green) - Kangaroo Bull (Pin Bar rejection from bottom) → Bullish signal
Label Colors Indicate Pattern Strength:
Dark Green/Red - Strong pattern (score ≥8.0)
Medium Green/Red - Good pattern (score ≥6.0)
Light Green/Red - Valid pattern (score <6.0)
Zone Boxes:
Red Boxes - Supply Zones (resistance, potential short areas)
Green Boxes - Demand Zones (support, potential long areas)
White Border - Active zone (fresh, not tested yet)
Gray Border - Inactive zone (expired or invalidated)
Pattern Detection
Tweezer Patterns (Classic Double-Top/Bottom):
Flexible Lookback - Detects patterns up to 3 bars apart (not just consecutive)
Precision Matching - 0.2% level tolerance for high-quality signals
Wick Similarity Check - Both candles must show similar rejection wicks
Volume Validation - Second candle requires elevated volume (0.8x average)
Pattern Strength Score - 0-1 quality rating based on level match + wick similarity
Optional Trend Context - Can require trend alignment (default: OFF for more signals)
Kangaroo Tail / Pin Bar Patterns:
No Pivot Delay - Instant detection without waiting for pivot confirmation
Body Position Check - Body must be at candle extremes (30% tolerance)
Volume Spike - Rejection must occur with volume (0.9x average)
Rejection Strength - Scores based on wick length (0.5-0.9 of range)
Optional Trend Context - Bearish in uptrends, Bullish in downtrends (default: OFF)
Zone Management
Auto-Created Zones - Every valid pattern creates a supply/demand zone
Overlap Prevention - Zones too close together (50% overlap) are not duplicated
Lifetime Control - Zones expire after 400 bars (configurable)
Smart Invalidation - Zones invalidate when price closes through them
Styling Options - Choose between Solid, Dashed, or Dotted borders
Border Width - 2px width for better visibility
Confluence Scoring System
Multi-factor confluence scoring (0-10 scale) with configurable weights:
Regime (EMA+HTF) - Trend alignment across timeframes (Weight: 2.0)
HTF Stack - Multi-timeframe trend confluence (Weight: 3.0)
Structure - Higher lows / Lower highs confirmation (Weight: 1.0)
Relative Volume - Volume surge validation (Weight: 1.0)
Chop Advantage - Favorable market conditions (Weight: 1.0)
Zone Thinness - Tight zones = better R/R (Weight: 1.0)
Supertrend - Trend indicator alignment (Weight: 1.0)
MOST - Moving Stop alignment (Weight: 1.0)
Pattern Strength - Quality of detected pattern (Weight: 1.5)
Zone Retest Signals
Signals generated when zones are retested:
BUY Signal - Price retests demand zone from above (score ≥4.5)
SELL Signal - Price retests supply zone from below (score ≥5.5)
Normalized Score - Displayed as 0-10 for easy interpretation
Optional Trend Gate - Require trend alignment for signals (default: OFF)
Alert Ready - Built-in alertconditions for automation
Additional Features
Auto-Threshold Tuning - Adapts to ATR and Choppiness automatically
Session Profiles - Different settings for RTH vs ETH sessions
Organized Settings - 15+ input groups for easy configuration
Optional Panels - HTF Stack overview and performance metrics (default: OFF)
Data Exports - Hidden plots for strategy/library integration
RTA Health Monitoring - Built-in performance tracking
Setup & Configuration
Quick Start:
1. Apply indicator to any timeframe
2. Patterns and zones appear automatically
3. Adjust pattern detection sensitivity if needed
4. Configure zone styling (Solid/Dashed/Dotted)
5. Set up alerts for zone retests
Key Settings to Adjust:
Pattern Detection:
• Min RelVolume: Lower = more signals (0.8 Tweezer, 0.9 Kangaroo)
• Require trend context: Enable for stricter, higher-quality patterns
• Check wick similarity: Ensures proper rejection structure
Zone Management:
• Zone lifetime: How long zones remain active (default: 400 bars)
• Invalidate on close-through: Remove zones when price breaks through
• Max overlap: Prevent duplicate zones (default: 50%)
Scoring:
• Min Score BUY/SELL: Higher = fewer but better signals (default: 4.5/5.5)
• Component weights: Customize what factors matter most
• Signals require trend gate: OFF = more signals, ON = higher quality
Visual Customization
Zone Colors - Light red/green with 85% transparency (non-intrusive)
Border Styles - Solid, Dashed, or Dotted
Label Intensity - Darker greens for better readability
Clean Charts - All panels OFF by default
Understanding the Zones
Supply Zones (Red):
Created from bearish patterns (Tweezer Tops, Kangaroo Bears). Price made a high attempt to push higher, but was rejected. These become resistance areas where sellers may step in again.
Demand Zones (Green):
Created from bullish patterns (Tweezer Bottoms, Kangaroo Bulls). Price made a low with strong rejection. These become support areas where buyers may step in again.
Zone Quality Indicators:
• White border = Fresh zone, not tested yet
• Gray border = Zone expired or invalidated
• Thin zones (tight range) = Better risk/reward ratio
• Thick zones = Less precise, wider stop required
Trading Applications
Reversal Trading - Enter at pattern detection with tight stops
Zone Retest Trading - Wait for retests of established zones
Trend Confluence - Trade only when patterns align with trend
Risk Management - Use zone boundaries for stop placement
Target Setting - Opposite zones become profit targets
Pro Tips
Best signals occur when pattern + zone retest + trend all align
Lower timeframes = more signals but more noise
Higher timeframes = fewer but more reliable signals
Start with default settings, adjust based on your market
Combine with other analysis (structure, key levels, etc.)
Use alerts to avoid staring at charts all day
Important Notes
Not all patterns will lead to successful trades
Use proper risk management and position sizing
Patterns work best in trending or range-bound markets
Very choppy conditions may produce lower-quality signals
Always confirm with your own analysis before trading
Technical Specifications
• Pine Script v6
• RTA-Core integration
• RTA Core Library integration
• Maximum 200 boxes, 500 labels
• Auto-tuning based on ATR and Choppiness
• Session-aware threshold adjustments
• Memory-optimized zone management
What's Included
Tweezer Top/Bottom detection
Kangaroo Tail / Pin Bar detection
Automatic supply/demand zone creation
Volume validation system
Pattern strength scoring
Zone retest signals
Multi-factor confluence scoring
Optional HTF Stack panel
Optional performance metrics
Session profile support
Auto-threshold tuning
Alert conditions
Data exports for strategies
Author Waves Unchained
Version 1.0
Status Public Indicator
Summary
Reversal pattern detection with zone management, volume validation, and confluence scoring for tweezer and kangaroo tail patterns.
---
Disclaimer: This indicator is for educational and informational purposes only. Trading involves risk. Past performance does not guarantee future results. Always practice proper risk management.

ICT Turtle SoupICT Turtle Soup identifies classic “failed breakout” reversals after liquidity sweeps of recent highs/lows, then augments the setup with volume validation, market structure context, Kill Zone (session) filters, Order Blocks (OB), Fair Value Gaps (FVG), OTE (61.8–78.6%) zones, and optional risk targets (SL/TP 1:1, 1:2, 1:3). A compact dashboard summarizes current context (recent high/low, lookbacks, active session, structure state, mitigation counts).
What the Script Does
⦁ Detects Turtle Soup events: Price breaks a prior swing extreme and then quickly reverses back inside the range.
⦁ Grades signal quality: Factors include reversal speed, volume confirmation, breakout magnitude, and consecutive patterns.
⦁ Overlays market context: Trend/range classification (ADX / MA / ATR Bands / Combined), Kill Zones (Asian/London/NY), and time-of-day filters.
⦁ Marks IMB / mitigation zones: Draws Order Blocks and Fair Value Gaps, with optional live mitigation tracking and fading/removal on mitigation.
⦁ Shows OTE zones (61.8–78.6%) after confirmed reversals to highlight potential pullback entries.
⦁ Plots risk management guides: Optional SL buffer below/above reversal wick and TP bands at 1:1, 1:2, 1:3 R multiples.
⦁ Emits alerts on bullish/bearish Turtle Soup confirmations.
How It Works (Conceptual)
1. Liquidity Sweep & Breakout Check
⦁ Looks back over user-defined windows (single or multiple lookbacks: short/medium/long) to find the most recent swing high/low.
⦁ Flags a breakout when price pierces that swing (above for bearish, below for bullish).
⦁ Optional breakout bar volume check requires volume > avg(volume, N) × multiplier.
⦁ Optional swing age check requires the broken swing to be at least X bars old.
2. Reversal Confirmation
⦁ Within N bars after the sweep, validates a mean-reversion close back inside the prior range with a minimum wick/body ratio to confirm rejection.
⦁ Quality Score adds points for:
⦁ Speed: reversal within fast_reversal_bars;
⦁ Volume: breakout and/or reversal volume spike;
⦁ Series: previous consecutive signals;
⦁ Magnitude: sufficient sweep distance.
⦁ Optional high-quality filter only shows signals meeting a minimum score.
3. Context Filters (Optional)
⦁ Sessions/Kill Zones: Only allow signals in selected sessions (Asian/London/NY) with fully custom HHMM inputs.
⦁ Time Window: Restrict to specific hours (e.g., 08–12).
⦁ Market Structure: Classify Trending vs. Ranging (via ADX, MA separation/slope, ATR bands, or Combined). You can allow signals in trends, ranges, or both.
4. Smart Confluence Layers
⦁ Order Blocks: Finds likely OBs with structural validation (e.g., bearish up-candle prior to down move), imbalance score (body/range × volume factor), and extend-until-touched with mitigation % tracking.
⦁ Fair Value Gaps: Detects valid 3-bar gaps (bull/bear) with size threshold, supports touch / 50% / full mitigation logic, and can fade or remove after mitigation.
⦁ OTE Zones: After a reversal, projects the 61.8–78.6% retracement box from the actual swing range; offset scales to timeframe to avoid clutter.
5. Risk & Display
⦁ SL/TP guides: Optional wick-buffered SL and 1:1/1:2/1:3 TPs.
⦁ Dashboard: Recent high/low, active lookbacks, current session, structure label, and live counts of mitigated OBs/FVGs.
Signals & Visuals
⦁ Bullish Turtle Soup: Triangle up + label (🐢S/M/L/D + star rating).
⦁ Bearish Turtle Soup: Triangle down + label (🐢S/M/L/D + star rating).
⦁ Labels can show: quality stars, FAST/SLOW reversal, reversal & breakout volume tags, previous consecutive count, and last move %.
⦁ Lines/Boxes: OBs, FVGs, OTE zones, SL/TP bands, and optional breakout magnitude line.
Inputs (Key Groups)
⦁ Turtle Soup: Lookbacks (single or S/M/L), reversal bars, wick ratio, magnitude line, reversal speed, volume confirmation (multiplier/length), consecutive tracking.
⦁ Order Blocks: Show/validate structure, lookback, extend-until-touched, mitigation % threshold, colors.
⦁ Fair Value Gaps: Show, min size %, colors, mitigation mode (Touch/50%/Full), optional remove-on-mitigation.
⦁ Kill Zones/Sessions: Enable Asian/London/NY with custom HHMM, colors.
⦁ OTE: Show OTE (61.8–78.6%), color, timeframe-adaptive offsets.
⦁ Signal Filters: Filter by session, time window, market structure method (ADX/MA/ATR/Combined), thresholds (ADX, MA periods, ATR multiplier), trending/ranging allowances, structure label & offset.
⦁ SL/TP: SL buffer %, TP 1:1/1:2/1:3 toggles & colors.
⦁ Breakout Validation: Require breakout-bar volume, min swing age, volume label toggles.
⦁ Alerts: Enable/disable.
⦁ Dashboard: Position, text size, colors, border.
How to Use
1. Markets & Timeframes: Works on FX, crypto, indices, and futures. Start with M5–H1 for intraday and H1–H4 for swing; refine lookbacks per instrument volatility.
2. Core Flow:
⦁ Enable multiple lookbacks for robustness on mixed volatility.
⦁ Turn on validate_swing_significance to avoid micro sweeps.
⦁ Use validate_breakout_volume + use_volume_confirmation to filter weak pokes.
3. Context Choice:
⦁ In ranging environments, allow both sides; in trends, consider counter-trend only at HTF OB/FVG/OTE confluence.
⦁ Narrow to London/NY for higher activity if desired.
4. Entries/Stops/Targets:
⦁ Entry on confirmed label close or at OTE pullback post-signal.
⦁ SL: below/above reversal wick + sl_buffer%.
⦁ TP: scale at 1:1/1:2/1:3 or manage via OB/FVG/structure breaks.
5. Confluence: Prefer Turtle Soup that aligns with OB/FVG zones and Combined structure method for added reliability.
Alerts
⦁ “Bullish Turtle Soup detected” and “Bearish Turtle Soup detected” fire on confirmation.
⦁ Set to Once Per Bar (as coded) or adjust in the alert dialog per your workflow.
Notes & Tips
⦁ Multiple lookbacks (S/M/L) help capture both shallow and deep liquidity sweeps.
⦁ Use market structure label with offset to keep it readable on the right of price.
⦁ Mitigation tracking visually communicates when OB/FVG confluence is no longer valid.
⦁ Dashboard = fast situational awareness; keep it on during live trading.
Limitations & Disclaimer
⦁ This tool is educational and not financial advice. No profitability or win-rate is implied. Markets carry risk; manage position size and test thoroughly.
⦁ Signal quality depends on market regime, spreads, news, and data quality. Backtests/forward-tests may differ.
⦁ Visual objects are capped for performance; old items may auto-clean to keep charts responsive.
