Icaro [VekiSeba]
Icaro Indicator: Monitoring Price Extensions
Overview
The Icarus Indicator is a tool designed to help traders identify critical points in the price movements of financial assets. Inspired by the Greek myth of Icarus , this indicator alerts on potential exhaustions in bullish movements or significant price extensions. It is ideal for traders looking to optimize profitability and make strategic decisions on when to exit a position, thereby minimizing the risk of dramatic price reversals.
How the Indicator Works: The Icarus Indicator combines various volatility and trend metrics to provide signals:
ATR (Average True Range): Measures the asset’s volatility, providing insight into the intensity of price movements. This component is crucial for understanding the strength behind the asset’s fluctuations.
Gain from Average Trend: This metric calculates how much the current price has deviated from an average trend line. It helps identify how extended or overvalued the price might be in relation to its overall trend.
ATR Acceleration: Assesses how the pace of volatility change compares to its recent average, indicating rapid changes in volatility that might suggest an increase in momentum or an early warning of overextension.
Visual Signals:
Wing Momentum (Purple Cross): Indicates a significant increase in volatility acceleration, suggesting that the price may be entering a phase of unusual momentum. There is also the potential that this signal could lead to a correction.
Solar Roof (Red Circle): Activates when the price reaches an exhaustion level as defined by the user’s threshold, indicating a possible turning point or correction.
NASDAQ:SMCI
Configuration and Use: Users can customize the "Flight Threshold" to adjust the sensitivity of the indicator to their specific trading strategies. Modifying this threshold allows the indicator to be less or more reactive to the asset’s fluctuations.
Originality and Utility of the Indicator: Icarus stands out from other indicators with its unique focus on measuring volatility, offering a dynamic perspective on the asset's conditions. A notable feature of Icarus is its ability to reduce the number of false signals through its specialized formula, which prioritizes accuracy over the frequency of alerts. Although this may mean that the indicator does not react to all price extensions and might occasionally overlook some, it is intentionally designed to provide a higher percentage of correct signals when it does issue an alert. This "lower frequency, higher accuracy" approach is particularly valuable for traders who prefer the quality of signals over quantity, thus minimizing reactions to incorrect market movements and optimizing trading decisions based on highly reliable indicators. However, it is important to note that no indicator, including Icarus, can guarantee 100% effectiveness. Indeed, we cannot quantify the exact success rate of Icarus, as its performance can vary widely depending on the volatility of each asset and the market context at any given time.
Reversal

3 Drive Harmonic Pattern [TradingFinder] Three Drive Reversal🔵 Introduction
The Three Drive harmonic pattern closely resembles other price structures such as Wedge Pattern and Three Push Pattern, yet it stands out due to its precise use of Fibonacci ratios and symmetrical price movements.
This pattern comprises three consecutive and symmetrical price drives, each validated by key Fibonacci ratios (1.27 and 1.618), which help identify critical Potential Reversal Zones (PRZ).
Unlike the Wedge, which relies on converging trend lines and can indicate either continuation or reversal, and the Three Push, which lacks defined Fibonacci ratios and symmetry, the Three Drive pattern defines PRZ with greater accuracy, providing traders with high-probability trading opportunities.
This pattern appears in both bullish and bearish trends. After the completion of the third drive (Drive 3), it signals the market's readiness to reverse direction. The PRZ in this pattern serves as a crucial zone where price is highly likely to reverse, offering a strategic point for entering or exiting trades. Professional traders utilize the Three Drive pattern and PRZ as essential tools for analyzing and capitalizing on potential market reversals.
Bullish Pattern :
Bearish Pattern :
🔵 How to Use
The Three Drive harmonic pattern is an effective tool for identifying potential reversal points in the market. By utilizing Fibonacci extension levels (1.27 and 1.618) and focusing on the pattern’s symmetry, traders can pinpoint Potential Reversal Zones (PRZ) where the price is likely to change direction. This pattern works in both bearish and bullish scenarios, each with distinct characteristics and trading opportunities.
🟣 Bullish Three Drive Pattern
The bullish Three Drive pattern develops during a downtrend, indicating a potential reversal to the upside. Similar to its bearish counterpart, this pattern features three consecutive downward price movements (drives) with retracements in between. The third drive concludes within the PRZ, which serves as a strong support zone where the price is expected to reverse upwards.
The first drive begins with a downward movement, followed by a retracement to the 0.618 Fibonacci level. The second drive continues downward to reach a 1.27 or 1.618 Fibonacci extension of the retracement. Finally, the third drive aligns with the PRZ, where a confluence of Fibonacci levels creates a high-probability support zone.
In the PRZ, traders look for bullish confirmation signals such as bullish candlestick patterns (e.g., bullish engulfing or pin bars) or increasing trading volume. Once confirmation is observed, the PRZ becomes an ideal entry point for a buy position. Stop-loss orders are placed slightly below the PRZ to minimize risk, while take-profit targets are set at key resistance levels or Fibonacci retracement levels.
🟣 Bearish Three Drive Pattern
The bearish Three Drive pattern forms during an uptrend, signaling a potential reversal to the downside. This pattern consists of three consecutive upward price movements (drives) and intermediate retracements. Each drive aligns with Fibonacci extension levels, and the third drive ends within the PRZ, indicating a high probability of a bearish reversal.
In the first drive, the price moves upward and then retraces to approximately the 0.618 Fibonacci retracement level, forming the base for the second drive. The second drive then extends upward to the 1.27 or 1.618 Fibonacci extension of the preceding retracement. This process repeats for the third drive, which reaches the PRZ, typically defined by the convergence of Fibonacci levels from previous drives.
Once the PRZ is identified, traders look for confirmation signals such as bearish candlestick patterns (e.g., bearish engulfing or pin bars) or declining trading volume. If confirmation is present, the PRZ becomes an optimal zone for entering a sell position. Stop-loss levels are typically placed slightly above the PRZ to protect against pattern failure, and take-profit targets are set at key support levels or Fibonacci retracement levels of the overall structure.
🟣 Three Drive Vs Wedge Pattern Vs 3 Push pattern
The Three Drive, Wedge, and Three Push patterns are all used to identify potential price reversal points, but they differ significantly in structure and application. The Three Drive pattern is based on three consecutive and symmetrical price movements, validated by precise Fibonacci ratios (1.27 and 1.618), to define Potential Reversal Zones (PRZ).
In contrast, the Wedge pattern relies on converging trend lines and does not require Fibonacci ratios; it can act as either a reversal or continuation pattern. Meanwhile, the Three Push pattern shares similarities with Three Drive but lacks precise symmetry and Fibonacci-based validation.
Instead of a PRZ, Three Push focuses on identifying areas of support and resistance, often signaling weakening momentum in the current trend. Among these, the Three Drive pattern is more reliable for pinpointing high-probability reversal zones due to its strict Fibonacci-based and symmetrical structure.
🔵 Setting
🟣 Logical Setting
ZigZag Pivot Period : You can adjust the period so that the harmonic patterns are adjusted according to the pivot period you want. This factor is the most important parameter in pattern recognition.
Show Valid Format : If this parameter is on "On" mode, only patterns will be displayed that they have exact format and no noise can be seen in them. If "Off" is, the patterns displayed that maybe are noisy and do not exactly correspond to the original pattern.
Show Formation Last Pivot Confirm : if Turned on, you can see this ability of patterns when their last pivot is formed. If this feature is off, it will see the patterns as soon as they are formed. The advantage of this option being clear is less formation of fielded patterns, and it is accompanied by the latest pattern seeing and a sharp reduction in reward to risk.
Period of Formation Last Pivot : Using this parameter you can determine that the last pivot is based on Pivot period.
🟣 Genaral Setting
Show : Enter "On" to display the template and "Off" to not display the template.
Color : Enter the desired color to draw the pattern in this parameter.
LineWidth : You can enter the number 1 or numbers higher than one to adjust the thickness of the drawing lines. This number must be an integer and increases with increasing thickness.
LabelSize : You can adjust the size of the labels by using the "size.auto", "size.tiny", "size.smal", "size.normal", "size.large" or "size.huge" entries.
🟣 Alert Setting
Alert : On / Off
Message Frequency : This string parameter defines the announcement frequency. Choices include: "All" (activates the alert every time the function is called), "Once Per Bar" (activates the alert only on the first call within the bar), and "Once Per Bar Close" (the alert is activated only by a call at the last script execution of the real-time bar upon closing). The default setting is "Once per Bar".
Show Alert Time by Time Zone : The date, hour, and minute you receive in alert messages can be based on any time zone you choose. For example, if you want New York time, you should enter "UTC-4". This input is set to the time zone "UTC" by default.
🔵 Conclusion
The Three Drive pattern is a highly effective harmonic tool for identifying potential reversal points in the market. By leveraging its symmetrical structure and precise Fibonacci ratios (1.27 and 1.618), this pattern provides traders with clear entry and exit signals, enhancing the accuracy of their trades.
Whether in bullish or bearish scenarios, the identification of the Potential Reversal Zone (PRZ) serves as a critical aspect of this pattern, enabling traders to anticipate price movements with greater confidence.
Compared to similar patterns like Wedge and Three Push, the Three Drive pattern stands out for its stringent reliance on Fibonacci levels and symmetrical price movements, making it a more robust choice for forecasting reversals. However, as with any technical analysis tool, its effectiveness increases when combined with confirmation signals, such as candlestick patterns, volume analysis, and broader market context.
Mastering the Three Drive pattern requires practice and attention to detail, especially in accurately defining the PRZ and ensuring the pattern adheres to its criteria. Traders who consistently apply this pattern as part of a comprehensive trading strategy can capitalize on high-probability opportunities and improve their overall performance in the market.

Double Top/Bottom [AlgoAlpha]Introducing the Double Top/Bottom Indicator by AlgoAlpha, a powerful tool designed to identify key reversal patterns in the market with precision. This indicator meticulously detects double tops and double bottoms, helping traders recognize potential trend reversals and make informed trading decisions.
Key Features:
🔍 Pattern Detection : Accurately identifies double top and double bottom formations based on customizable time horizons.
🎨 Customizable Appearance : Choose your preferred colors for bullish and bearish trends to match your trading style.
📊 Signal Labels : Option to display only the second pivot of the double top/bottom for a cleaner chart view.
🔧 Flexible Settings : Adjust the time horizon to control the look-back period, allowing for detection of both short-term and long-term patterns.
📈 Visual Enhancements : Draws trend lines and fills between pivotal points to visually highlight potential reversal zones.
🔔 Alerts : Set up alerts for potential double top and double bottom formations to stay informed of key market movements.
How to Use the Double Top/Bottom Indicator :
🛠 Add the Indicator : Simply add the Double Top/Bottom Indicator to your TradingView chart from your favorites. Customize the time horizon and appearance settings to fit your trading preferences.
📊 Analyze Patterns : Watch for the identified double top and double bottom patterns along with the corresponding trend lines and filled areas to anticipate potential market reversals.
🔔 Set Alerts : Enable alerts to receive notifications when double top or double bottom patterns are detected, ensuring you never miss a critical trading opportunity.
How It Works : The indicator scans the price action for pivot highs and lows within a specified time horizon, identifying potential double top and double bottom patterns. It maintains a sequence of these pivots and verifies the formation of these patterns based on the relationship between consecutive pivots and the proximity to a defined limit. When a double top or double bottom is confirmed, the indicator marks the second pivot point with a label and draws trend lines to visualize the reversal pattern. Additionally, it provides alert conditions to notify traders of potential confirmations, enhancing decision-making without cluttering the chart.
⚠️ Important Reminder : The labels indicating double tops and bottoms appear with a delay and are intended to mark the formations after they have already formed. They are not meant to be used as real-time trading signals. While they align perfectly with pivot points in hindsight, please use them as markers for analysis rather than immediate trading triggers.

XAMD/AMDX ICT 01 [TradingFinder] SMC Quarterly Theory Cycles🔵 Introduction
The XAMD/AMDX strategy, combined with the Quarterly Theory, forms the foundation of a powerful market structure analysis. This indicator builds upon the principles of the Power of 3 strategy introduced by ICT, enhancing its application by incorporating an additional phase.
By extending the logic of Power of 3, the XAMD/AMDX tool provides a more detailed and comprehensive view of daily market behavior, offering traders greater precision in identifying key movements and opportunities
This approach divides the trading day into four distinct phases : Accumulation (19:00 - 01:00 EST), Manipulation (01:00 - 07:00 EST), Distribution (07:00 - 13:00 EST), and Continuation or Reversal (13:00 - 19:00 EST), collectively known as AMDX.
Each phase reflects a specific market behavior, providing a structured lens to interpret price action. Building on the fractal nature of time in financial markets, the Quarterly Theory introduces the Four Quarters Method, where a currency pair’s price range is divided into quarters.
These divisions, known as quarter points, highlight critical levels for analyzing and predicting market dynamics. Together, these principles allow traders to align their strategies with institutional trading patterns, offering deeper insights into market trends
🔵 How to Use
The AMDX framework provides a structured approach to understanding market behavior throughout the trading day. Each phase has its own characteristics and trading opportunities, allowing traders to align their strategies effectively. To get the most out of this tool, understanding the dynamics of each phase is essential.
🟣 Accumulation
During the Accumulation phase (19:00 - 01:00 EST), the market is typically quiet, with price movements confined to a narrow range. This phase is where institutional players accumulate their positions, setting the stage for future price movements.
Traders should use this time to study price patterns and prepare for the next phases. It’s a great opportunity to mark key support and resistance zones and set alerts for potential breakouts, as the low volatility makes immediate trading less attractive.
🟣 Manipulation
The Manipulation phase (01:00 - 07:00 EST) is often marked by sharp and deceptive price movements. Institutions create false breakouts to trigger stop-losses and trap retail traders into the wrong direction. Traders should remain cautious during this phase, focusing on identifying the areas of liquidity where these traps occur.
Watching for price reversals after these false moves can provide excellent entry opportunities, but patience and confirmation are crucial to avoid getting caught in the manipulation.
🟣 Distribution
The Distribution phase (07:00 - 13:00 EST) is where the day’s dominant trend typically emerges. Institutions execute large trades, resulting in significant price movements. This phase is ideal for trading with the trend, as the market provides clearer directional signals.
Traders should focus on identifying breakouts or strong momentum in the direction of the trend established during this period. This phase is also where traders can capitalize on setups identified earlier, aligning their entries with the market’s broader sentiment.
🟣 Continuation or Reversal
Finally, the Continuation or Reversal phase (13:00 - 19:00 EST) offers a critical juncture to assess the market’s direction. This phase can either reinforce the established trend or signal a reversal as institutions adjust their positions.
Traders should observe price behavior closely during this time, looking for patterns that confirm whether the trend is likely to continue or reverse. This phase is particularly useful for adjusting open positions or initiating new trades based on emerging signals.
🔵 Settings
Show or Hide Phases.
Adjust the session times for each phase :
Accumulation: 19:00-01:00 EST
Manipulation: 01:00-07:00 EST
Distribution: 07:00-13:00 EST
Continuation or Reversal: 13:00-19:00 EST
Modify Visualization : Customize how the indicator looks by changing settings like colors and transparency.
🔵 Conclusion
AMDX provides traders with a practical method to analyze daily market behavior by dividing the trading day into four key phases: Accumulation, Manipulation, Distribution, and Continuation or Reversal. Each phase highlights specific market dynamics, offering insights into how institutional activity shapes price movements.
From the quiet buildup in the Accumulation phase to the decisive trends of the Distribution phase, and the critical transitions in Continuation or Reversal, this approach equips traders with the tools to anticipate movements and make informed decisions.
By recognizing the significance of each phase, traders can avoid common traps during Manipulation, capitalize on clear trends during Distribution, and adapt to changes in the final phase of the day.
The structured visualization of market phases simplifies decision-making for traders of all levels. By incorporating these principles into your trading strategy, you can enhance your ability to align with market trends, optimize entry and exit points, and achieve more consistent results in your trading journey.

Reversal Signals [AlgoAlpha]📈🔄 Reversal Signals – Master Market Reversals with Precision! 🚀✨
Elevate your trading strategy with the Reversal Signals indicator by AlgoAlpha. This advanced tool is designed to pinpoint potential bullish and bearish reversals by analyzing price action and, optionally, volume confirmations. It seamlessly combines reversal detection with trend analysis, giving you a comprehensive view of market dynamics to make informed trading decisions.
Key Features
🔎 Price Action Reversal Detection : Identifies potential reversal points by comparing current price movements against historical candle patterns within a customizable lookback period.
📊 Volume Confirmation : Optionally integrates volume analysis to confirm the strength of reversal signals, enhancing their reliability.
📈 Stepped Moving Average Trend Indicator : Employs a stepped moving average that adjusts at set intervals to reflect underlying market trends.
⚙️ Customizable Settings : Tailor the indicator to your trading style with adjustable parameters for lookback periods, confirmation windows, moving average types, and more.
🎨 Visual Signals and Trend Coloring : Clear on-chart labels for reversal signals and color-coded trend areas to quickly identify bullish and bearish conditions.
🔔 Alerts for Key Market Events : Set up custom alerts for reversal signals and trend shifts to stay ahead of market movements.
Quick Guide to Using the Reversal Signals Indicator :
🛠 Add the Indicator : Add the indicator to your favorites by pressing the star icon. Customize settings like Candle Lookback, Confirm Within, and Use Volume Confirmation to fit your trading style.
📊 Market Analysis : Observe the "𝓡" labels on the chart indicating bullish and bearish reversal signals. Look for labels below the bars for bullish signals and above the bars for bearish signals. Use the color-filled areas between the stepped moving average and the center line to assess market trends.
🔔 Alerts : Enable notifications for reversal signals and trend shifts to stay informed about market movements without constantly monitoring the chart.
How It Works
The Reversal Signals indicator operates by conducting a thorough analysis of price action over a user-defined lookback period. For a bullish reversal, the indicator checks if the current closing price is lower than the lows of the preceding candles within the lookback window, suggesting a potential oversold condition. If this criterion is met, it marks the candle as a potential reversal point and waits for confirmation within a specified number of subsequent candles. Confirmation occurs when the price rises above the high of the identified candle, signaling a bullish reversal. An optional volume confirmation can be enabled to ensure that the reversal is supported by higher-than-average trading volume, adding an extra layer of validation to the signal. The process is mirrored for bearish reversals, where the indicator looks for the closing price exceeding previous highs and awaits confirmation of a downward move.
Complementing the reversal signals, the indicator features a stepped moving average that serves as a dynamic trend indicator. This moving average updates at intervals defined by the MA Step Period and shifts direction based on price crossings. If the price remains above the stepped MA, it indicates a bullish trend, coloring the area between the MA and the center line in green. Conversely, if the price falls below the stepped MA, a bearish trend is signaled, and the area is shaded red. This visual representation helps traders quickly assess the prevailing market trend and align their trading decisions accordingly.
Experience a new level of market insight with the Reversal Signals indicator. Add it to your TradingView chart today and enhance your ability to detect and act on key ma

ABCD Harmonic Pattern [TradingFinder] ABCD Pattern indicator🔵 Introduction
The ABCD harmonic pattern is a tool for identifying potential reversal zones (PRZ) by using Fibonacci ratios to pinpoint critical price reversal points on price charts.
This pattern consists of four key points, labeled A, B, C, and D. In this structure, the AB and CD waves move in the same direction, while the BC wave acts as a corrective wave in the opposite direction.
The ABCD pattern follows specific Fibonacci ratios that enhance its accuracy in identifying PRZ. Typically, point C lies within the 0.382 to 0.886 Fibonacci retracement of the AB wave, indicating the correction extent of the BC wave.
Subsequently, the CD wave, as the final wave in this pattern, reaches point D with a Fibonacci extension between 1.13 and 2.618 of the BC wave. Point D, which marks the PRZ, is where a potential price reversal is likely to occur.
The ABCD pattern appears in both bullish and bearish forms. In the bullish ABCD pattern, prices tend to increase at point D, which defines the PRZ; in the bearish ABCD pattern, prices typically decrease upon reaching the PRZ at point D.
These characteristics make the ABCD pattern a popular tool for identifying PRZ and price reversal points in financial markets, including forex, cryptocurrencies, and stocks.
Bullish Pattern :
Beaish Pattern :
🔵 How to Use
🟣 Bullish ABCD Pattern
The bullish ABCD pattern is another harmonic structure used to identify a potential reversal zone (PRZ) where the price is likely to rise after a downward movement. This pattern includes four main points A, B, C, and D. In the bullish ABCD, the AB and CD waves move downward, and the BC wave acts as a corrective, upward wave. This setup creates a PRZ at point D, where the price may reverse and move upward.
To identify a bullish ABCD pattern, begin with the downward AB wave. The BC wave retraces upward between 0.382 and 0.886 of the AB wave, indicating the extent of the correction.
After the BC retracement, the CD wave forms and extends from point C down to point D, with an extension of around 1.13 to 2.618 of the BC wave. Point D, as the PRZ, represents the area where the price may reverse upwards, making it a strategic level for potential buy positions.
When the price reaches point D in the bullish ABCD pattern, traders look for upward reversal signals. This can include bullish candlestick formations, such as hammer or morning star patterns, near the PRZ to confirm the trend reversal. Entering a long position after confirmation near point D provides a calculated entry point.
Additionally, placing a stop loss slightly below point D helps protect against potential loss if the reversal does not occur. The ABCD pattern, with its precise Fibonacci structure and PRZ identification, gives traders a disciplined approach to spotting bullish reversals in markets, particularly in forex, cryptocurrency, and stock trading.
Bullish Pattern in COINBASE:BTCUSD :
🟣 Bearish ABCD Pattern
The bearish ABCD pattern is a harmonic structure that indicates a potential reversal zone (PRZ) where price may shift downward after an initial upward movement. This pattern consists of four main points A, B, C, and D. In a bearish ABCD, the AB and CD waves move upward, while the BC wave acts as a corrective wave in the opposite, downward direction. This reversal zone (PRZ) can be identified with specific Fibonacci ratios.
To identify a bearish ABCD pattern, start by observing the AB wave, which forms as an upward price movement. The BC wave, which follows, typically retraces between 0.382 to 0.886 of the AB wave. This retracement indicates how far the correction goes and sets the foundation for the next wave.
Finally, the CD wave extends from point C to reach point D with a Fibonacci extension of approximately 1.13 to 2.618 of the BC wave. Point D represents the PRZ where the potential reversal may occur, making it a critical area for traders to consider short positions.
Once point D in the bearish ABCD pattern is reached, traders can anticipate a downward price movement. At this potential reversal zone (PRZ), traders often wait for additional bearish signals or candlestick patterns, such as engulfing or evening star formations, to confirm the price reversal.
This confirmation around the PRZ enhances the accuracy of the entry point for a bearish position. Setting a stop loss slightly above point D can help manage risk if the price doesn’t reverse as anticipated. The ABCD pattern, with its reliance on Fibonacci ratios and clearly defined points, offers a strategic approach for traders looking to capitalize on potential bearish reversals in financial markets, including forex, stocks, and cryptocurrencies.
Bearish Pattern in OANDA:XAUUSD :
🔵 Setting
🟣 Logical Setting
ZigZag Pivot Period : You can adjust the period so that the harmonic patterns are adjusted according to the pivot period you want. This factor is the most important parameter in pattern recognition.
Show Valid Forma t: If this parameter is on "On" mode, only patterns will be displayed that they have exact format and no noise can be seen in them. If "Off" is, the patterns displayed that maybe are noisy and do not exactly correspond to the original pattern.
Show Formation Last Pivot Confirm : if Turned on, you can see this ability of patterns when their last pivot is formed. If this feature is off, it will see the patterns as soon as they are formed. The advantage of this option being clear is less formation of fielded patterns, and it is accompanied by the latest pattern seeing and a sharp reduction in reward to risk.
Period of Formation Last Pivot : Using this parameter you can determine that the last pivot is based on Pivot period.
🟣 Genaral Setting
Show : Enter "On" to display the template and "Off" to not display the template.
Color : Enter the desired color to draw the pattern in this parameter.
LineWidth : You can enter the number 1 or numbers higher than one to adjust the thickness of the drawing lines. This number must be an integer and increases with increasing thickness.
LabelSize : You can adjust the size of the labels by using the "size.auto", "size.tiny", "size.smal", "size.normal", "size.large" or "size.huge" entries.
🟣 Alert Setting
Alert : On / Off
Message Frequency : This string parameter defines the announcement frequency. Choices include: "All" (activates the alert every time the function is called), "Once Per Bar" (activates the alert only on the first call within the bar), and "Once Per Bar Close" (the alert is activated only by a call at the last script execution of the real-time bar upon closing). The default setting is "Once per Bar".
Show Alert Time by Time Zone : The date, hour, and minute you receive in alert messages can be based on any time zone you choose. For example, if you want New York time, you should enter "UTC-4". This input is set to the time zone "UTC" by default.
🟣 Conclusion
The ABCD harmonic pattern offers a structured approach in technical analysis, helping traders accurately identify potential reversal zones (PRZ) where price movements may shift direction. By leveraging the relationships between points A, B, C, and D, alongside specific Fibonacci ratios, traders can better anticipate points of market reversal and make more informed decisions.
Both the bearish and bullish ABCD patterns enable traders to pinpoint ideal entry points that align with anticipated market shifts. In a bearish ABCD, point D within the PRZ often signals a downward trend reversal, while in a bullish ABCD, this same point typically suggests an upward reversal. The adaptability of the ABCD pattern across different markets, such as forex, stocks, and cryptocurrencies, further highlights its utility and reliability.
Integrating the ABCD pattern into a trading strategy provides a methodical and calculated approach to entry and exit decisions. With accurate application of Fibonacci ratios and confirmation of the PRZ, traders can enhance their trading precision, reduce risks, and boost overall performance. The ABCD harmonic pattern remains a valuable resource for traders aiming to leverage structured patterns for consistent results in their technical analysis.

Moving Average Pullback Signals [UAlgo]The "Moving Average Pullback Signals " indicator is designed to identify potential trend continuation or reversal points based on moving average (MA) pullback patterns. This tool combines multiple types of moving averages, customized trend validation parameters, and candlestick wick patterns to provide reliable buy and sell signals. By leveraging several advanced MA methods (such as TEMA, DEMA, ZLSMA, and McGinley-D), this script can adapt to different market conditions, providing traders with flexibility and more precise trend-based entries and exits. The addition of a gradient color-coded moving average line and wick validation logic enables traders to visualize market sentiment and trend strength dynamically.
🔶 Key Features
Multiple Moving Average (MA) Calculation Methods: This indicator offers various MA calculation types, including SMA, EMA, DEMA, TEMA, ZLSMA, and McGinley-D, allowing traders to select the MA that best fits their strategy.
Trend Validation and Pattern Recognition: The indicator includes a customizable trend validation length, ensuring that the trend is consistent before buy/sell signals are generated. The "Trend Pattern Mode" setting provides flexibility between "No Trend in Progress," "Trend Continuation," and "Both," tailoring signals to the trader’s preferred style.
Wick Validation Logic: To enhance the accuracy of entries, this indicator identifies specific wick patterns for bullish or bearish pullbacks, which signal potential trend continuation or reversal. Wick length and validation factor are adjustable to suit various market conditions and timeframes.
Gradient Color-coded MA Line: This feature provides a quick visual cue for trend strength, with color changes reflecting relative highs and lows of the MA, enhancing market sentiment interpretation.
Alerts for Buy and Sell Signals: Alerts are triggered when either a bullish or bearish pullback is detected, allowing traders to receive instant notifications without continuously monitoring the chart.
Visual Labels for Reversal Points: The indicator plots labels ("R") at potential reversal points, with color-coded labels for bullish (green) and bearish (red) pullbacks, highlighting pullback opportunities that align with the trend or reversal potential.
🔶 Disclaimer
Use with Caution: This indicator is provided for educational and informational purposes only and should not be considered as financial advice. Users should exercise caution and perform their own analysis before making trading decisions based on the indicator's signals.
Not Financial Advice: The information provided by this indicator does not constitute financial advice, and the creator (UAlgo) shall not be held responsible for any trading losses incurred as a result of using this indicator.
Backtesting Recommended: Traders are encouraged to backtest the indicator thoroughly on historical data before using it in live trading to assess its performance and suitability for their trading strategies.
Risk Management: Trading involves inherent risks, and users should implement proper risk management strategies, including but not limited to stop-loss orders and position sizing, to mitigate potential losses.
No Guarantees: The accuracy and reliability of the indicator's signals cannot be guaranteed, as they are based on historical price data and past performance may not be indicative of future results.

ICT Setup 02 [TradingFinder] Breaker Blocks + Reversal Candles🔵 Introduction
The "Breaker Block" concept, widely utilized in ICT (Inner Circle Trader) technical analysis, is a crucial tool for identifying reversal points and significant market shifts. Originating from the "Order Block" concept, Breaker Blocks help traders pinpoint support and resistance levels. These blocks are essential for understanding market trends and recognizing optimal entry and exit points.
A Breaker Block is essentially a failed Order Block that changes its role when price action breaks through it. When an Order Block fails to hold as a support or resistance level, it reverses its function, becoming a Breaker Block.
There are two primary types : Bullish Breaker Blocks and Bearish Breaker Blocks. These Breaker Blocks align with the prevailing market trend and indicate potential entry points after a liquidity sweep or a shift in market structure.
Understanding and applying the Breaker Block strategy enables traders to capitalize on the behavior of institutional investors, enhancing their trading outcomes.
Bullish Setup :
Bearish Setup :
🔵 How to Use
The ICT Setup 02 indicator designed to automate the identification of Bullish and Bearish Breaker Blocks. This tool enables traders to easily spot these blocks on a chart and utilize them for entering or exiting trades. Below is a breakdown of how to use this indicator in both bullish and bearish setups.
🟣 Bullish Breaker Block Setup
A Bullish Breaker Block setup is identified in an uptrend, where it serves as a potential entry point. This setup occurs when a Bearish Order Block fails and the price moves above the high of that Order Block. In this scenario, the previously bearish Order Block turns into a Bullish Breaker Block, which now acts as a support level for the price.
To trade a Bullish Breaker Block, wait for the price to retest this newly formed support level. Confirmation of the uptrend can be achieved by analyzing lower time frames for further market structure shifts or other bullish indicators.
A successful retest of the Bullish Breaker Block provides a high-probability entry point for a long trade, as it signals institutional support. Traders often place their stop-loss below the low of the Breaker Block zone to minimize risk.
🟣 Bearish Breaker Block Setup
A Bearish Breaker Block setup, conversely, is used in a downtrend to identify potential sell opportunities. This setup forms when a Bullish Order Block fails, and the price moves below the low of that Order Block.
Once this Order Block is broken, it reverses its role and becomes a Bearish Breaker Block, providing resistance to the price as it pushes downward. For a Bearish Breaker Block trade, wait for the price to retest this resistance level.
A confirmation of the downtrend, such as a market structure shift on a lower time frame or additional bearish signals, strengthens the setup. The Bearish Breaker Block retest provides an opportunity to enter a short position, with a stop-loss placed just above the high of the Breaker Block zone.
🔵 Settings
Pivot Period : This setting controls the look-back period used to identify pivot points that contribute to the detection of Order Blocks. A higher period captures longer-term pivots, while a lower period focuses on more recent price action. Adjusting this parameter allows traders to fine-tune the indicator to match their trading time frame.
Breaker Block Validity Period : This setting defines how long a Breaker Block remains valid based on the number of bars elapsed since its formation. Increasing the validity period keeps Breaker Blocks active for a longer duration, which can be useful for higher time frame analysis.
Mitigation Level BB : This option lets traders choose the level of the Order Block at which the price is expected to react. Options like "Proximal," "50% OB," and "Distal" adjust the zone where a reaction may occur, offering flexibility in setting up the entry and stop-loss levels.
Breaker Block Refinement : The refinement option refines the Breaker Block zone to display a more precise range for aggressive or defensive trading approaches. The "Aggressive" mode provides a tighter range for risk-tolerant traders, while the "Defensive" mode expands the zone for those with a more conservative approach.
🔵 Conclusion
The Breaker Block indicator provides traders with a sophisticated tool for identifying key reversal zones in the market. By leveraging Breaker Blocks, traders can gain insights into institutional order flow and predict critical support and resistance levels.
Using Breaker Blocks in conjunction with other ICT concepts, like Fair Value Gaps or liquidity sweeps, enhances the reliability of trading signals. This indicator empowers traders to make informed decisions, aligning their trades with institutional moves in the market.
As with any trading strategy, it is crucial to incorporate proper risk management, using stop-losses and position sizing to minimize potential losses. The Breaker Block strategy, when applied with discipline and thorough analysis, serves as a powerful addition to any trader’s toolkit.

High/Low Location Frequency [LuxAlgo]The High/Low Location Frequency tool provides users with probabilities of tops and bottoms at user-defined periods, along with advanced filters that offer deep and objective market information about the likelihood of a top or bottom in the market.
🔶 USAGE
There are four different time periods that traders can select for analysis of probabilities:
HOUR OF DAY: Probability of occurrence of top and bottom prices for each hour of the day
DAY OF WEEK: Probability of occurrence of top and bottom prices for each day of the week
DAY OF MONTH: Probability of occurrence of top and bottom prices for each day of the month
MONTH OF YEAR: Probability of occurrence of top and bottom prices for each month
The data is displayed as a dashboard, which users can position according to their preferences. The dashboard includes useful information in the header, such as the number of periods and the date from which the data is gathered. Additionally, users can enable active filters to customize their view. The probabilities are displayed in one, two, or three columns, depending on the number of elements.
🔹 Advanced Filters
Advanced Filters allow traders to exclude specific data from the results. They can choose to use none or all filters simultaneously, inputting a list of numbers separated by spaces or commas. However, it is not possible to use both separators on the same filter.
The tool is equipped with five advanced filters:
HOURS OF DAY: The permitted range is from 0 to 23.
DAYS OF WEEK: The permitted range is from 1 to 7.
DAYS OF MONTH: The permitted range is from 1 to 31.
MONTHS: The permitted range is from 1 to 12.
YEARS: The permitted range is from 1000 to 2999.
It should be noted that the DAYS OF WEEK advanced filter has been designed for use with tickers that trade every day, such as those trading in the crypto market. In such cases, the numbers displayed will range from 1 (Sunday) to 7 (Saturday). Conversely, for tickers that do not trade over the weekend, the numbers will range from 1 (Monday) to 5 (Friday).
To illustrate the application of this filter, we will exclude results for Mondays and Tuesdays, the first five days of each month, January and February, and the years 2020, 2021, and 2022. Let us review the results:
DAYS OF WEEK: `2,3` or `2 3` (for crypto) or `1,2` or `1 2` (for the rest)
DAYS OF MONTH: `1,2,3,4,5` or `1 2 3 4 5`
MONTHS: `1,2` or `1 2`
YEARS: `2020,2021,2022` or `2020 2021 2022`
🔹 High Probability Lines
The tool enables traders to identify the next period with the highest probability of a top (red) and/or bottom (green) on the chart, marked with two horizontal lines indicating the location of these periods.
🔹 Top/Bottom Labels and Periods Highlight
The tool is capable of indicating on the chart the upper and lower limits of each selected period, as well as the commencement of each new period, thus providing traders with a convenient reference point.
🔶 SETTINGS
Period: Select how many bars (hours, days, or months) will be used to gather data from, max value as default.
Execution Window: Select how many bars (hours, days, or months) will be used to gather data from
🔹 Advanced Filters
Hours of day: Filter which hours of the day are excluded from the data, it accepts a list of hours from 0 to 23 separated by commas or spaces, users can not mix commas or spaces as a separator, must choose one
Days of week: Filter which days of the week are excluded from the data, it accepts a list of days from 1 to 5 for tickers not trading weekends, or from 1 to 7 for tickers trading all week, users can choose between commas or spaces as a separator, but can not mix them on the same filter.
Days of month: Filter which days of the month are excluded from the data, it accepts a list of days from 1 to 31, users can choose between commas or spaces as separator, but can not mix them on the same filter.
Months: Filter months to exclude from data. Accepts months from 1 to 12. Choose one separator: comma or space.
Years: Filter years to exclude from data. Accepts years from 1000 to 2999. Choose one separator: comma or space.
🔹 Dashboard
Dashboard Location: Select both the vertical and horizontal parameters for the desired location of the dashboard.
Dashboard Size: Select size for dashboard.
🔹 Style
High Probability Top Line: Enable/disable `High Probability Top` vertical line and choose color
High Probability Bottom Line: Enable/disable `High Probability Bottom` vertical line and choose color
Top Label: Enable/disable period top labels, choose color and size.
Bottom Label: Enable/disable period bottom labels, choose color and size.
Highlight Period Changes: Enable/disable vertical highlight at start of period

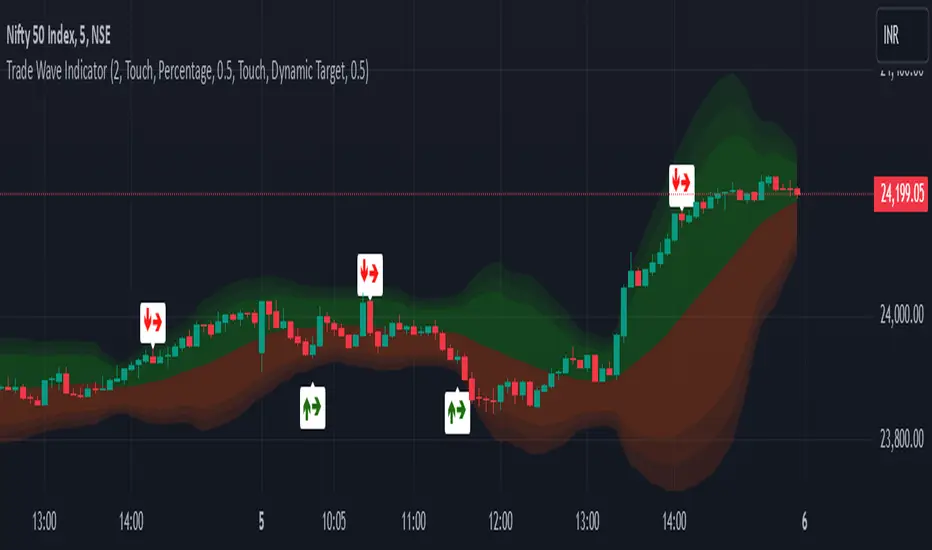
Trade Wave [Bluechip Algos]Trade Wave is a momentum-based indicator designed to show reversal signals. Most of the time, markets are in range bound and this indicator tries to show you the overbought and oversold zone of the time frame you select. It works well during range bound market giving you reversal signals at highs and lows of the range. One can make use of "Momentum tuning" in inputs section to pick the level of momentum aggressiveness. If value is higher, signals will be lesser and if value is low signals will be more. One can also choose different types of stop-losses and targets.
Stop Loss Types:
Fixed SL: Set a fixed stop loss value for consistent risk management.
Dynamic SL: Adjusts with the market, providing a flexible stop loss that moves with price changes.
Previous Candle SL: Stop losses based on the recent low (for sell signals) or high (for buy signals) of the last few candles.
Target Types:
Fixed Target: Set a fixed target value for consistent profit goals.
Dynamic Target: Adjusts with market movements to maximize potential gains.
Risk:Reward Target: Define targets based on SL risk:reward ratios (e.g., 1:2), allowing for personalized risk management strategies.
Suggestion: It's better to take reversal confirmation from multiple time frames instead of relying on just one.
Power Root SuperTrend [AlgoAlpha]📈🚀 Power Root SuperTrend by AlgoAlpha - Elevate Your Trading Strategy! 🌟
Introducing the Power Root SuperTrend by AlgoAlpha, an advanced trading indicator that enhances the traditional SuperTrend by incorporating Root-Mean-Square (RMS) calculations for a more responsive and adaptive trend detection. This innovative tool is designed to help traders identify trend directions, potential take-profit levels, and optimize entry and exit points with greater accuracy, making it an excellent addition to your trading arsenal.
Key Features:
🔹 Root-Mean-Square SuperTrend Calculation : Utilizes the RMS of closing prices to create a smoother and more sensitive SuperTrend line that adapts quickly to market changes.
🔸 Multiple Take-Profit Levels : Automatically calculates and plots up to seven take-profit levels (TP1 to TP7) based on market volatility and the change in SuperTrend values.
🟢 Dynamic Trend Coloring : Visually distinguish between bullish and bearish trends with customizable colors for clearer market visualization.
📊 RSI-Based Take-Profit Signals : Incorporates the Relative Strength Index (RSI) of the distance between the price and the SuperTrend line to generate additional take-profit signals.
🔔 Customizable Alerts : Set alerts for trend direction changes, achievement of take-profit levels, and RSI-based take-profit conditions to stay informed without constant chart monitoring.
How to Use:
Add the Indicator : Add the indicator to favorites by pressing the ⭐ icon or search for "Power Root SuperTrend " in the TradingView indicators library and add it to your chart. Adjust parameters such as the ATR multiplier, ATR length, RMS length, and RSI take-profit length to suit your trading style and the specific asset you are analyzing.
Analyze the Chart : Observe the SuperTrend line and the plotted take-profit levels. The color changes indicate trend directions—green for bullish and red for bearish trends.
Set Alerts : Utilize the built-in alert conditions to receive notifications when the trend direction changes, when each TP level is drawn, or when RSI-based take-profit conditions are met.
How It Works:
The Power Root SuperTrend indicator enhances traditional SuperTrend calculations by applying a Root-Mean-Square (RMS) function to the closing prices, resulting in a more responsive trend line that better reflects recent price movements. It calculates the Average True Range (ATR) to determine the volatility and sets the upper and lower SuperTrend bands accordingly. When a trend direction change is detected—signified by the SuperTrend line switching from above to below the price or vice versa—the indicator calculates the change in the SuperTrend value. This change is then used to establish multiple take-profit levels (TP1 to TP7), each representing incremental targets based on market volatility. Additionally, the indicator computes the RSI of the distance between the current price and the SuperTrend line to generate extra take-profit signals when the RSI crosses under a specific threshold. The combination of RMS calculations, multiple TP levels, dynamic coloring, and RSI signals provides traders with a comprehensive tool for identifying trends and optimizing trade exits. Customizable alerts ensure that traders can stay updated on important market developments without needing to constantly watch the charts.
Elevate your trading strategy with the Power Root SuperTrend indicator and gain a smarter edge in the markets! 🚀✨

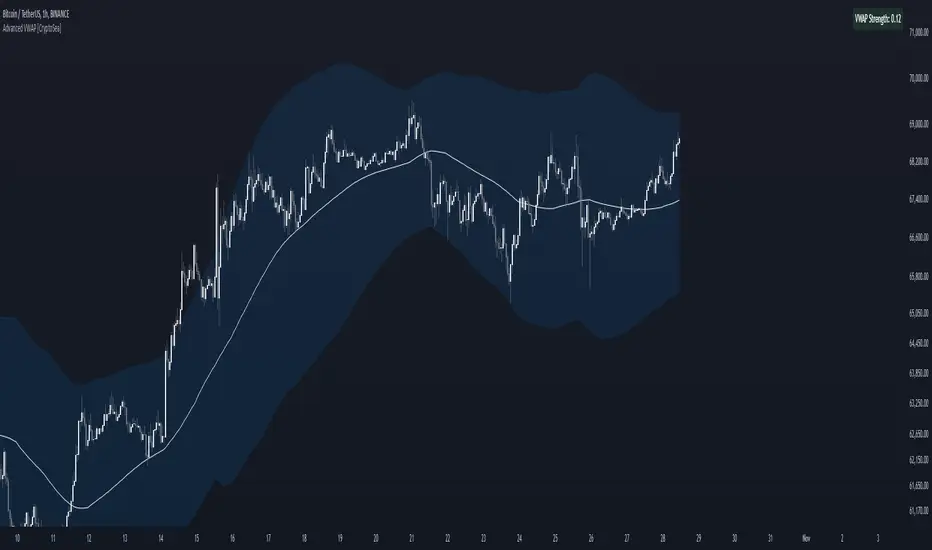
Advanced VWAP [CryptoSea]The Advanced VWAP is a comprehensive volume-weighted average price (VWAP) tool designed to provide traders with a deeper understanding of market trends through multi-layered VWAP analysis. This indicator is ideal for those who want to track price movements in relation to VWAP bands and detect key market levels with greater precision.
Key Features
Multi-Timeframe VWAP Bands: Includes multiple VWAP bands with different lookback periods (5, 10, 25, and 50), allowing traders to observe short-term and long-term price behavior.
Smoothed Band Options: Offers optional smoothing of VWAP bands to reduce noise and highlight significant trends more clearly.
Dynamic Median Line Display: Plots the median line of the VWAP bands, providing a reference for price movements and potential reversal zones.
VWAP Trend Strength Calculation: Measures the strength of the trend based on the price's position relative to the VWAP bands, normalized between -1 and 1 for easier interpretation.
In the example below we can see the VWAP Forecastd Cloud, which consists of multiple layers of VWAP bands with varying lookback periods, creating a dynamic forecast visualization. The cloud structure represents potential future price ranges by projecting VWAP-based bands outward, with darker areas indicating higher density and overlap of the bands, suggesting stronger support or resistance zones. This approach helps traders anticipate price movement and identify areas of potential consolidation or breakout as the price interacts with different layers of the forecast cloud.
How it Works
VWAP Calculation: Utilizes multiple VWAP calculations based on various lookback periods to capture a broad range of price behaviors. The indicator adapts to different market conditions by switching between short-term and long-term VWAP references.
Smoothing Algorithms: Provides the ability to smooth the VWAP bands using different moving average types (SMA, EMA, SMMA, WMA, VWMA) to suit various trading strategies and reduce market noise.
Trend Strength Analysis: Computes the trend strength based on the price's distance from the VWAP bands, with a value range of -1 to 1. This feature helps traders identify the intensity of uptrends and downtrends.
Alert Conditions: Includes alert options for crossing above or below the smoothed median line, as well as touching the smoothed upper or lower bands, providing timely notifications for potential trading opportunities.
This image below illustrates the use of smoothed VWAP bands, which provide a cleaner representation of the price's relationship to the VWAP by reducing market noise. The smoothed bands create a flowing cloud-like structure, making it easier to observe significant trends and potential reversal points. The circles highlight areas where the price interacts with the smoothed bands, indicating potential key levels for trend continuation or reversal. This setup helps traders focus on meaningful movements and filter out minor fluctuations, improving the identification of strategic entry and exit points based on smoother trend signals.
Application
Strategic Entry and Exit Points: Helps traders identify optimal entry and exit points based on the interaction with VWAP bands and trend strength readings.
Trend Confirmation: Assists in confirming trend strength by analyzing price movements relative to the VWAP bands and detecting significant breaks or touches.
Customized Analysis: Supports a wide range of trading styles by offering adjustable smoothing, band settings, and alert conditions to meet specific trading needs.
The Advanced VWAP by is a valuable addition to any trader's toolkit, offering versatile features to navigate different market scenarios with confidence. Whether used for day trading or longer-term analysis, this tool enhances decision-making by providing a robust view of price behavior relative to VWAP levels.
TradingIQ - Reversal IQIntroducing "Reversal IQ" by TradingIQ
Reversal IQ is an exclusive trading algorithm developed by TradingIQ, designed to trade trend reversals in the market. By integrating artificial intelligence and IQ Technology, Reversal IQ analyzes historical and real-time price data to construct a dynamic trading system adaptable to various asset and timeframe combinations.
Philosophy of Reversal IQ
Reversal IQ integrates IQ Technology (AI) with the timeless concept of reversal trading. Markets follow trends that inevitably reverse at some point. Rather than relying on rigid settings or manual judgment to capture these reversals, Reversal IQ dynamically designs, creates, and executes reversal-based trading strategies.
Reversal IQ is designed to work straight out of the box. In fact, its simplicity requires just one user setting, making it incredibly straightforward to manage.
AI Aggressiveness is the only setting that controls how Reversal IQ works.
Traders don’t have to spend hours adjusting settings and trying to find what works best - Reversal IQ handles this on its own.
Key Features of Reversal IQ
Self-Learning Reversal Detection
Employs AI and IQ Technology to identify trend reversals in real-time.
AI-Generated Trading Signals
Provides reversal trading signals derived from self-learning algorithms.
Comprehensive Trading System
Offers clear entry and exit labels.
AI-Determined Profit Target and Stop Loss
Position exit levels are clearly defined and calculated by the AI once the trade is entered.
Performance Tracking
Records and presents trading performance data, easily accessible for user analysis.
Configurable AI Aggressiveness
Allows users to adjust the AI's aggressiveness to match their trading style and risk tolerance.
Long and Short Trading Capabilities
Supports both long and short positions to trade various market conditions.
IQ Channel
The IQ Channel represents what Reversal IQ considers a tradable long opportunity or a tradable short opportunity. The channel is dynamic and adjusts from chart to chart.
IQMA – Proprietary Moving Average
Introduces the IQ Moving Average (IQMA), designed to classify overarching market trends.
IQCandles – Trend Classification Tool
Complements IQMA with candlestick colors designed for trend identification and analysis.
How It Works
Reversal IQ operates on a straightforward heuristic: go long during an extended downside move and go short during an extended upside move.
What defines an "extended move" is determined by IQ Technology, TradingIQ's exclusive AI algorithm. For Reversal IQ, the algorithm assesses the extent to which historical high and low prices are breached. By learning from these price level violations, Reversal IQ adapts to trade future, similar violations in a recurring manner. It calculates a price area, distant from the current price, where a reversal is anticipated.
In simple terms, price peaks (tops) and troughs (bottoms) are stored for Reversal IQ to learn from. The degree to which these levels are violated by subsequent price movements is also recorded. Reversal IQ continuously evaluates this stored data, adapting to market volatility and raw price fluctuations to better capture price reversals.
What classifies as a price top or price bottom?
For Reversal IQ, price tops are considered the highest price attained before a significant downside reversal. Price bottoms are considered the lowest price attained before a significant upside reversal. The highest price achieved is continuously calculated before a significant counter trend price move renders the high price as a swing high. The lowest price achieved is continuously calculated before a significant counter trend price move renders the low price as a swing low.
The image above illustrates the IQ channel and explains the corresponding prices and levels
The blue lower line represents the Long Reversal Level, with the price highlighted in blue showing the Long Reversal Price.
The red upper line represents the Short Reversal Level, with the price highlighted in red showing the Short Reversal Price.
Limit orders are placed at both of these levels. As soon as either level is touched, a trade is immediately executed.
The image above shows a long position being entered after the Long Reversal Level was reached. The profit target and stop loss are calculated by Reversal IQ
The blue line indicates where the profit target is placed (acting as a limit order).
The red line shows where the stop loss is placed (acting as a stop loss order).
Green arrows indicate that the strategy entered a long position at the highlighted price level.
You can also hover over the trade labels to get more information about the trade—such as the entry price, profit target, and stop loss.
The image above demonstrates the profit target being hit for the trade. All profitable trades are marked by a blue arrow and blue line. Hover over the blue arrow to obtain more details about the trade exit.
The image above depicts a short position being entered after the Short Reversal Level was touched. The profit target and stop loss are calculated by the AI
The blue line indicates where the profit target is placed (acting as a limit order).
The red line shows where the stop loss is placed (acting as a stop loss order).
The image above shows the profit target being hit for the short trade. Profitable trades are indicated by a blue arrow and blue line. Hover over the blue arrow to access more information about the trade exit.
Long Entry: Green Arrow
Short Entry: Red Arrow
Profitable Trades: Blue Arrow
Losing Trades: Red Arrow
IQMA
The IQMA implements a dynamic moving average that adapts to market conditions by adjusting its smoothing factor based on its own slope. This makes it more responsive in volatile conditions (steeper slopes) and smoother in less volatile conditions.
The IQMA is not used by Reversal IQ as a trade condition; however, the IQMA can be used by traders to characterize the overarching trend and elect to trade only long positions during bullish conditions and only short positions during bearish conditions.
The IQMA is an adaptive smoothing function that applies a combination of multiple moving averages to reduce lag and noise in the data. The adaptiveness is achieved by dynamically adjusting the Volatility Factor (VF) based on the slope (derivative) of the price trend, making it more responsive to strong trends and smoother in consolidating markets.
This process effectively makes the moving average a self-adjusting filter, the IQMA attempts to track both trending and ranging market conditions by dynamically changing its sensitivity in response to price movements.
When IQMA is blue, an overarching uptrend is in place. When IQMA is red, an overarching downtrend is in place.
IQ Candles
IQ Candles are price candles color-coordinated with IQMA. IQ Candles help visualize the overarching trend and are not used by Reversal IQ to determine trade entries and trade exits.
AI Aggressiveness
Reversal IQ has only one setting that controls its functionality.
AI Aggressiveness controls the aggressiveness of the AI. This setting has three options: Sniper, Aggressive, and Very Aggressive.
Sniper Mode
In Sniper Mode, Reversal IQ will prioritize trading large deviations from established reversal levels and extracting the largest countertrend move possible from them.
Aggressive Mode
In Aggressive Mode, Reversal IQ still prioritizes quality but allows for strong, quantity-based signals. More trades will be executed in this mode with tighter stops and profit targets. Aggressive mode forces Reversal IQ to learn from narrower raw-dollar violations of historical levels.
Very Aggressive Mode
In Very Aggressive Mode, Reversal IQ still prioritizes the strongest quantity-based signals. Stop and target distances aren't inherently affected, but entries will be aggressive while prioritizing performance. Very Aggressive mode forces Reversal IQ to learn from narrower raw-dollar violations of historical levels and also forces it to embrace volatility more aggressively.
AI Direction
The AI Direction setting controls the trade direction Reversal IQ is allowed to take.
“Both” allows for both long and short trades.
“Long” allows for only long trades.
“Short” allows for only short trades.
Verifying Reversal IQ’s Effectiveness
Reversal IQ automatically tracks its performance and displays the profit factor for the long strategy and the short strategy it uses. This information can be found in a table located in the top-right corner of your chart.
The image above shows the long strategy profit factor and the short strategy profit factor for Reversal IQ.
A profit factor greater than 1 indicates a strategy profitably traded historical price data.
A profit factor less than 1 indicates a strategy unprofitably traded historical price data.
A profit factor equal to 1 indicates a strategy did not lose or gain money when trading historical price data.
Using Reversal IQ
While Reversal IQ is a full-fledged trading system with entries and exits, it was designed for the manual trader to take its trading signals and analysis indications to greater heights - offering numerous applications beyond its built-in trading system.
The hallmark feature of Reversal IQ is its sniper-like reversal signals. While exits are dynamically calculated as well, Reversal IQ simply has a knack for "sniping" price reversals.
When performing live analysis, you can use the IQ Channel to evaluate price reversal areas, whether price has extended too far in one direction, and whether price is likely to reverse soon.
Of course, in times of exuberance or panic, price may push through the reversal levels. While infrequent, it can happen to any indicator.
The deeper price moves into the bullish reversal area (blue) the better chance that price has extended too far and will reverse to the upside soon. The deeper price moves into the bearish reversal area (red) the better chance that price has extended too far and will reverse to the downside soon.
Of course, you can set alerts for all Reversal IQ entry and exit signals, effectively following along its systematic conquest of price movement.
유료 스크립트

5-0 Harmonic Pattern [TradingFinder] 0XABCD 50 Harmonic Detector🔵 Introduction
Harmonic patterns are a powerful tool in technical analysis, widely used to detect reversal points and trend changes. Among these, the 5-0 Harmonic Pattern stands out due to its reliance on specific Fibonacci ratios—1.13, 1.618, 2.24, and 0.45 to 0.55—anchored at points 0, X, A, B, C, and D. This pattern provides a structured approach for identifying critical buy and sell points, helping traders achieve optimal entry and exit levels in volatile markets.
This 5-0 Harmonic Pattern indicator automatically detects and marks bullish and bearish formations on the chart, offering precise trading signals based on established harmonic ratios. With its dynamic signals, the 5-0 pattern enables traders to anticipate market movements and capitalize on favorable price trends.
Especially in fast-moving markets, harmonic patterns, particularly the 5-0 Harmonic Pattern, equip traders with an essential framework for identifying reversal opportunities and refining their trading strategies.
Bullish 5-0 Pattern :
Bearish 5-0 Pattern :
🔵 How to Use
The 5-0 Harmonic Pattern indicator is designed to automatically mark the key levels of the harmonic structure: 0, X, A, B, C, and D. By doing so, it detects both bullish and bearish patterns and helps traders recognize optimal entry and exit points.
Formed through specific Fibonacci levels, this pattern signals potential shifts in trend direction, giving traders critical insights for managing entries and exits effectively. The tool proves valuable in high-volatility settings, enabling traders to leverage these signals for refined decision-making.
🟣 Bullish 5-0 Pattern
A bullish 5-0 pattern materializes when Fibonacci levels indicate a potential price reversal to the upside. With points 0, X, A, B, C, and D in alignment, the indicator highlights this upward momentum by displaying a green arrow as a buy signal on the chart. This marking provides a clear entry point, indicating that prices are likely to rise, making it a prime moment for traders to enter long positions.
Additionally, the bullish 5-0 pattern is equipped with tools for traders to set stop-loss and take-profit points based on harmonic lines within the pattern, which represent support and resistance levels. Using these dynamic points, traders can create a more effective risk-reward setup while following the bullish signals in a standalone harmonic strategy.
🟣 Bearish 5-0 Pattern
The bearish 5-0 pattern functions similarly but signals a likely downturn. This pattern emerges when Fibonacci ratios align at points 0, X, A, B, C, and D, predicting a reversal downward. The indicator generates a sell signal, marked by a red arrow, prompting traders to exit long positions or initiate short trades to capitalize on falling prices.
Traders can utilize this bearish pattern for defining exit strategies and setting key levels for stop-loss and take-profit orders. The bearish 5-0 pattern enhances traders’ abilities to gauge critical price levels and manage trade risk effectively, especially in volatile markets. For traders focused on profiting from downward trends, this indicator serves as a powerful tool for timely entries and exits.
🔵 Setting
🟣 Logical Setting
ZigZag Pivot Period : You can adjust the period so that the harmonic patterns are adjusted according to the pivot period you want. This factor is the most important parameter in pattern recognition.
Show Valid Forma t: If this parameter is on "On" mode, only patterns will be displayed that they have exact format and no noise can be seen in them. If "Off" is, the patterns displayed that maybe are noisy and do not exactly correspond to the original pattern.
Show Formation Last Pivot Confirm : if Turned on, you can see this ability of patterns when their last pivot is formed. If this feature is off, it will see the patterns as soon as they are formed. The advantage of this option being clear is less formation of fielded patterns, and it is accompanied by the latest pattern seeing and a sharp reduction in reward to risk.
Period of Formation Last Pivot : Using this parameter you can determine that the last pivot is based on Pivot period.
🟣 Genaral Setting
Show : Enter "On" to display the template and "Off" to not display the template.
Color : Enter the desired color to draw the pattern in this parameter.
LineWidth : You can enter the number 1 or numbers higher than one to adjust the thickness of the drawing lines. This number must be an integer and increases with increasing thickness.
LabelSize : You can adjust the size of the labels by using the "size.auto", "size.tiny", "size.smal", "size.normal", "size.large" or "size.huge" entries.
🟣 Alert Setting
Alert : On / Off
Message Frequency : This string parameter defines the announcement frequency. Choices include: "All" (activates the alert every time the function is called), "Once Per Bar" (activates the alert only on the first call within the bar), and "Once Per Bar Close" (the alert is activated only by a call at the last script execution of the real-time bar upon closing). The default setting is "Once per Bar".
Show Alert Time by Time Zone : The date, hour, and minute you receive in alert messages can be based on any time zone you choose. For example, if you want New York time, you should enter "UTC-4". This input is set to the time zone "UTC" by default.
Conclusion
The 5-0 Harmonic Pattern indicator serves as a robust solution for technical analysts and traders looking to pinpoint market reversal points. By automatically recognizing 5-0 patterns and generating buy and sell signals based on Fibonacci ratios, this tool supports precise trend analysis and entry/exit timing. The indicator’s adjustable alerts, color themes, and pattern toggles allow for comprehensive customization, ensuring alignment with individual trading strategies.
Harmonic patterns, especially the 5-0 Harmonic Pattern, guide traders in identifying high-accuracy entry and exit points, thus aiding in more informed trading decisions. By combining Fibonacci ratio analysis with real-time signal updates, this indicator provides a well-rounded approach for risk management and capitalizing on trading opportunities. Professional traders can harness this tool to enhance technical analysis precision and capitalize on price trends effectively, maximizing profitability in both bullish and bearish markets.

Price Action StrategyThe **Price Action Strategy** is a tool designed to capture potential market reversals by utilizing classic reversal candlestick patterns such as Hammer, Shooting Star, Doji, and Pin Bar near dinamic support and resistance levels.
***Note to moderators
- The moving average was removed from the strategy because it was not suitable for the strategy and not participating in the entry or exit criteria.
- The moving average length has been replaced/renamed by the support/resistance lenght.
- The bullish engulfing and bearish engulfing patterns were also removed because in practice they were not working as entry criteria, since the candle price invariably closes far from the support/resistance level even considering the sensitivity range. There was no change in the backtest results after removing these patterns.
### Key Elements of the Strategy
1. Support and Resistance Levels
- Support and resistance are pivotal price levels where the asset has previously struggled to move lower (support) or higher (resistance). These levels act as psychological barriers where buying interest (at support) or selling interest (at resistance) often increases, potentially causing price reversals.
- In this strategy, support is calculated as the lowest low and resistance as the highest high over a 16-period length. When the price nears these levels, it indicates possible zones for a reversal, and the strategy looks for specific candlestick patterns to confirm an entry.
2. Candlestick Patterns
- This strategy uses classic reversal patterns, including:
- **Hammer**: Indicates a buy signal, suggesting rejection of lower prices.
- **Shooting Star**: Suggests a sell signal, showing rejection of higher prices.
- **Doji**: Reflects indecision and potential reversal.
- **Pin Bar**: Represents price rejection with a long shadow, often signaling a reversal.
By combining these reversal patterns with the proximity to dinamic support or resistance levels, the strategy aims to capture potential reversal movements.
3. Sensitivity Level
- The sensitivity parameter adjusts the acceptable range (Default 0.018 = 1.8%) around support and resistance levels within which reversal patterns can trigger trades (i.e. the closing price of the candle must occur within the specified range defined by the sensitivity parameter). A higher sensitivity value expands this range, potentially leading to less accurate signals, as it may allow for more false positives.
4. Entry Criteria
- **Buy (Long)**: A Hammer, Doji, or Pin Bar pattern near support.
- **Sell (Short)**: A Shooting Star, Doji, or Pin Bar near resistance.
5. Exit criteria
- Take profit = 9.5%
- Stop loss = 16%
6. No Repainting
- The Price Action Strategy is not subject to repainting.
7. Position Sizing by Equity and risk management
- This strategy has a default configuration to operate with 35% of the equity. The stop loss is set to 16% from the entry price. This way, the strategy is putting at risk about 16% of 35% of equity, that is, around 5.6% of equity for each trade. The percentage of equity and stop loss can be adjusted by the user according to their risk management.
8. Backtest results
- This strategy was subjected to deep backtest and operations in replay mode on **1000000MOGUSDT.P**, with the inclusion of transaction fees at 0.12% and slipagge of 5 ticks, and the past results have shown consistent profitability. Past results are no guarantee of future results. The strategy's backtest results may even be due to overfitting with past data.
9. Chart Visualization
- Support and resistance levels are displayed as green (support) and red (resistance) lines.
- Only the candlestick pattern that generated the entry signal to triger the trade is identified and labeled on the chart. During the operation, the occurrence of new Doji, Pin Bar, Hammer and Shooting Star patterns will not be demonstrated on the chart, since the exit criteria are based on percentage take profit and stop loss.
Doji:
Pin Bar and Doji
Shooting Star and Doji
Hammer
10. Default settings
Chart timeframe: 20 min
Moving average lenght: 16
Sensitivity: 0.018
Stop loss (%): 16
Take Profit (%): 9.5
BYBIT:1000000MOGUSDT.P

Candle Series AnalysisThis advanced indicator is designed to analyze and predict potential market movements based on historical candle series patterns. It goes beyond simple candle-by-candle analysis by examining entire series of consecutive bullish or bearish candles, providing a more comprehensive view of market trends and potential reversals.
The indicator works by identifying the current series of candles (either bullish or bearish) and calculating its percentage change from the start to the current price. It then searches through historical data to find similar candle series patterns, comparing their characteristics to the current one. The analysis includes the series type (bullish or bearish), length (number of candles), and percentage change.
One of the key features of this indicator is its ability to adjust for varying degrees of similarity. Users can set a similarity threshold, allowing them to control how closely historical patterns must match the current one to be considered in the analysis. This flexibility enables traders to fine-tune the indicator to their specific needs and market conditions.
The indicator displays its findings in a customizable table on the chart. The table provides valuable information such as the current series type, length, and percentage change. It also shows the number of similar historical patterns found and the average price change that occurred a specified number of bars after these similar patterns.
Traders can use this information to gain insights into potential future price movements. For example, if the indicator finds that similar bullish series in the past were often followed by a continued uptrend, it might suggest a higher probability of further gains. Conversely, if bearish series typically led to reversals, it could signal a potential buying opportunity.
The script offers extensive customization options. Users can adjust the analysis period, projection length, similarity threshold, table position, text size, and color scheme. This flexibility allows traders to integrate the indicator seamlessly into their existing chart setups and trading strategies.
I personally find this indicator particularly useful for analyzing market behavior in assets that tend to exhibit trending behavior or are subject to momentum effects. It can be especially valuable in markets driven by retail sentiment, such as certain cryptocurrencies or popular stocks. In these markets, the psychology behind consecutive bullish or bearish candles can often create predictable patterns that this indicator aims to identify and quantify.
For instance, in crypto markets, a series of strong bullish candles might indicate growing enthusiasm among retail investors. The indicator can help assess whether such enthusiasm typically leads to further gains or if it often precedes a reversal. This insight can be crucial for timing entries and exits or for setting appropriate stop-loss and take-profit levels.
This indicator is provided for informational and educational purposes only. It should not be considered as financial advice or a recommendation to buy, sell, or hold any financial instrument. Past performance does not guarantee future results, and all trading carries inherent risks. Users should always conduct their own research, consider their financial situation, and consult with a qualified financial advisor before making any investment decisions. The creator of this indicator is not responsible for any losses incurred from its use. Remember that financial markets can be highly unpredictable, and no indicator can guarantee accurate predictions of future price movements.
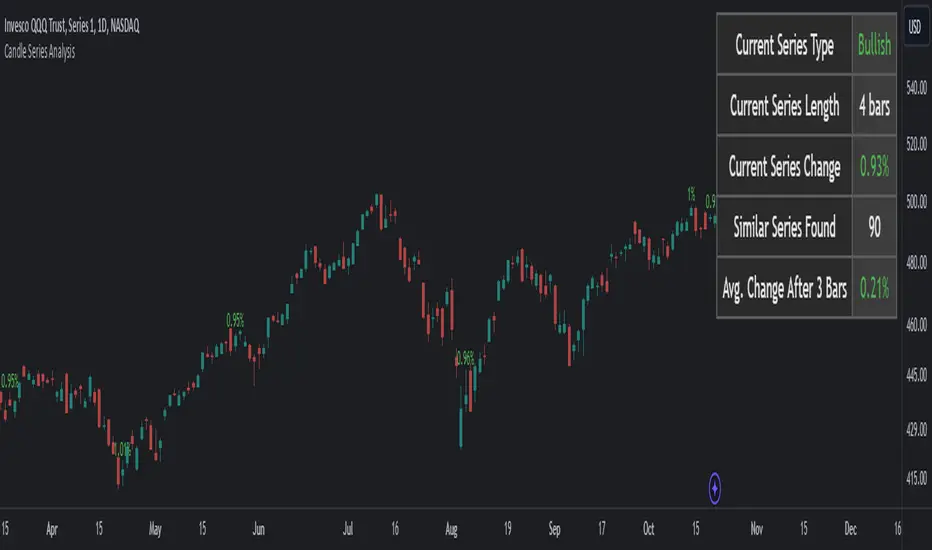
Alternative Shark Harmonic Pattern [TradingFinder] ALT Shark🔵 Introduction
The Alternative Shark harmonic pattern, similar to the original Shark harmonic pattern introduced by Scott Carney, is a powerful tool in technical analysis used to identify potential reversal zones (PRZ) in financial markets.
These harmonic patterns help traders spot key turning points in market trends by relying on specific Fibonacci ratios. The Alternative Shark pattern is particularly unique due to its distinct Fibonacci retracements within the PRZ, which differentiate it from the standard Shark pattern and provide traders with more precise entry and exit signals.
By focusing on harmonic patterns and utilizing tools like the Harmonic Pattern Indicator, traders can easily identify both the Shark and Alternative Shark patterns, making it easier to find PRZs and capture potential trend reversals. This enhanced detection of potential reversal zones allows for better trade optimization and improved risk management.
Incorporating the Alternative Shark pattern into your technical analysis strategy enables you to enhance your trading performance by identifying market reversals with greater accuracy, improving the timing of your trades, and reducing risks associated with sudden market shifts.
🟣 Understanding the Types of Alternative Shark Pattern
The Alternative Shark harmonic pattern, much like the original Shark pattern, forms at the end of price trends and is divided into two types: Bullish and Bearish Alternative Shark patterns.
Bullish Alternative Shark Pattern :
This pattern typically forms at the end of a downtrend, signaling a potential reversal into an uptrend. Traders can use this pattern to identify buy entry points. The image below illustrates the core components of the Bullish Alternative Shark Pattern.
Bearish Alternative Shark Pattern :
Conversely, the Bearish Alternative Shark Pattern appears at the end of an uptrend and signals a potential reversal to a downtrend. This variation allows traders to adjust their strategies for selling. The image below outlines the characteristics of the Bearish Alternative Shark Pattern.
🟣 Differences Between Shark and Alternative Shark Patterns
Although both patterns share similar structures and serve as tools for identifying price reversals, there is one key difference between them :
AB to XA Ratio : In the Shark pattern, the AB leg retraces between 1 and 2 of the XA leg, whereas in the Alternative Shark pattern, this retracement is reduced to 0.382 to 0.618 of the XA leg. This difference in the retracement ratio leads to slightly different trade signals and can affect the timing of entry and exit points.
Other ratios and reversal signals remain consistent between the two patterns, but this difference in the AB to XA ratio provides traders with more nuanced opportunities to optimize their trades.
🔵 How to Use
🟣 Trading with the Bullish Alternative Shark Pattern
The Bullish Alternative Shark Pattern functions similarly to the traditional Bullish Shark, acting as a reversal pattern that helps traders recognize the end of a downtrend and the beginning of an uptrend.
The main distinction lies in the reduced AB retracement, which can offer more refined entry signals. Once the pattern completes, traders can look to enter buy trades and place a stop-loss below the lowest point of the pattern for effective risk management.
🟣 Trading with the Bearish Alternative Shark Pattern
The Bearish Alternative Shark Pattern operates much like the Bearish Shark pattern but with the adjusted AB to XA ratio. This difference provides traders with unique entry points for sell trades. Once the pattern is fully identified, traders can enter short positions, placing a stop-loss above the highest point of the pattern to safeguard against market fluctuations.
🔵 Setting
🟣 Logical Setting
ZigZag Pivot Period : You can adjust the period so that the harmonic patterns are adjusted according to the pivot period you want. This factor is the most important parameter in pattern recognition.
Show Valid Forma t: If this parameter is on "On" mode, only patterns will be displayed that they have exact format and no noise can be seen in them. If "Off" is, the patterns displayed that maybe are noisy and do not exactly correspond to the original pattern.
Show Formation Last Pivot Confirm : if Turned on, you can see this ability of patterns when their last pivot is formed. If this feature is off, it will see the patterns as soon as they are formed. The advantage of this option being clear is less formation of fielded patterns, and it is accompanied by the latest pattern seeing and a sharp reduction in reward to risk.
Period of Formation Last Pivot : Using this parameter you can determine that the last pivot is based on Pivot period.
🟣 Genaral Setting
Show : Enter "On" to display the template and "Off" to not display the template.
Color : Enter the desired color to draw the pattern in this parameter.
LineWidth : You can enter the number 1 or numbers higher than one to adjust the thickness of the drawing lines. This number must be an integer and increases with increasing thickness.
LabelSize : You can adjust the size of the labels by using the "size.auto", "size.tiny", "size.smal", "size.normal", "size.large" or "size.huge" entries.
🟣 Alert Setting
Alert : On / Off
Message Frequency : This string parameter defines the announcement frequency. Choices include: "All" (activates the alert every time the function is called), "Once Per Bar" (activates the alert only on the first call within the bar), and "Once Per Bar Close" (the alert is activated only by a call at the last script execution of the real-time bar upon closing). The default setting is "Once per Bar".
Show Alert Time by Time Zone : The date, hour, and minute you receive in alert messages can be based on any time zone you choose. For example, if you want New York time, you should enter "UTC-4". This input is set to the time zone "UTC" by default.
🔵 Conclusion
The Alternative Shark harmonic pattern, despite its structural similarity to the traditional Shark pattern, introduces a key difference in the AB to XA ratio, making it a valuable addition to the trader’s toolkit. This subtle variation enables traders to pinpoint reversal points with greater accuracy and fine-tune their trading strategies.
As with any technical pattern, it is crucial to use the Alternative Shark pattern in combination with other technical indicators and strong risk management practices. Incorporating this pattern into a broader trading strategy can help traders enhance their ability to detect and capitalize on market reversals more effectively.

Trend Strength After Reversal
This indicator measures trend strength after the reversal.
It can catch early reversal based on engulfing candlestick pattern or just the regular reversal.
Every reversal have to be confirmed by a close above reversal pattern.
Trend strength is measured by counting subsequent closing confirming the reversal
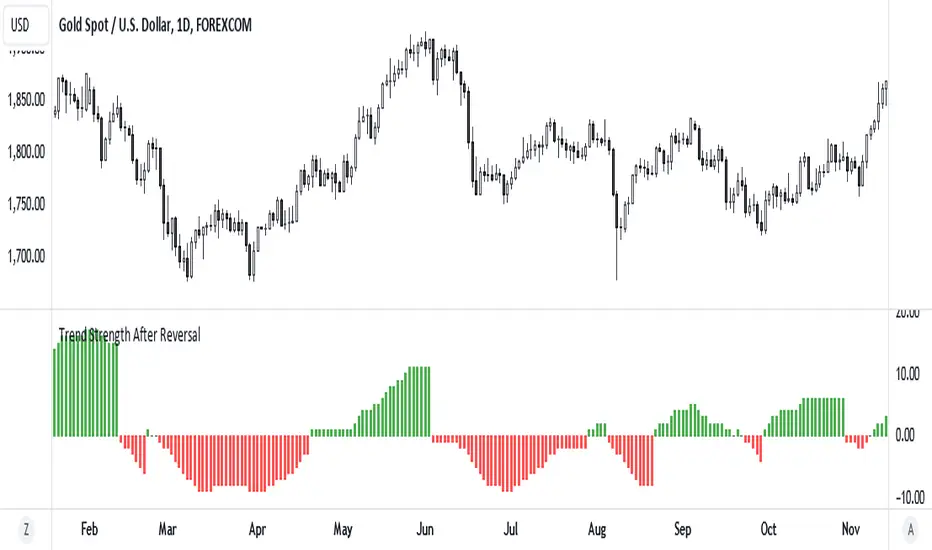
Engulfing Reversal Market PhaseStay at the right side of the market.
This indicator detects bullish and bearish phase in the market based on recent reversal.
It is designed to help filter your trades.
Open only long trades if indicator shows green and open only short trades when indicator shows red.
This indicator will detect bullish and bearish engulfing reversal pattern on the chart.
Bullish engulfing occurs when current candle closes below the bars that created the high.
Bearish engulfing occurs when current candle closes below the bars that created the high.
The reversal pattern occurs not only on a trend change, but can be also be present as a trend continuation pattern or a breakout pattern.
The indicator is able to detect 3 candle patterns and multi candle patterns if detects inside bars in the pattern.
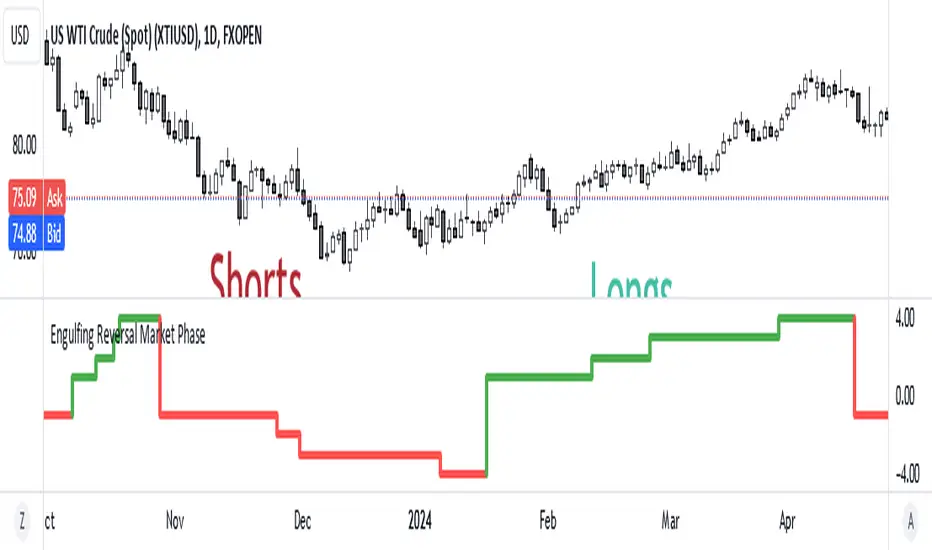
Price Action UltimateThe Price Action Ultimate indicator is an innovative tool designed to provide traders with a comprehensive view of price action based on either volume or touches. By default, the indicator displays touches, offering a unique perspective on price levels that have been frequently interacted with by the market.
At its core, the indicator divides the price range of a specified lookback period into a number of rows (default 25). For each row, it calculates either the volume traded or the number of times the price touched that level. This data is then visualized in two ways: as a histogram and as horizontal lines on the chart.
The histogram, displayed on the right side of the chart, represents the distribution of touches (or volume) across different price levels. Each bar in the histogram shows the number of touches and the percentage of total touches for that price level. The color of the bars ranges from a user-defined low activity color to a high activity color, providing a quick visual reference for the most active price levels.
The horizontal lines drawn across the chart represent the most significant levels based on touches (or volume). By default, the indicator displays the top 3 levels, but this can be adjusted. The thickness of these lines corresponds to the relative importance of each level - thicker lines indicate more touches or higher volume. This feature allows traders to quickly identify key support and resistance levels based on historical price action.
One of the most innovative aspects of this indicator is the option to fade older levels over time. When enabled, this feature gradually increases the transparency of lines as they age, with newer levels appearing more prominently. This helps traders focus on the most recent and relevant price action while still maintaining awareness of older, potentially significant levels.
The indicator offers flexibility in its display options. Users can choose to show levels based on volume, touches, or both. This allows traders to compare and contrast different perspectives on price action. Additionally, the indicator includes options to display a volume profile and a background fill for the analysis range, further enhancing its visual appeal and informational content.
What makes this indicator particularly valuable is its ability to provide a clear, uncluttered view of key price levels without relying on complex calculations or multiple indicators. It distills price action down to its essence - where price has spent the most time or where the most trading activity has occurred. This can be incredibly useful for identifying potential support and resistance levels, areas of consolidation, or possible breakout points.
For traders focused on price action strategies, this indicator offers a powerful tool to enhance their analysis. It provides a data-driven approach to identifying significant price levels, which can be used to inform entry and exit decisions, set stop losses, or anticipate potential market reactions.
This indicator is a tool to aid in market analysis and should not be used as the sole basis for trading decisions. Always combine multiple forms of analysis and practice proper risk management when trading. Past performance does not guarantee future results.

Intraday ReversalReversal Indicator
This Reversal Indicator is designed to capture high-probability reversal trades by analyzing price action at the day’s high or low. It identifies key levels, confirms breaks, and provides clear trade entry parameters based on trader margin, offering a simple yet effective approach for managing risk and potential profit. Best timeframe for trading is 1m.
Key Features:
1. Marks the Day's High and Low Candle:
- Automatically identifies and marks the high and low of the current trading day, acting as potential reversal zones.
2. Entry Trigger:
- A trade signal is generated when the price breaks below the high/low candle.
3. Trade Entry Parameters Display:
- Before the trade entry, the indicator presents a trade entry label on the chart, displaying essential information such as Stop Loss, Take Profit, and Shares Quantity, calculated according to the trader's available margin.
4. Stop Loss:
- The Stop Loss is automatically set a specified number of ticks above the day's high (for shorts) or below the day's low (for longs), ensuring tight risk management.
5. Take Profit:
- The Take Profit level is calculated as a percentage of the Stop Loss distance, providing proportional reward-to-risk ratios based on customizable preferences.
6. Visual Take Profit Line:
- Once a trade is entered, the indicator draws a visible Take Profit line on the chart. This line is initially red, signaling an active trade. If the market hits the Take Profit target, the line turns green, indicating a successful exit.
7. Setup Reset:
- The indicator resets itself with new high / low of the day
This Reversal Indicator simplifies trade execution by automating key decisions, allowing traders to focus on managing the trade rather than constantly monitoring price action. Perfect for traders looking to capitalize on daily reversal patterns with clear risk/reward parameters.
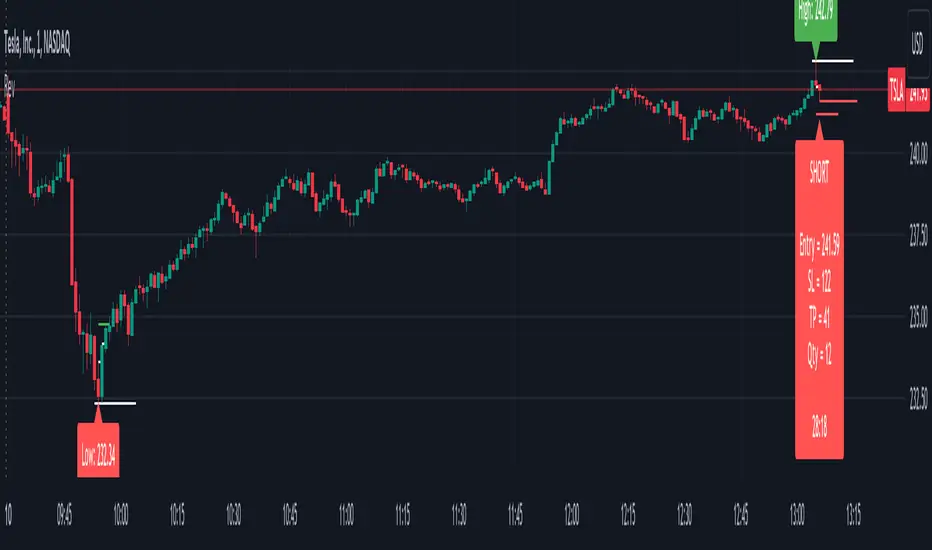
Three Bar Reversal Pattern [LuxAlgo]The Three Bar Reversal Pattern indicator identifies and highlights three bar reversal patterns on the user price chart.
The script also provides an option for incorporating various trend indicators used to filter out detected signals, allowing them to enhance their accuracy and help obtain a more comprehensive analysis.
🔶 USAGE
The script automates the detection of three-bar reversal patterns and provides a clear, visually identifiable signal for potential trend reversals.
When a reversal chart pattern is confirmed and price action aligns with the pattern, the pattern's boundaries are extended, forming levels, with the upper boundary often acting as a resistance and the lower boundary as a support.
The script allows users to filter patterns based on a specific trend direction detected by multiple trend indicators. Users can choose to view patterns that are either aligned with the detected trend or opposite to it.
Included trend indicators are: Moving Average Cloud, Supertrend, and Donchian Channels.
🔶 DETAILS
The three-bar reversal pattern is a technical analysis pattern that signals a potential reversal in the prevailing trend. The pattern consists of three consecutive bar formations:
First Bar and Second Bar: 2 consecutive of the same sentiment, representing the prevailing trend in the market.
Third Bar: Confirms the reversal by closing beyond the high or low of the first bar, signaling a potential change in market sentiment.
Various types of three-bar reversal patterns are documented. The script supports two main types:
Normal Pattern: Detects three-bar reversal patterns without requiring the third bar closing price to surpass the high (bullish pattern) or low (bearish pattern) of the first bar. It identifies basic formations signaling potential trend reversals.
Enhanced Pattern: Specifically identifies three-bar reversal patterns where the third bar closing price surpasses the high (bullish pattern) or low (bearish pattern) of the first bar. This type provides a more selective signal for stronger trend reversals.
🔶 SETTINGS
Pattern Type: Users can choose the type of 3-bar reversal patterns to detect: Normal, Enhanced, or All. "Normal" detects patterns that do not necessarily surpass the high/low of the first bar. "Enhanced" detects patterns where the third bar surpasses the high/low of the first bar. "All" detects both Normal and Enhanced patterns.
Derived Support and Resistance: Toggles the visibility of the support and resistance levels/zones.
🔹 Trend Filtering
Filtering: Allows users to filter patterns based on the trend indicators: Moving Average Cloud, Supertrend, and Donchian Channels. The "Aligned" option only detects patterns that align with the trend and conversely, the "Opposite" option detects patterns that go against the trend.
🔹 Trend Indicator Settings
Moving Average Cloud: Allows traders to choose the type of moving averages (SMA, EMA, HMA, etc.) and set the lengths for fast and slow-moving averages.
Supertrend: Options to set the ATR length and factor for Supertrend.
Donchian Channels: Option to set the length for the channel calculation.
🔶 RELATED SCRIPTS
Reversal-Candlestick-Structure .
Reversal-Signals .

Volumetric Volatility Breaker Blocks [UAlgo]The "Volumetric Volatility Breaker Blocks " indicator is designed for traders who want a comprehensive understanding of market volatility combined with volume analysis. This indicator provides a clear visualization of significant volatility areas (or blocks), characterized by price movements that exceed a specific volatility threshold, as calculated using the ATR (Average True Range). The concept is enhanced by integrating volume-based insights, offering a view of market activity that helps users to recognize when significant price changes are being supported by an appropriate level of market participation.
The indicator calculates breaker blocks for both bullish and bearish market conditions, providing distinct visual elements that identify periods of high volatility and substantial volume divergence. The focus on both volume and volatility makes this tool versatile, allowing traders to assess the strength of price movements as well as areas where price might break above or below previously established levels.
It supports adjustable parameters, such as volatility length, smoothness factor, and volume display, allowing traders to fine-tune the indicator according to their trading strategy and market environment. The highlighted breaker blocks assist in identifying zones of potential price reversal or continuation, which can be critical for making informed trading decisions.
🔶 Key Features
Volatility-Based Block Identification: The indicator uses the Average True Range (ATR) to determine the volatility of the market. When the ATR exceeds a specified threshold (smooth ATR multiplied by a user-defined multiplier), it highlights these areas as volatility blocks. The idea is to mark periods where price activity is significantly divergent from normal conditions, which often signals market opportunities.
Volume Integrated Analysis: In addition to tracking volatility, the indicator incorporates volume data, allowing traders to see the amount of activity that occurs during these high-volatility periods. This helps in identifying whether a price movement is likely sustainable or whether it lacks market support.
User Adjustable Parameters: The indicator offers customization options for the volatility length (using ATR), smooth length, and multiplier for sensitivity adjustment. These settings enable users to modify the indicator’s responsiveness to market conditions.
The option to display the last few volatility blocks allows traders to manage clutter on their charts and focus only on the most recent significant data.
Mitigation Method: Users can select between different mitigation methods ("Close" or "Wick") to determine how blocks are broken. This adds an extra layer of adaptability, allowing traders to modify the indicator's response based on different price action strategies.
Dynamic Visual Representation: The indicator dynamically draws boxes for volatility blocks and shades them according to market direction, with split areas showing the bullish and bearish strength contributions. It also provides percentage volume for each block, helping traders understand the relative market participation during these moves.
🔶 Interpreting the Indicator
Identifying High Volatility Areas: When a new volatility block appears, it signifies that the market is experiencing higher-than-usual volatility, driven by increased ATR values. Traders should pay attention to these blocks, as they often indicate that a significant price move is occurring. Bullish blocks suggest upward pressure, whereas bearish blocks indicate downward pressure.
Volume Insights: The volume associated with each volatility block provides an insight into how much market participation accompanies these moves. Higher volume within a block implies that the market is actively supporting the price change, which may be a sign of continuation. Low volume suggests that the movement may lack the strength to persist.
Bullish vs. Bearish Strength Analysis: Each block is split into bullish and bearish strength, giving a clearer picture of what’s happening within the volatility period. If the bullish portion dominates, it indicates strong upward sentiment during that period. Conversely, if the bearish side is more prominent, there is more selling pressure. This breakdown helps in understanding intra-block market dynamics.
Volume Percentage Display: The indicator also displays the volume percentage in each block, which provides context for the strength of the move relative to recent market activity. Higher percentages mean more market engagement, which could confirm the legitimacy of a trend or a significant breakout.
🔶 Disclaimer
Use with Caution: This indicator is provided for educational and informational purposes only and should not be considered as financial advice. Users should exercise caution and perform their own analysis before making trading decisions based on the indicator's signals.
Not Financial Advice: The information provided by this indicator does not constitute financial advice, and the creator (UAlgo) shall not be held responsible for any trading losses incurred as a result of using this indicator.
Backtesting Recommended: Traders are encouraged to backtest the indicator thoroughly on historical data before using it in live trading to assess its performance and suitability for their trading strategies.
Risk Management: Trading involves inherent risks, and users should implement proper risk management strategies, including but not limited to stop-loss orders and position sizing, to mitigate potential losses.
No Guarantees: The accuracy and reliability of the indicator's signals cannot be guaranteed, as they are based on historical price data and past performance may not be indicative of future results.
