Dependent Variable Odd Generator For Machine Learning TechniquesCAUTION : Not suitable for strategy, open to development.
If can we separate the stagnant market from other markets, can we be so much more accurate?
This project was written to research it. It is just the tiny part of the begining.
And this is a very necessary but very small side function in the main function. Lets start :
Hi users, I had this idea in my mind for a long time but I had a hard time finding the parameters that would make the market stagnant. This idea is my first original command system. Although it is very difficult to make sense of the stagnant market, I think that this command system can achieve realistic proportions. With 's money flow index, I opened the track to determine the level. On the other hand, the prices were also using a money flow index, and it forced me to make the limitations between the levels in a logical way. But the good thing is that since the bollinger bandwidth uses a larger period, we are able to print normal values at extreme buy and sell values.
In terms of price, we can define excessive purchase and sale values as the period is smaller. I have repeatedly looked at the limit values that determine the bull, bear, and bollinger bandwidth (mfi), and I think this is the right one. Then I have included these values in the probability set.
The bull and bear market did not form the intersection of the cluster, and because there are connected events, the stagnant market, which is the intersection, will be added to the other markets with the same venn diagram logic and the sum of the probability set will be 1. is equal to. I hope that we can renew the number generators in the very important parameters of machine learning such as Markov Process with generators dependent on dependent variables, which bring us closer to reality. This function is open to development and can be made of various ideas on machine learning. Best wishes.
This code is open source under the MIT license. If you have any improvements or corrections to suggest, please send me a pull request via the github repository github.com
Probability

Bar RatioBar Ratio is an indicator tool that provides real-time likelihood of the current bar closing up or down (green or red).
Technical status, volatility and time are key elements in this indicator.
From the open of a bar, a ratio of 50% is assumed before changes from factors are considered.
The factors that change the likelihood of a bar closing up or down and their relative weight are listed below.
Micro-Trend observed over the last 20 bars - up to 2.5%
Macro-Trend observed over the last 70 bars - up to 2.5%
Current bar price against beginning of Micro-Trend - up to 2.5%
Combination of significant change above average volatility and move against direction of Micro-Trend - up to 2.5%
Combination of significant change above average volatility and move against direction of Macro-Trend - up to 2.5%
Previous bar direction up to 10 consecutive bars - up to 3.75%
Current status of bar (higher or lower) - up to 3.75%
Significance of change against average volatility - up to 5%
Time until bar close - up to 25%
Total: 100%
If all factors are synchronised, the likelihood of the bar closing up or down can be indicated at a probability of 100%.
While the practical ability for this to be used for trading is limited, the tool can be useful for choosing when it is safe to open a trade.
Time is a key element as the likelihood of the bar remaining at current status by the close of the bar is constantly increasing.
The accuracy of this tool is incredible and should be noted as it's primary trait.
You can find and use this indicator on any time-stamp or security such as Cryptocurrency, Forex, Stocks or Indices.
The Bar Ratio can be located by searching in your public indicator library at the top of your chart and adding it to your screen.

Function Markov ProcessEXPERIMENTAL:
this is very experimental and INCOMPLETE, use at your own discretion.
thanks glaz for the help :)

The Path by Atilla Yurtseven: A statistical approach to TradingThe Path uses a statistical method that I have developed to indicate possible Lows and Highs of the current bar for the selected time frame. You can see the range at the opening of the bar. You can narrow or widen the range by changing the "Range %".
What does The Path indicate?
The Path uses a statistical method and calculates the limits of the bar. For example when you enter 75 as "Range %", this means there is 75% probability that High of the bar will be below the top line and 75% probability that Low of the bar will be over the bottom line. You can simply change the range probability between 1-99. The Path looks at the past bars (Look back period) and uses a statistical method to forecast.
The Path does not repaint. Range is there at the opening of the bar and never changes. So when you look at the past data, you can see how it worked well in the past!
The Path works with all time-frames (1min-1month and etc.) and all asset classes (Forex, Stocks, Cryptocurrencies and etc.). It simply works.
Please kindly share your opinions and experiences and feel free to send a comment at the below of this post so i can share more statistical indicators that i have developed based on my method.
Please remember to follow me as well and keep in touch!
FYI: This is an indicator that I have developed for myself. You can use it, apply or not to apply it to your trades. Keep in mind that, you are responsible for all your loses (or wins). Risk is 100% yours. Please use / try "The Path" only if you accept this condition.
Have fun :)
Atilla Yurtseven

P-Signal v2.0Description.
-------------
P-Signal v.2.0 is a modified and improved version of an earlier published P-Signal. This version allows to observe
the signal image for a multi frame - a specific set of periods. In this version it is {T, 2T, 4T, 8T, 16T},
where T equals the “working” time i.e. period for which a chart is observed. For example, if T=5m, one can observe
P-Signal not only for 5m period (ocher curve) but also an average image of P-Signal for 5m, 10m, 20m, 40m, 80m
periods (grey curve) without switching over frames.
Moreover p-Signal v2.0 allows to catch "winning" combinations with help of alerts. When alert is active, you'll receive
a notification if combination exists after working frame was closed. There are two combinations in this version:
“High” and “Straight”. The terminology is borrowed from poker game to more easily present trading ideas.
For example: " EUR.USD Straight SHORT on 4h " and so on.
The “High” alert corresponds to absolute value of Gauss error function of working frame (T) not less the value which
is defined by Alert on “High” parameter. The “Straight” combination is registered if same sign signals (poker “flush”)
are observed simultaneously over set of periods. The rank of “Straight” combination is defined by T and Alert on “Straight”
parameter. This combination is less frequent, but stronger the previous one if parameters are chosen reasonably.
Value of parameters depend on T. The lower T the closer parameters to 1. By default “High” equals to 0.98 and
“Straight” equals to 0.85. Both for T=1m. The other parameters correspond to the first version.
Important ! For correct operation T should not exceed the values of hourly time frames!
Good luck!

PPSignal - Fibonacci ZonesThis is a high probability analysis with Fibonacci Zones.
Zones:
E1 = 1.382
E = 1.00
D1 = 0.618
D = 0.50
Daily Pivot (Balance Point)
B = 0.50
B1 = 0.618
A = 1.00
A1 = 1.382
The Fibonacci ZonesTM are based on the High + Low + Close of TODAY (after the close) and then projecting the Zones for TOMORROW .
You can choose different periods of time to perform the zone calculations according to the timefreame. By default it is set to Weekly (W).

P-Signal v1.0
P-Signal calculates the error function (Gauss-Laplace) for a series of increments in the specific price of time frame.
The absolute value of the signal is equal to the probability of changing the sign of the observed series of increments.
The sign of the observed series coincides with the sign of the signal.
P-Signal v1.0 has two parameters.
- Number of Time Frames defines the length of the series, by default 4.
The larger the value, the smaller the absolute error for the series.
- Smoothing is the anti-aliasing option, it is enabled by default.
As a specific price of time frame, ohlc4 PINE built-in variable is used.

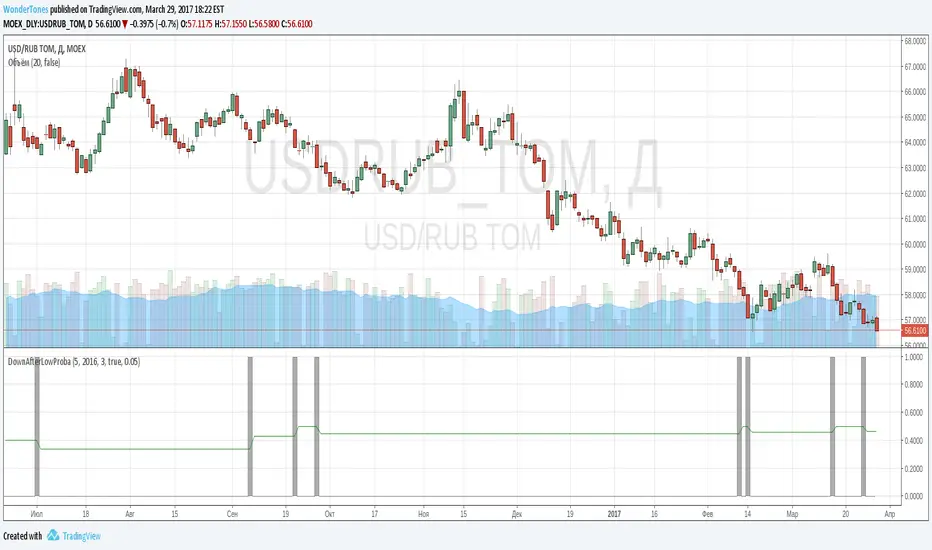
DownAfterLowProba// The script is useful to inspect probability:
// If previous day closed at lowest price for several days
// how often next day would be red bar
// As one can see gray lines indicate bars with lowest close. If next bar is green, increment diff_hi, overwise increment diff_lo
// Probability is counted as diff_lo / (diff_hi+diff_lo)
// One can copy script and change conditions to count other interesting probabilities
UCS-Probability to BounceHey All,
This is an indicator I was developing over the last year. Over some extreme testing and good test results. I am confident to add this to the pool of my indicators.
Yes, this is a protected script. Contains some intensive research.... and every value here is manipulated to fit a general context. Therefore, treat this just like any of my indicator.
If you want to know further about how i use. comment below......

[RS]Study into sequential probabilitys V0EXPERIMENTAL:
just some experimentation to check results, putting it out there. :P
odds of the next bar being up or down bar.

Moving CO-covariance (covariance on covariance)This is Covariance on Covariance. It shows you how much a given covariance period has deviated from it mean over another defined period. Because it is a time series, It can allow you to spot changes in how covariance changes. You can apply trend lines, Fibonacci retracements, etc. This is also volume weighting covariance.
This is not a directional indicator nor is moving covariance. This is used for forecasting volatility. This must be used in conjunction with moving covariance.
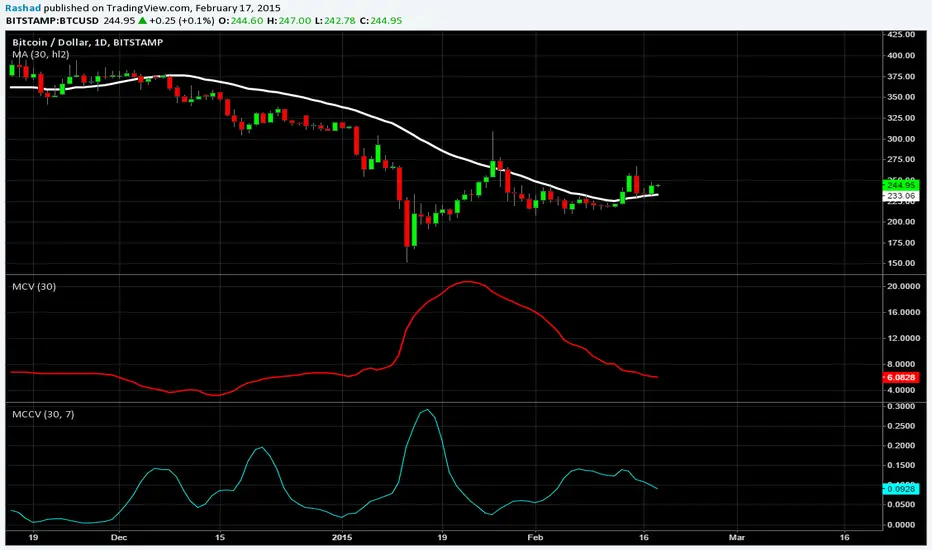
Moving CovarianceCo-variance is a representation of the average percent data points deviate from there mean. A standard calculation of Co-variance uses One standard Deviation. Using the empirical rule, we can assume that about 68.26% of Data points lie in this range.
The advantage to plotting co variance as a time series is that it will show you how volatility of a trailing period changes. Therefore trend lines and other methods of analysis such as Fibonacci retracements could be applied in order to generate volatility targets.
For the purpose of this indicator I have the mean using a vwma derived from vwap. This makes this measurement of co-variance more sensitive to changes in volume, likewise are more representative a change in volatility, thus giving this indicator a "leading aspect".
