Antigravity OCC Strategy (MA 5 + Delayed TSL)# OCC Strategy Optimized (MA 5 + Delayed TSL) - User Guide
## Introduction
The **OCC Strategy Optimized** is an enhanced version of the classic **Open Close Cross (OCC)** strategy. This strategy is designed for high-precision trend following, utilizing the crossover logic of Open and Close moving averages to identify market shifts. This optimized version incorporates advanced risk management, multi-timeframe analysis, and a variety of moving average types to provide a robust trading solution for modern markets.
>
> **Special Thanks:** This strategy is based on the original work of **JustUncleL**, a renowned Pine Script developer. You can find their work and profile on TradingView here: (in.tradingview.com).
---
## Key Features
### 1. Optimized Core Logic
- **MA Period (Default: 5):** The strategy is tuned with a shorter MA length to reduce lag and capture trends earlier.
- **Crossing Logic:** Signals are generated when the Moving Average of the **Close** crosses the Moving Average of the **Open**.
### 2. Multi-Timeframe (MTF) Analysis
- **Alternate Resolution:** Use a higher timeframe (Resolution Multiplier) to filter out noise. By default, it uses $3 \times$ your current chart timeframe to confirm the trend.
- **Non-Repainting:** Includes an optional delay offset to ensure signals are confirmed and do not disappear (repaint) after the bar closes.
### 3. Advanced Risk Management
This script features a hierarchical exit system to protect your capital and lock in profits:
- **Fixed Stop Loss (Initial):** Protects against sudden market reversals immediately after entry.
- **Delayed Trailing Stop Loss (TSL):**
- **Activation Delay:** The TSL only activates after the trade reaches a specific profit threshold (e.g., 1%). This prevents being stopped out too early in the trade's development.
- **Ratchet Trail:** Once activated, the stop loss "ratchets" up/down, never moving backward, ensuring you lock in profits as the trend continues.
- **Take Profit (TP):** A fixed percentage target to exit the trade at a pre-defined profit level.
### 4. Versatility
- **12 MA Types:** Choose from SMA, EMA, DEMA, TEMA, WMA, VWMA, SMMA, HullMA, LSMA, ALMA, SSMA, and TMA.
- **Trade Direction:** Toggle between Long-only, Short-only, or Both.
- **Visuals:** Optional bar coloring to visualize the trend directly on the candlesticks.
---
## User Input Guide
### Core Settings
- **Use Alternate Resolution?:** Enable this to use the MTF logic.
- **Multiplier for Alternate Resolution:** How many charts higher the "filter" timeframe should be.
- **MA Type:** Select your preferred moving average smoothing method.
- **MA Period:** The length of the Open/Close averages.
- **Delay Open/Close MA:** Use `1` or higher to force non-repainting behavior.
### Risk Management Settings
- **Use Trailing Stop Loss?:** Enables the TSL system.
- **Trailing Stop %:** The distance the stop follows behind the price.
- **TSL Activation % (Delay):** The profit % required before the TSL starts moving.
- **Initial Fixed Stop Loss %:** Your hard stop if the trade immediately goes against you.
- **Take Profit %:** Your ultimate profit target for the trade.
---
## How to Trade with This Strategy
1. **Identify the Trend:** Look for the Moving Average lines (Close vs Open) to cross.
2. **Wait for Confirmation:** If using MTF, ensure the higher timeframe also shows a trend change.
3. **Manage the Trade:** Let the TSL work. Once the trade hits the activation threshold, the TSL will take over, protecting your runner.
4. **Position Sizing:** Adjust the `Properties` tab in the script settings to match your desired capital allocation (Default is 10% of equity).
---
## Credits
Original Strategy by: **JustUncleL**
Optimized and Enhanced by: **Antigravity AI**
지표 및 전략

Heikin Ashi Color Flip StrategyManual HA calculation → no repainting
✔ Entry on first green after red
✔ Exit on first red after green
✔ process_orders_on_close = false → orders execute on next bar open
✔ Logic is clean and readable
How to make it your kind of strategy (next step)
Given your past preferences, the best upgrade is:
• Trade only when price > EMA 21
• Or only when SPY > EMA 50 & VIX < 20
• Exit on price close below EMA 21 (your preferred rule)
Consider the following to increase win rate and decrease drawdown:
• Add EMA-21 exit instead of HA red
• Add SPY/VIX regime filter
• Give you real QQQ daily backtest metrics
• Convert this into a scan/alert-only indicator
Disclaimer:
This indicator is provided for educational and informational purposes only and does not constitute financial, investment, or trading advice. The signals generated by this indicator are not guaranteed to be accurate or profitable. Past performance is not indicative of future results. Trading and investing involve substantial risk, and you should perform your own analysis and consult a qualified financial professional before making any trading decisions. The author is not responsible for any financial losses incurred from the use of this indicator.

Trend Pulse Channel StrategyOverview
Trend Pulse Channel Strategy is a long-only trend-following breakout strategy built around an adaptive multi-pole smoothing filter and a volatility-adjusted price channel.
The strategy is designed to participate in sustained directional moves by entering only when price confirms momentum strength beyond a dynamic upper boundary, while avoiding mean-reversion and low-quality consolidation phases.
This script is published as a strategy and includes realistic backtesting assumptions for position sizing, commissions, and slippage.
Core Concept
At the heart of the strategy is a multi-pole adaptive EMA-based filter, inspired by advanced digital signal smoothing techniques.
Using multiple poles allows the filter to reduce noise while preserving responsiveness to genuine trend changes.
To adapt the channel width to changing market conditions, the strategy applies the same filtering logic to True Range, producing a volatility-aware envelope rather than a static or fixed-percentage band.
This combination allows the strategy to:
Track directional bias using a smoothed central filter
Adjust channel width dynamically based on market volatility
Trigger entries only when price expansion confirms trend strength
Entry Logic
A long position is opened when:
Price crosses above the upper channel band
The signal occurs within the user-defined date range
This condition represents a volatility-confirmed breakout aligned with the prevailing directional filter.
Exit Logic
The long position is closed when:
Price crosses back below the upper band
This exit logic aims to stay in trending moves while exiting when upside momentum weakens.
The strategy does not open short positions by design.
Inputs and Defaults
The default inputs are selected to balance smoothness, responsiveness, and stability:
Source (HLC3): Reduces single-price noise by averaging high, low, and close
Period (144): Defines the primary smoothing horizon of the adaptive filter
Poles (4): Controls the smoothness vs. responsiveness trade-off
Range Multiplier (1.414): Scales the volatility envelope using filtered True Range
Reduced Lag (optional): Applies lag compensation to improve responsiveness
Fast Response (optional): Blends multi-pole and single-pole filters for quicker reaction at the cost of smoothness
All inputs are fully configurable and can be adjusted to suit different instruments and timeframes.
Risk Management & Position Sizing
The strategy uses:
Position size: 10% of equity per trade
No pyramiding
Long positions only
This sizing approach is intended to reflect sustainable risk exposure rather than aggressive capital deployment. Users may further adjust position size based on their own risk tolerance.
Backtesting Assumptions
The strategy is tested using :
Initial capital: 10,000
Commission: 0.1%
Slippage: 1 tick
Order fill model: Standard OHLC
These settings are chosen to provide more realistic performance estimates compared to idealized backtests.
This strategy is best suited for :
Trend-oriented markets
Higher timeframes where breakouts are more reliable
Users seeking systematic trend participation rather than frequent scalping
In sideways or range-bound market conditions, price may cross the channel boundaries frequently.
This can result in a higher number of entry and exit signals that do not develop into sustained trends.
For this reason, the strategy should be used with an understanding of basic technical analysis concepts, including market structure, trend identification, and consolidation behavior.
It is intended as a decision-support tool, not a standalone trading system.
Users—whether beginners or experienced traders—should avoid relying solely on this strategy and are encouraged to combine it with broader market context and additional analysis methods.
Disclaimer
This script is provided for educational and analytical purposes only. It does not constitute financial advice. Past performance does not guarantee future results.


NQ Lunch High Low First Sweep StrategyThis script identifies the FIRST liquidity sweep of the Lunch session high or low
after the Lunch session has ended, based on ICT / Killzone concepts.
Logic summary:
• Tracks Lunch session High and Low (New York time)
• After Lunch session closes, monitors the market on 5-minute timeframe
• Triggers ONLY on the first sweep:
– Price wicks beyond Lunch High and closes back below → SHORT signal
– Price wicks beyond Lunch Low and closes back above → LONG signal
• Generates an alert at the exact bar where entry is expected
• Designed specifically for Nasdaq (NQ) futures
• One trade per day – no overtrading
Notes:
• Intended for 5-minute charts only
• Uses New York session timing
• This script does NOT manage exits (TP/SL) – entry logic only
• Best used as a confluence tool, not a standalone system
Educational & discretionary use only.


9 EMA Trend-Flow StrategyThis strategy avoids trading inside the noise and waits for Bitcoin to "coil up" before exploding.
1. Chart Setup
Timeframe: 5 Minutes
Bollinger Bands: Length 20, Standard Deviation 2 (Default).
RSI (Relative Strength Index): Length 14.
EMA (Exponential Moving Average): Length 200 (Trend Filter).
2. The Rules
Long Setup (Buy)
The Trend Filter: Price must be above the 200 EMA.
The Squeeze: The Bollinger Bands must visually contract (narrow), indicating volatility is dying down.
The Trigger: A 5m candle closes strongly above the Upper Bollinger Band.
Confirmation: RSI must be rising and above 50 (but ideally not yet "pegged" at 90+).
Short Setup (Sell)
The Trend Filter: Price must be below the 200 EMA.
The Squeeze: The Bollinger Bands contract.
The Trigger: A 5m candle closes strongly below the Lower Bollinger Band.
Confirmation: RSI must be falling and below 50.
Execution Guide
Entry Technique
Don't enter immediately when the candle touches the band. Wait for the candle close.
Why? Bitcoin frequently "wicks" through bands to trap traders (fakeouts) before reversing. A solid close outside the band confirms momentum.
Exit Strategy (Take Profit)
Target 1 (Conservative): Close 50% of the position when price expands to a fixed risk-reward ratio (e.g., 1.5R).
Target 2 (Runner): Keep the remaining position open as long as price "walks the band" (stays outside or touching the outer band). Close the rest when a candle finally closes back inside the Bollinger Bands.
Stop Loss
Placement: Place your Stop Loss (SL) slightly below the Middle Band (the 20 SMA) at the time of entry.
Trailing: As the price moves in your favor, move your SL to trail the Middle Band.

Ichimoku Cloud Strategy - 1H HyperliquidStategy for Hyperliquid 1hr time frame using Ichimoku's Cloud.


Supertrend + EMA + RSI Algo (Low Risk High Accuracy)This is a trend-following + momentum confirmation strategy designed to reduce false signals and control loss.
Supertrend (10,3) → Identifies overall market direction (Buy in uptrend, Sell in downtrend)
EMA 50 & EMA 200 → Confirms strong trend and avoids sideways market
Buy only when EMA 50 is above EMA 200
Sell only when EMA 50 is below EMA 200
RSI (14) → Confirms momentum
Buy when RSI > 55 (strong bullish momentum)
Sell when RSI < 45 (strong bearish momentum)
---
🔹 Entry Logic
BUY: Market is in uptrend + strong momentum
SELL: Market is in downtrend + strong bearish pressure
---
🔹 Risk Management (Most Important)
Stop Loss: Based on ATR (adapts to volatility)
Target: Fixed Risk-Reward ratio (example: 1 : 2.5)
This keeps loss small and profits larger
---
🔹 Best Use Case
Works best in trending markets
Ideal timeframes: 15m, 1h, 4h
Suitable for crypto futures & swing trading
Beginner-friendly if used with low leverage


FVG Strategy with validationThe code needs to be fixed because it renders the boxes incorrectly, otherwise you can see that the code is profitable in some markets

SMH_DualMomentum (ROC + Volume Trend)SMH Dual Momentum (ROC + Volume Confirmation)
This indicator identifies high-quality bullish trends by combining price momentum (Rate of Change) with volume confirmation, and exits when momentum structurally fails.
Core Logic
BUY signal
Rate of Change (ROC) over N periods is above a positive threshold (strong upside momentum)
Current volume is above its moving average (rising market participation)
SELL signal
ROC crosses below zero, indicating loss of bullish momentum
Why It Works
ROC measures the speed and strength of price movement, filtering out weak or drifting trends
Volume confirmation ensures momentum is supported by real capital flow, reducing false breakouts
Momentum-based exit avoids prolonged drawdowns and capital stagnation
Key Advantages
Focuses on trend continuation, not prediction
Filters out low-quality price moves and range-bound markets
Captures long, high-conviction trends with relatively few trades
Simple, robust rules using only price and volume
Best Use Cases
Designed for trend-driven ETFs such as SMH (Semiconductors)
Suitable for swing to position trading on daily charts
Works best in markets with strong sector rotation and institutional participation
Notes
This is a trend-following momentum tool, not a mean-reversion indicator
No stop-loss is built in; risk management should be handled externally if required
Parameters can be adjusted to match different timeframes or assets


10>20,p>50 DEMARenders daily EMA, 10, 20 and 50 on any timeframe below 1D
30m timeframe works well.
Use trend of 10 > 20 + price > 50 for long and 10 < 20 + price < 50 for shorts or exits.


sullaojo 3mHere is the English translation for the alert setup instructions:
**How to Set Up Alerts (After Adding the Code)**
1. Click the **Add to chart** button to apply the indicator to your graph.
2. Click the **Alarm Clock icon (Alerts)** on the top right toolbar of TradingView, or press `Alt + A`.
3. In the **Condition** field:
* Select the indicator named **"MA Crossover Buy Alert..."**
* Select **"แจ้งเตือนซื้อ (Buy Alert)"** to receive only buy signals.
4. In the **Trigger** (or Options) section: Select **Once per bar close**.
*(This is recommended per the textbook to confirm that the closing price actually crossed the line, avoiding false signals during intraday volatility.)*
5. Check **Notify on App** (for mobile) or **Show pop-up** as desired, then click **Create**.
Now, when the moving averages cross according to the textbook's conditions, the system will send you an alert immediately!

HSI Long & Short: BG + EMA330Strategy: HSI 5-min mean-reversion with EMA10/20 crossover and EMA330 filter.
Background green (EMA10 > EMA20) or red (EMA10 < EMA20).
Long entry: Background turns green AND price below EMA330.
Short entry: Background turns red AND price above EMA330.
Exit long: Background turns red.
Exit short: Background turns green.
No new entries 15:01–16:00 HKT.
Reverses position on signals; 100% equity per trade.

EURUSD | Yield Curve Flip Strategy (2s10s State Flips)Strategy Core (Concept)
The strategy trades EURUSD exclusively when the US yield curve regime (2Y/10Y) flips into a new, clearly bullish or bearish regime. The core assumption is that re-pricing in the US yield curve (rather than individual data points) is a robust driver of USD strength or weakness and can act as a structural trigger for trend changes.
⸻
Data Basis
• Uses US 2Y Yield (TVC:US02Y) and US 10Y Yield (TVC:US10Y).
• The 2s10s curve is calculated as:
curveUS = US10Y – US2Y
• Regime assessment is based on the N-day change (default: 5 days), calculated on true rates bars (not intraday noise).
⸻
Regime Detection (Correct Bond Logic)
First, the strategy checks whether the curve has significantly steepened or flattened over the lookback period:
• Steepener if Δ(2s10s) > thrCurve (default: +0.10 percentage points = 10 bp)
• Flattener if Δ(2s10s) < −thrCurve
Next, a leg confirmation determines the specific type of steepener/flattener (default thrLeg = 5 bp):
Bull Steepener
• Curve steepens because yields fall, with the 2Y falling more (risk-off / rate-cut pricing)
Bear Steepener
• Curve steepens because yields rise, with the 10Y rising more (reflation / term-premium move)
Bull Flattener
• Curve flattens because yields fall, with the 10Y falling more (growth shock / long-end rally)
Bear Flattener
• Curve flattens because yields rise, with the 2Y rising more (hawkish repricing / front-end up)
Important: By default, a Bear Steepener is not treated as a bearish signal, unless allowBearSteepForShort is enabled.
⸻
State Machine (Memory + Flip Triggers)
The strategy maintains a persistent state variable curveState:
• +1 = bullish
• −1 = bearish
• 0 = neutral
The state is updated only on a new rates bar (daily rates when tfRates = "D"), avoiding intraday noise.
A trade is generated only on a true regime flip:
• flipToBull: new state turns bullish and the previous state was bearish (or neutral, if allowed)
• flipToBear: new state turns bearish and the previous state was bullish (or neutral, if allowed)
The option enterFromNeutral controls whether the first clear regime emerging from neutral is traded.
The option onlyOnNewRatesBar ensures signals occur only when a new rates bar is printed, providing clean timing.
⸻
Trading Rules (Entry / Exit)
There are no stops, targets, or trailing mechanisms. The strategy is a pure regime-switching / reversal system:
• On flipToBull
• Close short (“S”)
• Open long (“L”)
• On flipToBear
• Close long (“L”)
• Open short (“S”)
Positions are therefore held until the next regime flip.
⸻
Parameter Interpretation
• N: Smoothing / inertia. Smaller = faster but noisier; larger = more stable but later.
• thrCurve: Minimum curve move required to define a regime.
• thrLeg: Minimum move of the confirming leg (2Y or 10Y) to reduce misclassification.
• allowBearSteepForShort: Makes the system more aggressive (more bearish signals), but represents a different macro case.
• enterFromNeutral: Increases trade frequency by trading the first regime impulse.
⸻
What You See on the Chart
• Background shading:
• Green for bullish state
• Red for bearish state
• The curve and Δ-curve are plotted but hidden (display=none), mainly for debugging and analysis.

Gold Smart Scalper AI V21. The "Red Zone" (News Management)
The strategy logic does not "know" when the Federal Reserve is speaking.
Rule: Disable the strategy or stop taking signals 15 minutes before and after high-impact news (CPI, NFP, FOMC).
Why: During these times, Gold can move $30 in seconds. Slippage will cause your $1.50 Stop Loss to execute much further away, leading to massive drawdown.
2. Session Selection
Gold "Scalping" requires high liquidity and tight spreads.
Discretionary Filter: Only trade during the London/New York overlap (13:00 – 17:00 UTC).
Avoid: The late Asian session or Sunday market open. Spreads often widen to $0.50–$1.00, meaning you are already down 30-50% of your Stop Loss the moment you enter.
3. Market "Mood" (Trend vs. Range)
Trend Context: If the 50 EMA (the White line) is completely flat, the market is in a "Bracket." In this state, EMA crossovers generate many false signals.
The Adjustment: Discretionary traders wait for the 50 EMA to show a clear slope (up or down) before trusting the 9/21 crossover signals.

Hosoda ZHosoda’s Clouds is a trend-following strategy designed to trade only long positions in traditionally trending markets with a strong bullish bias: SPY(D); DJI (D); NDX (D); XAUUSD (D); Tesla (D, H4, H1); AAPL (D, H4, H1); GOOG (D, H4); META (D, H4); NVDA (D, H4); AMZN(D, H4).
Strategy Parameters
Initial Capital: $10,000 USD.
Position Size: Risks 10% of your equity per trade.
Commission: 0.1%
Indicators
The strategy combines two main technical tools:
A. Ichimoku Cloud This is the core of the strategy. It calculates the classic lines:
• Tenkan-sen (Fast Line): Average of the highest high and lowest low of the last 9 periods.
• Kijun-sen (Base Line): Average of the last 26 periods.
• Cloud (Senkou Span A and B): Projects future support/resistance.
B. EMA 500 (Trend Filter)
• A 500-period Exponential Moving Average is calculated.
• Function: Serves as a very long-term trend filter. If the price is above the EMA 500, the market is considered bullish in the long term.
Entry Rules
• Bullish Cross (Bull Cross): The fast line (Tenkan) crosses above the base line (Kijun). This is the classic Ichimoku entry signal.
• Trend Filter (Optional):
•If you check the "Enable EMA Filter" box in the options, the system will only buy if the closing price is above the EMA 500.
•If the box is unchecked, it will ignore the EMA and buy based solely on the Ichimoku cross.
Exit Rules
A. Stop Loss (Loss Protection) It is a dynamic Stop Loss based on market structure, not a fixed percentage.
• At the moment of entry, the code looks back 12 bars (configurable in sl_bars_back) and finds the lowest price (low).
• It places the Stop Loss at that minimum level.
• Visual: Draws a dotted red line on the chart showing where your Stop Loss is.
B. Technical Take Profit (Exit due to Weakness) Lets profits run until the trend shows weakness.
• Condition: Closes the trade if the Tenkan line crosses below the bottom of the Cloud .
• This means short-term momentum has been lost and the price has entered or crossed below the cloud.
Statistics Panel
In the top right corner, the code draws a table (Panel) that updates in real-time or at the end of Backtesting. It shows:
• Total P&L: Net profit or loss in dollars.
• Win Rate: Percentage of winning trades.
• Trades: Total number of trades executed.
Summary
1. The script waits for the blue line (Tenkan) to cross over the red line (Kijun).
2. It verifies if the price is above the orange line (EMA 500) (if the filter is active).
3. If so, it BUYS.
4. It immediately places a Stop Loss at the low of the last 12 candles (red dotted line).
5. It keeps the trade open until the Stop Loss is hit or until the Tenkan line drops below the Cloud.
Customizable Settings
• Whether to use the EMA filter or not.
• The EMA length (default is 500).
• The Ichimoku periods (9, 26, 52 are standard).
• How many bars to look back to set the Stop Loss.

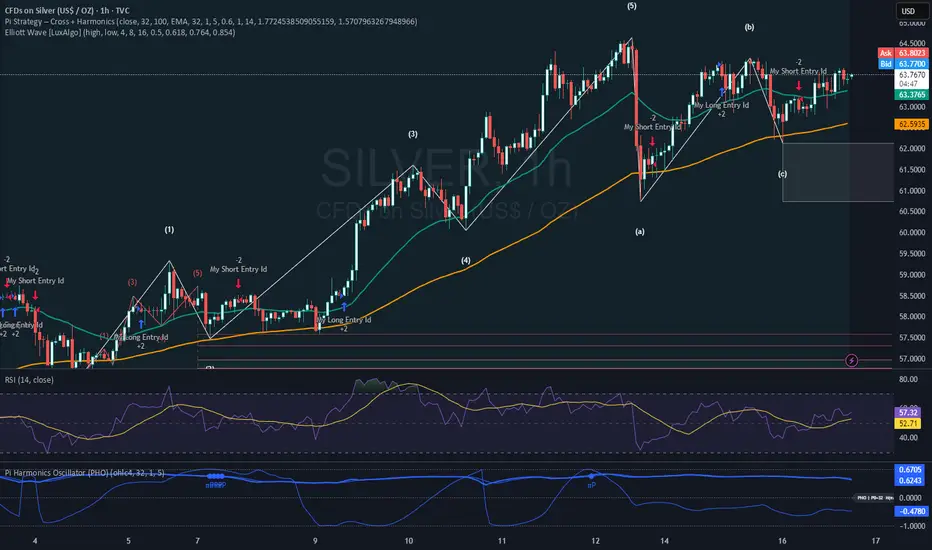
Pi Strategy Cross Harmonicsstill customizing this one, buy and sell seems to off on alternate time settings.
a work in progress, see if this works for anyone.
thanks again.
Scalping Acciones PRO (Entradas + TP + SL) leo
How to use it correctly
• Timeframe: 1m or 5m
• High-volume stocks (SPY, AAPL, TSLA, NVDA…)
• Take Profit (TP): VWAP or EMA 21
• Stop Loss (SL): low/high of the signal candle
⸻
If you want, in the next message I can:
• 🔧 add automatic Stop Loss and Take Profit
• 🚀 convert it into a strategy (Strategy Tester)
• 🎯 filter only strong reversals (fewer false signals)
