Relative Strength Index with overbought/oversold levelsThis indicator is same as standard RSI, but it marks overbought/oversold levels.
Oversold

RSI Support & Resistance by DGTRSI Sᴜᴘᴘᴏʀᴛ & Rᴇꜱɪꜱᴛᴀɴᴄᴇ ʙʏ DGT
This experimental study attempts to translate Relative Strength Index (RSI) threshold levels of oversold/overbought and bull/bear zones as probable Price Support and Resistance levels
█ OPTIONS
Support & Resistance Levels , the main aim of the study. Level calculations are based on Relative Strength Index (RSI) threshold levels of oversold/overbought and bull/bear zones, where all threshold values are customizable through the user dialog box. Background of the levels can be colored optionally
RSI Weighted Colored Bars and/or Mark Overbought/Oversold Bars , Bar colors can be painted to better emphasis RSI values. Darker colors when the oscillator is in oversold/overbought zones, light colors when oscillator readings are below/above the bull/bear zone respectively, and remain unchanged otherwise. Besides the colors, with “Display RSI Overbought/Oversold Price Bars” option little triangle shapes can be plotted on top or bottom of the bars when RSI is in oversold/overbought zones
Example usage of the study with explanations
█ OTHERS
More regarding Support & Resistance concept (definition, identifying levels, trading S&R, etc) you are kindly invited to check my previous publication
Price Action - Support & Resistance by DGT
More regarding Relative Strength Index (RSI) and Relative Strength of Volume Indicators , please check Relative Strength of Volume Indicators by DGT
Disclaimer:
Trading success is all about following your trading strategy and the indicators should fit within your trading strategy, and not to be traded upon solely
The script is for informational and educational purposes only. Use of the script does not constitute professional and/or financial advice. You alone have the sole responsibility of evaluating the script output and risks associated with the use of the script. In exchange for using the script, you agree not to hold dgtrd TradingView user liable for any possible claim for damages arising from any decision you make based on use of the script

Scalping using RSI 2 indicator with TSLThis strategy implements a simply scalping using the RSI (calculated on two periods), the slopes of two MAs ( EMA or SMA ) having different lengths (by default, I use 50 and 200).
A trailing stop loss (%) is used.
Entry conditions:
.) Fast MA > Slow MA and Price > Slow MA and RSI < Oversold Threshold ------> go Long
.) Fast MA < Slow MA and Price < Slow MA and RSI > Overbought Threshold ------> go Short
Exit conditions:
.) Long entry condition is true and (close >= TP or close <= TSL ) ----> close short position
.) Short entry condition is true and (close <= TP or close >= TSL ) ----> close long position
The strategy performed best on Bitcoin and the most liquid and capitalized Altcoins but works excellent on volatile assets, mainly if they often go trending.
Works best on 3h - 4h time frame.
There's also an optional Volatility filter, which opens the position only if the difference between the two slopes is more than a specific value, which can be set in the study inputs. The purpose is not opening positions if the price goes sideways and the noise is way > than the signal.
Note:
.) the RSI length is 2;
.) the oversold Threshold is 90%;
.) the overbought Threshold is 10%;
.) by default, the trailing stop loss per cent is 1%;
.) by default, the fast MA length is 50;
.) by default, the slow MA length is 200;
.) by default, the MA used is EMA.
Cheers.

Scalping using RSI 2 indicator with TP and TSLThis study implements a simply scalping using the RSI (calculated on two periods), the slopes of two MAs (EMA or SMA) having different lengths (by default, I use 50 and 200).
A take profit (%) and a trailing stop loss (%) are used.
Entry conditions:
.) Fast MA > Slow MA and Price > Slow MA and RSI < Oversold Threshold ------> go Long
.) Fast MA < Slow MA and Price < Slow MA and RSI > Overbought Threshold ------> go Short
Exit conditions:
.) Long entry condition is true and (close >= TP or close <= TSL) ----> close short position
.) Short entry condition is true and (close <= TP or close >= TSL) ----> close long position
The strategy performed best on Bitcoin and the most liquid and capitalized Altcoins but works excellent on volatile assets, mainly if they often go trending.
Works best on 3h - 4h time frame.
There's also an optional Volatility filter, which opens the position only if the difference between the two slopes is more than a specific value, which can be set in the study inputs. The purpose is not opening positions if the price goes sideways and the noise is way > than the signal.
Note:
.) the RSI length is 2;
.) the oversold Threshold is 90%;
.) the overbought Threshold is 10%;
.) by default, the take profit per cent is 0.5%;
.) by default, the trailing stop loss per cent is 0.5%;
.) by default, the fast MA length is 50;
.) by default, the slow MA length is 200;
.) by default, the MA used is EMA.
Cheers.

RSS - RSI(OB/OS)This indicator draws a visual RSI signal on to your chart. You can use it to set RSI alerts when the market enters an extreme RSI condition.

Multi Band Channel - Oversold/Overbought OscillatorIf your trading strategy is to sell the RIPs and buy the DIPs, this is an indicator for you.
This is based on the multi band indicator present here:
Code is simplified to generate as many bands as possible and hence divide price into as many states as possible based on these bands. Moving Average Type defines what moving average to be considered for Bollinger Band/Keltner Channel. This is based on
Once we derive price state based on multi bollinger band/keltner channel levels, we then look for highest and lowest levels in LoopbackPeriod .
Overbought level = Highest Level - Offset
Oversold level = Lowest Level + Offset
Blue line indicates current state.

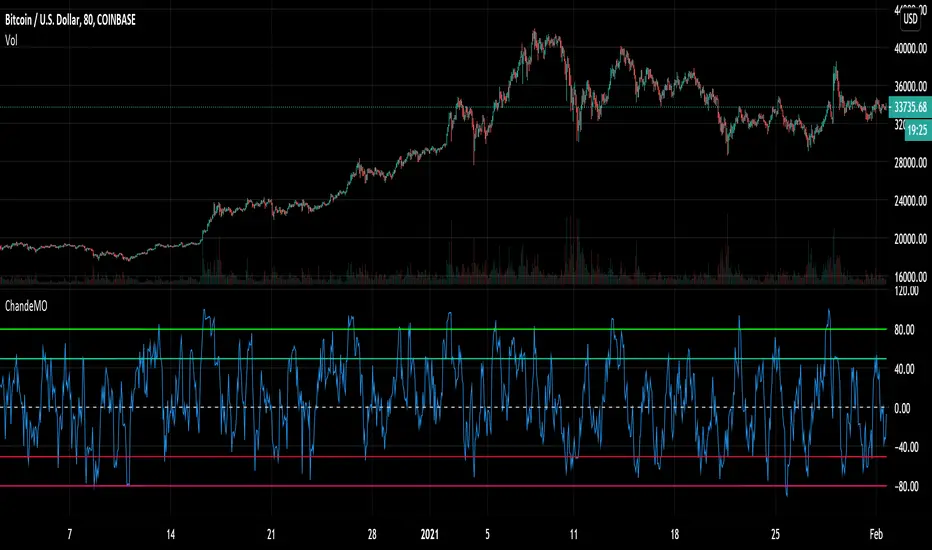
Chande Momentum Oscillator - Alerts and RegionsIt seemed weird to me that the default Chande didn't have overbought and oversold regions, despite them being described for Chande Momentum and working very well. So I added the lines and alert conditions. I've used this to very good results in my day trading.
My strategy involved 4 timeframes of candlestick, each with 4 timeframes of Chande overlaid. Candlesticks are 5 min, 20 min, 80 min, 320 min and Chandes are x1, x2, x4 and x8 of the relevant time zone. Give it a shot. Use the 5 min Chande as Buy and Sell signal with the other timeframes for trend confirmation. You may get a lot of extra alerts with this setup, but it's almost impossible to really miss an opportunity if you use it right. It will take up all your free time though, as a warning. Using this strat made me go crazy.
Use the chande crossing over the lines as the signal, not just being in the region, as that will make you buy early.
Confirmation (Expo)
Confirmation (Expo) is a trading confirmation tool that can confirm any indicator, trend, setup, signal, or strategy. Once you have chosen the input source (any indicator) you can use the tool to confirm the trend, trend strength, overbought/oversold areas, retracements, and reversals. This tool is built for traders that already have a strategy or preferred indicator that they want to confirm. As a default, the indicator oscillates between overbought (or strong positive trend)/oversold (or strong negative trend). However, depending on the settings and input source many different layouts can occur.
Real-Time Alerts
No Repainting
Works on any market and in any timeframe
HOW TO USE
To confirm any indicator, trend, setup, signal, or strategy
INDICATOR IN ACTION
4 hour - chart
I hope you find this indicator useful , and please comment or contact me if you like the script or have any questions/suggestions for future improvements. Thanks!
I will continually work on this indicator, so please share your experience and feedback as it will enable me to make even better improvements. Thanks to everyone that has already contacted me regarding my scripts. Your feedback is valuable for future developments!
-----------------
Disclaimer
Copyright by Zeiierman.
The information contained in my scripts/indicators/strategies/ideas does not constitute financial advice or a solicitation to buy or sell any securities of any type. I will not accept liability for any loss or damage, including without limitation any loss of profit, which may arise directly or indirectly from the use of or reliance on such information.
All investments involve risk, and the past performance of a security, industry, sector, market, financial product, trading strategy, or individual’s trading does not guarantee future results or returns. Investors are fully responsible for any investment decisions they make. Such decisions should be based solely on an evaluation of their financial circumstances, investment objectives, risk tolerance, and liquidity needs.
My scripts/indicators/strategies/ideas are only for educational purposes!
ACCESS THE INDICATOR
• Contact me on TradingView or use the links below

Multi-Timeframe Stoch RSIGood evening folks!
Today I want to share with you a simple variant of the Stochastic-RSI built-in indicator.
Nothing too complex: by enabling the relative checkbox and setting the desired (k, d or the RSI ) source and timeframes, you can see higher timeframes data plotted on your screen.
Everything you need to do is enabling the indicator on the lowest timeframe (in this case 15 minutes), then you will see in YELLOW the information retrieved from the next higher timeframe (in this case 30 minutes) and in RED the information retrieved from the highest timeframe (in this case 45 minutes).
IT'S IMPORTANT THAT YOU DISPLAY THE INDICATOR ON THE LOWEST TIMEFRAME!
You can play with the overbought and oversold heights in order to have the best configuration you want (in oversold conditions is suggested to buy while in overbought conditions is suggested to sell)
The higher timeframes data are retrieved avoiding repainting since the method used for taking them is the 10th method described in this PineCoders Article , so, if you want to enable alerts, you SHOULD ignore the disclaimer message related to it without any problem.
Good Trading!

[JRL] Pivot Regression OscillatorIntroducing the Pivot Regression Oscillator. This oscillator uses a similar formula to the Stochastic Oscillator. However, instead of comparing the closing price to the lowest price of a period, it compares the distance between current price and the current pivot point. By basing our oscillator on pivot levels, we incorporate a much more relevant and consequential price point around which to base our comparisons.
The indicator can give reliable overbought and oversold signals, and it plots two exponential moving averages as output, which provides crossover signals that can be used to help time trades.
The Pivot Regression Oscillator can be effective for timing re-entries into a trend and seems to be able to avoid some of the false signals of other indicators.
Let me know if you find this useful. Cheers!

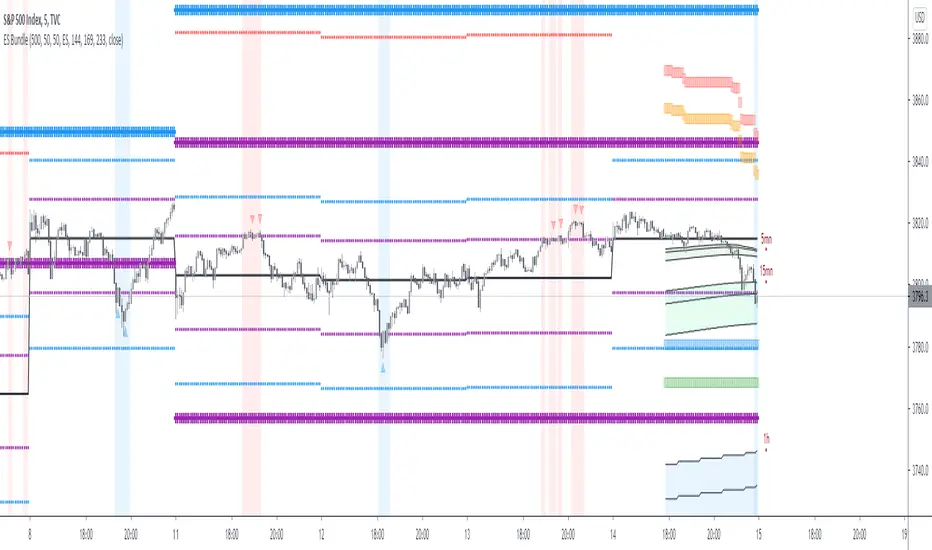
ES BundleThis script is for ES ( E Mini futur or MES) day trading only.
It is a simulation of marker behavior resulting in 2 kind of level:
Oversold and overbougth level:
* It is square shape: orange and red are 1st and 2nd level of Overbougth ( high probability to down of 16 points if you have a bearish divergence of momemtum above these levels)
* It is square shape:blue and green are 1st and 2nd level of Overbougth ( high probability to upof 16 points if you have a bullish divergence of momemtum above these levels)
*In case of crazy market rend (10% of the time, only small reversal is expected but more often than not momemtum will not plot divergence)
Level of support and resistance
*There is 2 size ( cross shaped pattern), the small is for daily timeframe and the large is for weekly timeframe
*Purple line is the fiest and weakest area of resistance or support
*Blue cross is and interesting level, if momemtum plot divergence above blue resistance or below bull support it is time to search for short or long respectivly
*Red line is when crazy market happen, every divergence above or below red line is a major trade reversal
Obviously if you are on support level + under oversold zone it is the best setup to long and vice versa
[blackcat] L1 MACD with Overbought and Oversold DetectionLevel: 1
Background
This MACD is designed with unique oversold and overbought detections, which you may not sell or buy immedidately. You may need to watch the trend movements and decide to buy or sell on current or next goldcross and deadcross respectively.
Function
Add oversold and overbought detections for MACD to locate proper entry point.
Key Signal
diff--> MACD fast line
dea --> MACD slow line
macdhisto --> MACD histogram
overbought --> overbought signal
oversold --> oversold signal
Pros and Cons
It assits you to locate a rough zone for overbought and oversold in classic MACD indicator. Classic MACD indicator does not have this function.
Remarks
Since we cannot look into the future, so it does not inform you on exact entries but alerts of current or next cross may be a good opportunity.
Readme
In real life, I am a prolific inventor. I have successfully applied for more than 60 international and regional patents in the past 12 years. But in the past two years or so, I have tried to transfer my creativity to the development of trading strategies. Tradingview is the ideal platform for me. I am selecting and contributing some of the hundreds of scripts to publish in Tradingview community. Welcome everyone to interact with me to discuss these interesting pine scripts.
The scripts posted are categorized into 5 levels according to my efforts or manhours put into these works.
Level 1 : interesting script snippets or distinctive improvement from classic indicators or strategy. Level 1 scripts can usually appear in more complex indicators as a function module or element.
Level 2 : composite indicator/strategy. By selecting or combining several independent or dependent functions or sub indicators in proper way, the composite script exhibits a resonance phenomenon which can filter out noise or fake trading signal to enhance trading confidence level.
Level 3 : comprehensive indicator/strategy. They are simple trading systems based on my strategies. They are commonly containing several or all of entry signal, close signal, stop loss, take profit, re-entry, risk management, and position sizing techniques. Even some interesting fundamental and mass psychological aspects are incorporated.
Level 4 : script snippets or functions that do not disclose source code. Interesting element that can reveal market laws and work as raw material for indicators and strategies. If you find Level 1~2 scripts are helpful, Level 4 is a private version that took me far more efforts to develop.
Level 5 : indicator/strategy that do not disclose source code. private version of Level 3 script with my accumulated script processing skills or a large number of custom functions. I had a private function library built in past two years. Level 5 scripts use many of them to achieve private trading strategy.

Non-Rescaled RSI█ OVERVIEW
Relative Strength Index is a momentum oscillator developed by J. Wilder. The original version of RSI rescaled the relative strength measurement to range. While the rescaling is useful for readability, This non-rescaled version tells the exact average relative strength of the movement for the past period, and give another way to put the relative strength reading into context of current market condition.
█ Description & How To Use
1. The (+/-) in relative strength value indicates the direction
Example 1: Relative Strength of 2.33 means average gain is 2.33 bigger than average loss for the past period (Equivalent to RSI 70)
Example 2: Relative Strength of -2.33 means average loss is 2.33 bigger than average gain for the past period (Equivalent to RSI 30)
Example 3: Relative Strength of 0 means average gain is equal to average loss for the past period (Equivalent to RSI 50)
Look at comparison below:
2. You can use it exactly how you would use RSI: Overbought/Oversold state, Divergence, Trend identification, Failure Swings etc..
█ Features
- Overbought/Oversold line still maintainable as standard RSI level (70,30) in user input screen. The script will recalculate and plot the ob/os level accordingly
- Value Label to indicate the RSI and RS value
- Custom Gradient Color Scheme
█ Limitation
The Relative Strength absolute value is capped at 20 to avoid ratio value too big(or too small). This is enough to get accurate equivalent of RSI reading between 5-95
█ Disclaimer
Past performance is not an indicator of future results.
My opinions and research are my own and do not constitute financial advice in any way whatsoever.
Nothing published by me constitutes an investment/trading recommendation, nor should any data or Content published by me be relied upon for any investment/trading activities.
I strongly recommends that you perform your own independent research and/or speak with a qualified investment professional before making any financial decisions.

Momentum Strategy for cryptos (V7.B.4)Here's a strategy for low time frames (30min suggested) for BTC, based on momentum Analysis using Stochastic RSI
By default the strategy will use the 50% of the specified capital for each trade; if "Gamble Sizing" is enabled, it will add the specified amount of capital (25% by default, until reaching the 100% limit or lower) for the next trade after having detected a loss in the previous trade; if the next trade is successful, the size for the next trade comes back to 50%
• Trend Filter LONG: If the fast exponential moving average is UNDER the slow exponential moving average, it won't open LONG positions
• Trend Filter SHORT: If the fast exponential moving average is ABOVE the slow exponential moving average, it won't open SHORT positions
• Bars delay: the strategy will wait the specified amount of bars before closing the current position; the counter is triggered as soon as the closing trade condition is verified
BY MAKING USE OF THIS STRATEGY, YOU ACKNOWLEDGE AND AGREE THAT: (1) YOU ARE AWARE OF THE RISKS ASSOCIATED WITH TRANSACTIONS OF DIGITAL CURRENCIES AND THEIR DERIVATIVES; (2) YOU SHALL ASSUME ALL RISKS RELATED TO THE USE OF THIS STRATEGY AND TRANSACTIONS OF DIGITAL CURRENCIES AND THEIR DERIVATIVES; AND (3) I SHALL NOT BE LIABLE FOR ANY SUCH RISKS OR ADVERSE OUTCOMES.

TradeChartist RSI Donchian Channels™TradeChartist RSI Donchian Channels is a helpful RSI based indicator that helps visualize the RSI trend (using 4 plot styles including RSI Candles) by plotting Donchian Channels of user preferred length.
===================================================================================================================
Features of ™TradeChartist RSI Donchian Channels
===========================================
Plots RSI using user preferred plot style (RSI Candles, Line, Histogram and Area).
Plots RSI Donchian Channels of user preferred DC Length (Default - 14, Min - , based on RSI source price (Default - ohlc4), RSI Length (Default - 14) and EMA smoothing of RSI (Default - 5)
Option to highlight Overbought and Oversold zones.
Highlights Bull and Bear RSI Trend of RSI Donchian Channels.
Displays various RSI Zones using Background fill.
Helps visualize Divergences by plotting RSI Highs and Lows.
The indicator's Trend Identifier Connects to ™TradeChartist Plug and Trade or other compatible TV Scripts as Oscillatory Signal to Generate trade entries, Targets etc. This feature is purely for testing purposes and shouldn't be used on its own for trading.
Note: The RSI Donchian Channels trend alone as a standalone indicator cannot be used for trades as non-trending zones and divergence zones will have significant drawdowns on higher time frames. Also, every asset/timeframe shows different but stable dynamic with RSI Donchian Channels in my limited research. Works very well for certain assets on 4hr for Forex pairs. Nevertheless, it is a very good addon to use to confirm RSI Trend especially for RSI based traders.
===================================================================================================================
Example Charts
1. EUR-USD 4hr chart using RSI Source - hl2, RSI Length - 14, Smoothing - 10 and DC Length - 21 connected to Plug and Trade.
2. BTC-USD Daily chart using RSI Source - close, RSI Length - 14, Smoothing - 5 and DC Length - 21 connected to Plug and Trade.
===================================================================================================================
Best Practice: Test with different settings first using Paper Trades before trading with real money
===================================================================================================================

Screener - Mean Reversion Channel█ OVERVIEW
This is Screener script for Mean Reversion Channel Indicator
█ Description & How To Use
The screener works by scanning through up to 40 symbols and list down symbols that are currently within Overbought/Oversold Zone as defined by Mean Reversion Channel indicator.
The Overbought/Oversold Zone are further categorized and sorted by:
Strong : Indicated by "(Strong)" next to the symbol name
Normal : Indicated by the absence of "(Strong)" or "(Weak)" next to the symbol name
Weak : Indicated by "(Weak)" next to the symbol name
Notes: Refer to chart above to see how the Zone are categorized.
Notes: If the screener displays "Nothing Interesting". It simply means none of the screened assets are within the Overbought/Oversold Zone.
█ Features
- Scan up to 40 symbols at a time (By default, no asset is define. Once configured all the symbols you required, remember to save as default to save you from pain of configuring it again in the future)
- Options to scan by zones
- Custom Timeframe
█ Limitation
Due to multiple use of security() function required to call other symbols, expect the screener to be slow at certain times
█ Disclaimer
Past performance is not an indicator of future results.
My opinions and research are my own and do not constitute financial advice in any way whatsoever.
Nothing published by me constitutes an investment recommendation, nor should any data or Content published by me be relied upon for any investment/trading activities.
I strongly recommends that you perform your own independent research and/or speak with a qualified investment professional before making any financial decisions.
Any ideas to further improve this indicator are welcome :)
Credit: QuantNomad for his script idea on custom screener

Everything RSIThis indicator includes:
RSI Candles set to the default 14 length (un check Borders in the Style tab to see the candlesticks better)
I like using the wicks as an early warning for a possible trend change, which is generally in the opposite direction of the wicks.
It's also easier for me to draw trend lines using the RSI Candles vs the rsi plot line.
40 ema of the RSI Candles
2nd RSI set to the 20 length , which plots just inside the wicks of the RSI Candles. This RSI also highlights Oversold and Overbought levels.
I sometimes leave the RSI Candle Borders checked and use the 20 RSI plot with the wicks of the RSI Candles
Signals to look for Short or Long opportunities , which use the 5 sma of the RSI Candles crossing under the overbought and over the
oversold levels. If you'd like to plot the 5 sma, remove the // at the beginning of the code on line 72.
3nd RSI set to the default 14 length which can be set to a different timeframe as the current chart. Default setting is the 1h.
This RSI plots a + at the top of the indicator when it's above the 50 level and an x at the bottom of the indicator when it's below the 50 level.
For me, this is just a visual aid when I'm scalping on lower timeframes.
If the 1h RSI is above the 50 level, I focus on long scalps. If the 1h RSI is below the 50 level, I focus on short scalps.
RSI Cloud which is formed by filling in the area between the 14 ema of both the 7 RSI and 28 RSI.
I used part of @FnM_Capital 's Trend-Sniper script for my RSI Candles. Thank you! You're extremely talented and deserve all of the credit for your work.
I'd also like to thank @SeanNance for answering all of my random coding questions!!!
I've added the indicator to the example twice to show a couple of the ways I view the RSI's.
The top indicator shows the RSI Candle Borders "un checked" and without the 2nd RSI plot.
The bottom indicator shows RSI Candle Borders "checked", using 2nd RSI plot with the RSI Candle Wicks.

Mean Reversion Channel - (fareid's MRI Variant)Description :
Mean Reversion Channel objective, based on Mean Reversion theory ( everything has a tendency to revert back to its mean), is to help visualizing:
Inner Channel -> Dynamic Support and Resistance
Outer Channel -> Overbought/Oversold Zone which may signal consolidation phase or potential reversal due to unsustainable move
Details on some of the filtering type used for mean calculation can be read in Ehlers Technical Papers: "Swiss Army Knife Indicator" and/or his book "Cybernetics Analysis for Stock and Futures"
Disclaimer:
These study scripts was built only to test/visualize an idea to see its viability and if it can be used to optimize existing strategy.
Any ideas to further improve this indicator are welcome :)

Triple RSIThis idea behind this indicator was to show an un cluttered view of the RSI on 3 different timeframes. The RSI for the current chart highlights Lime/Red when it crosses the Overbought and Oversold levels, which are editable in the Inputs tab. RSI 2 defaults to the 1h timeframe and prints a lime dot at the top of the indicator when it's above the 50 level and a Red Dot at the bottom of the indicator when it's below the 50 level. It can also be viewed as a plot line that changes color when it's above or below the 50 level. RSI 3 defaults to the 4h timeframe and prints a blue square at the top of the indicator when it's above the 50 level and an orange square at the bottom of the indicator when it's below the 50 level. It also can be viewed as a plot line that changes color when it's above or below the 50 level.
I've added the indicator multiple times to show a few of the different viewing options, with the default settings at the very bottom.

REDWOOD MTF MacD Stochastic RSIOne of out most premium indicators is this MTF MacD Stochastic RSI combo.
This is calculated with specific conditions to give the best signals for market reversals or continued trends.
=======
For a detailed description of how the REDWOOD MacD works, see profile (links of personal indicators arent posting for some reason)
For a detailed description of how the REDWOOD Stochastic RSI works, see profile
=======
These are both powerful indicators alone, but together they work very well together to confirm positions or see new entries or exits.
Without giving too much away on how it is made, this takes trades when the MacD is weak, with a confirming signal from the Stoch RSI
just the other way, it takes trades when the MacD is strong, and the Stoch RSI confirms trend.
This was made to reduce clutter of watching multiple indicators, while still giving you a chance to see what both indicators are doing and how they are flowing together.
Custom alerts are set so you never miss a trade opportunity! Get alerted on all reversals, strong signals, or even signals from the MacD or Stochastic RSI crosses!
This is a Multi Timeframe indicator so you can see what is happening on a long term time frame while trading short time frame bars, getting a better position in the market.
Best trades are when the alert or indicator is signaling, and the close of the MacD is about to happen on the MTF time frame set. All timeframes for both MacD and Stoch can be customized, and they do come with default settings.
Best MTF Time frames are longer timeframes (1hr, 4hr, D) but it can work well with current timeframe and lower timeframes (15min, 30min)
All settings for the MacD and Stoch are the same as the original, you can remove the MacD or histogram, remove or see crosses, and even color in pivot points in the MacD
~~~
Added feature is this indicator by default shows the MacD to tell you the overall trend, but you can uncheck the Show MacD setting to remove the MacD and check the Show Stoch RSI to have the indicator show you the Stoch RSI all in the same indicator! This is extremely useful to see where the Stoch RSI is at when the MacD is turning or pivoting. If the stoch is turning as well and overbought or oversold, it is a good time to enter or exit a position.
Dark Green is showing buy signals, and dark maroon is showing sell signals.
The coloring in the background (red, lime) is showing the trend we are riding and when the color goes away it is an indication of a possible trend reversal or dip coming. These are mostly used to confirm positions.
~~~
The timeframes I recommend would be the 4hr on both, althought it has proven to work well (if you want more signals) to have either the MacD or Stoch RSI on a higher timeframe and the opposite on a lower timeframe.
All plots and inputs can be customized to your own liking, and there is the option to color the bars with the Stoch RSI being overbought or oversold.
Best Trading Strategy : Enter positions according to the colors being alerted (green = buy, red = sell) when the FIRST is alerted. This is the ideal and best entry.
For safer trading you can wait for a second to confirm and enter there.
Trades can be taken on the shading colors too, trading on trend waves, although this is risky as some waves end abruptly. Best signals are as stated above.
This indicator works very well on its own but can work well along side our other indicators listed here :
Bishop MA's or MA Cloud with Fill
This can be a very useful indicator, and I'm sure some may find settings that work even better
than the default or recommended settings.
This indicator works on all markets, forex, cryptocurrency, and stocks.
For access to this and all indicators available, please DM me here or See profile.
We are here to help each other succeed! The more one succeeds the more we all succeed! We are all in this
together and every person deserves to be financially independent and confident when taking trades
and investing.

REDWOOD MTF Stochastic RSI
This MTF Stochastic RSI is custom made to help give you an edge while trading.
As you see the MTF Stochastic RSI is colored depending on the trend and if "K" is above or below "D".
This indicator shows the crossover or crossunder of these values with the colored circles that
are plotted. This can be a very useful indicator to show you Oversold or Overbought areas of an
asset, giving you ideas of when to take profit or enter a new trade.
For more information on Stochastic RSI in general (for reference) Please see the detailed
description here : www.investopedia.com(StochRSI)%20is,than%20to%20standard%20price%20data.
This Stochastic RSI is a Multi Time frame Stochastic, meaning it can show you higher or lower
timeframes of the Stochastic RSI no matter what current time frame your chart is on. This is
applied in the settings of the indicator by default, with a default timeframe of 1hr.
You can easily change back to the current time frame by checking the box "Use current Timeframe?".
This can be very useful to get into a trend early, entering or exiting on low time frame bars while
seeing the live Long time frame Stoch RSI.
All inputs of K, D, RSIlength, Stochlength, Overbought and Oversold areas can be customized to
your liking. By default these run on the recommended Stoch RSI settings and values on tradingview
with overbought and oversold areas at 80 & 20.
There are inputs that will color the bars depending on if the Stoch is showing Overbought(red) or
Oversold(lime) regions, and a separate color setting that colors bars with the color of the Stoch
itself, showing when K is over D and vise versa.
For trading with this indicator, it works very well with a indicator confirming the position or
potential change that is happening, I recommend the MacD. Specifically, the REDWOOD MTF MacD.
When K crosses D and is showing the Stoch green or lime, this is when to take a Long or buy
position.
When D crosses K and is showing the Stoch red, this is when to take a short or sell position.
To filter out false crosses or trades, this is where I recommend the MacD, taking trades on the
Stoch when the MacD is showing signs of a reversal or crosses itself. These provide the strongest
signals and buy and sell positions.
This is recommended as a swing indicator, but can be used for scalping at your own risk.
As for recommended time frames to use for the MTF settings, I would stick to longer timeframes to
show the overall trend. With that being said, it can be used on shorter timeframes as well and
works good. I would sick to the 1hr or 4hr timeframes, and for lower I recommend the 15min or
30min timeframes. The lower you go the more signals will be provided, but with that lots more
false signals will show as well if the asset is volatile.
All settings, colors, and plots can be customized, and all are labeled to make it easy for you.
Alerts for each setting will be added in the future for simplicity, as of now the alerts can be
made as usual, having the indicator plot K crossing the indicator plot D, telling you of a change
in the Stoch.
This can be a very useful indicator, and I'm sure some may find settings that work even better
than the default or recommended settings.
This indicator works on all markets, forex, cryptocurrency, and stocks.
For access to this and all indicators available, please DM me here or See profile. We are here
to help each other succeed! The more one succeeds the more we all succeed! We are all in this
together and every person deserves to be financially independent and confident when taking trades
and investing.

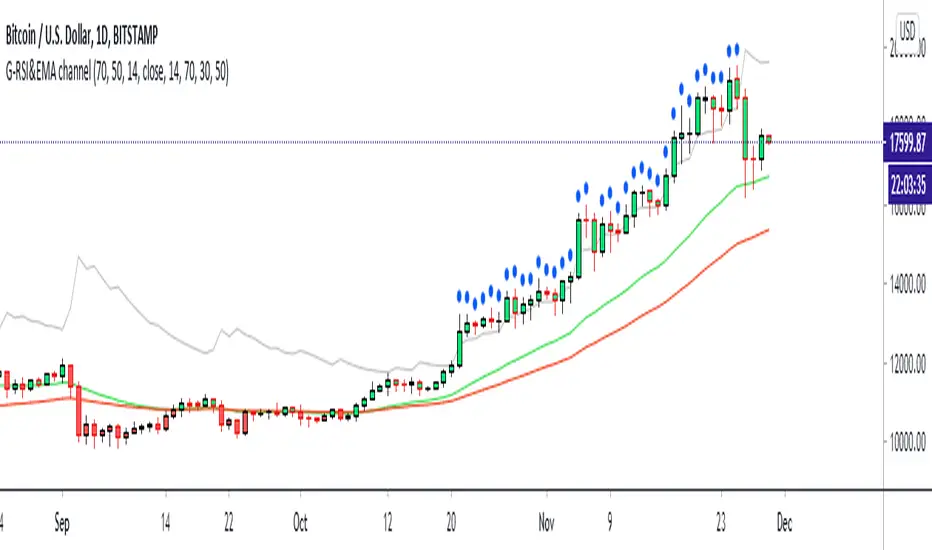
G-RSI&EMA channel v.1This my 2nd indicator : It's just a Strenghtening of trend channal
If price can come up on the green line it's mean price is side way or maybe bullish
and if price can come up on RSI (14)50 and EMA50 it have problaby to bullish trend
If the price have blue ball it's mean crazy strong bullish trend
If the price have red ball it's mean crazy strong bearish trend
you can use my 1st script together : 1st is " G-Bollingerbands Volatility breakout "
My 1st script detect the price begin to have volatility
My 2nd scrit detect the trend
Goodluck :D
PS: My 2nd script develop from someone in tradingview RSI script i'm sorry I can't remember but thank you very much.
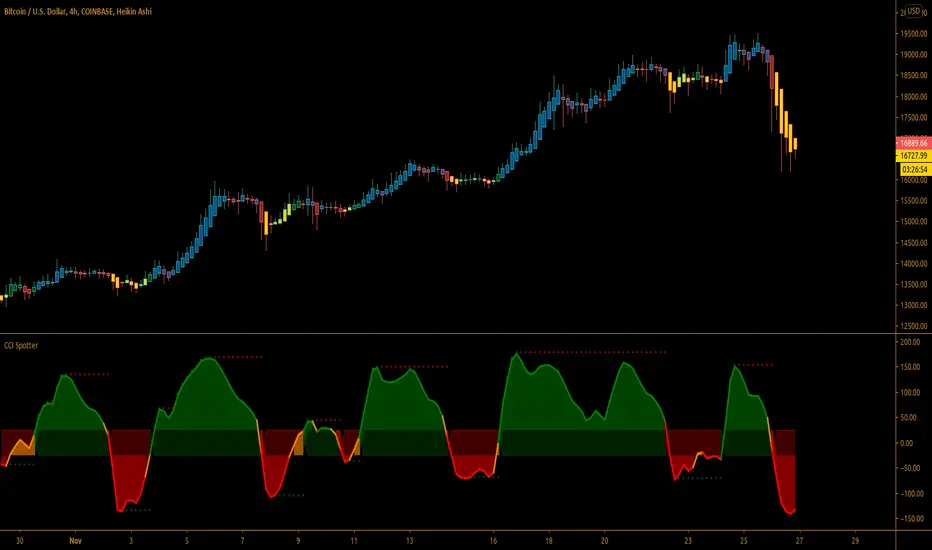
Simple CCI Spotter™TradeChartist Simple CCI Spotter is an elegant version of the classic CCI indicator and helps spot price trends using visually engaging and appealing CCI plot and background. The Bull and the Bear background fills are highly useful for traders who like to visually understand areas of entry and exit based on CCI .
===================================================================================================================
What does Simple CCI Spotter do?
Plots CCI with visually engaging colours for Bull and Bear zones (Green and Red) with optional background fill.
Plots CCI coloured bars on main chart based on user preferred Upper and Lower CCI bands (Default - 25/-25).
Plots CCI based on EMA smoothing (1 for Regular CCI without smoothing).
Plots Heikin Ashi CCI if enabled from indicator settings.
Plots CCI highs of Bull Zone and RSI lows of Bear Zone. Helps visually spot divergences.
===================================================================================================================
Note:
Default Settings:
5 period EMA Smoothed CCI .
For Heikin Ashi CCI on normal bars, enable ᴜsᴇ ʜᴇɪᴋɪɴ ᴀsʜɪ ᴄᴄɪ and change EMA CCI sᴍᴏᴏᴛʜɪɴɢ to 1.
===================================================================================================================