1 Indicator to rule them allThe best combination indicator consisting of 4 SMA's, 4 EMA's, Donchian Channels, Parabolic SAR, Bollinger Bands, Ichimoku Cloud, a trend strength highlight for the bollinger bands background according to the ADX, labels on the chart to draw in when the Directional Index plus and minus cross, and a background highlight for low and high volatility according to the Historical Volatility Percentile.
The Indicators and placed and group intentionally, with the SMA and EMA's next to the Donchian Channels to draw in areas of support and resistance, with the parabolic SAR afterwards for confirmation on entries and exits.
Next are the Bollinger Bands and the Ichimoku cloud, which when used in combination by an experienced trader allows one to see the trend and spot any developing opportunities at a glance. These can be used in combination with the ADX background in the bolls to point out when trends start and end.
The Directional Indexes crossing implies a equilibrium point has been reached between the buy and selling pressure. Finally the background highlight according to low and high periods of volatility does well to ensure you're entering into the best trades at the best times.
These indicators used together in combo with momentum oscillators will lead to a full and complete picture of the trend and the most likely places for future price to come, allowing a holistic view and confluence between different, noncollinear indicators to paint occam's razor onto the charts.
HVP

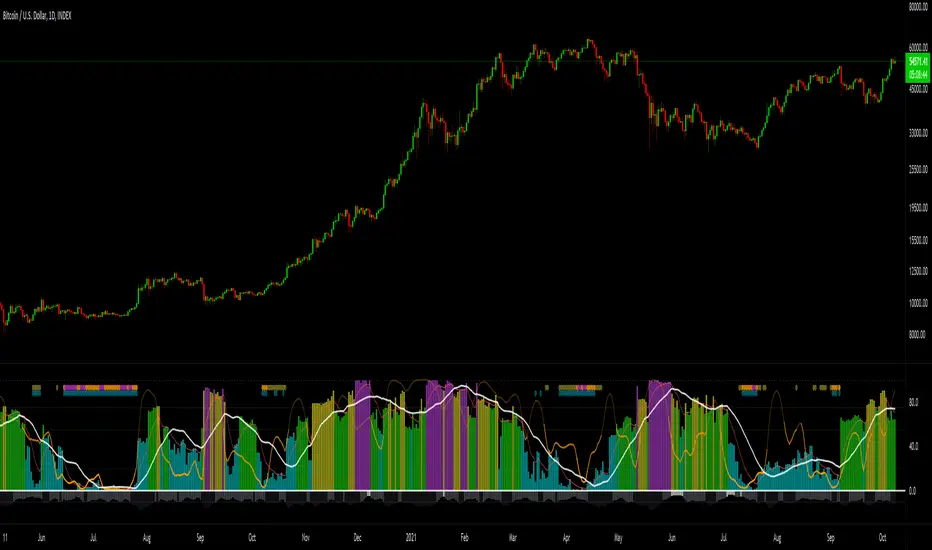
STOCH_HVP(picte)This indicator is made up of a stochastic oscillator and of historical volatility percentile. Historical volatility percentile basically tells you how volatile the market is based on how volatile it has been in the history.
Historical volatility is great for trading options but i have also found it to be great at finding trades with good risk/reward ratio. When market has extremely low volatility we can expect a bigger move to emerge along with expansion of volatility. But since historical volatility does not imply the direction of the market i added a stochastic oscillator with some horizontal levels i have found to serve as good support/resistance levels.
I found it useful for trading Forex pairs but it is especially powerful with bitcoin.

Borjas Tarh Explosive PivotsBorjas Tarh Explosive Pivots
This indicator includes:
1. Historical Volatility Percentile ( HVP ) +SMA+EMA
Core Idea (balipour) :
HVP Code Help (semiotic) : www.tradingview.com
For the Detailed Description read the Core (HVP) Idea indicator by "balipour" above.
2. Bollinger Bands Width ( BBW )
It's an Oscillation of BBW So it's trapped between 0 to 100. (And Lightly Smoothed)
3. Volume Oscillator
The Volume is oscillated so it's trapped between 0 and -30. (And Lightly Smoothed)
Below 10 Means the Volume in the context of the Candle Volume is pretty low.
4. The Shapes
These Shapes are based of all factors above.
D ( Blue ) : HVP is pretty Low. An Explosive Move is Coming.
A ( Yellow ) : An Explosive Move is Building Up.
B ( Orange ) : An Explosive Move is Near.
C ( Purple ) : An Explosive Move Will Happen Very Soon.
There is an Alternative Set:
On = Annual HVP and Default BBW .
Off = Fibonacci HVP and BBW .
© mrhashem
© Borjas Tarh Company
[KICK] Volatility HeatmapWith this indicator you can gauge the price volatility of an instrument across multiple timeframes in a very compact visualization. It allows you to find critically low areas of volatility and predict the likelihood of an imminent move or the conclusion of a move. While you can do this with other indicators, it is often easy to miss low volatility on timeframes that you don't normally survey.
Features:
Measure volatility using either Average True Range Percentile Rank (ATR-PR) or Historical Volatility Percentile (HVP)
Measure volatility from any other source (e.g. Volume, or custom series from another indicator) using HVP
2 Rendering Modes (Smooth and Distinct) as seen in the sample chart above
Ability to show current timeframe Volatility in bar chart above the heatmap
Get alerts when a certain number of timeframe levels (configurable) are showing critically low volatility (implying imminent move)
Get an alert when the current timeframe volatility level emerges from a critically low volatility zone (usually indicating the start of a significant move)
The bands on the map are 1x, 2x, 3x, 5x, 8x, 13x, 21x, and 34x the curent timeframe. The volatility measurements go (from lowest to highest): Lime, Blue, Dark Purple -> Light Purple (gradient), Magenta, Pink. If you see grey blocks/bands, these indicate that the instrument you are using does not have enough historical data to determine the volatility based on your timeframe and reference period. For example, if you are using a reference period of 100 and are on the daily view, to render the bottom-most band (x34) you would need around 3400 days of data (over 9 years).
You can use this indicator in multiple ways. My favorite way personally is to look for areas that have multiple consecutive timeframes showing low volatility warnings and then enter when the highest of those timeframes turns back to purple. Use other methods, analysis, or indicators to determine direction (or just straddle P.A. with market stops). If I am scalping, then I will generally mostly watch the "current timeframe" and get alerts when it emerges from low volatility.
Use the link below to watch a tutorial video, request a trial, or purchase for access.

Implied Volatility Percentile (IV Percentile, HVP) [Improved]Indicator showing the Implied Volatility (IV) Percentile for any coin/security.
Areas of low volatility are clearly highlighted. As volatility increases, the IV line moves upwards and the script indicates if the move is Bullish or Bearish.
This script has been designed to be:
Simple - it removes noise and provides a clear visualization of volatility at a glance
Smart - you can define the 'low volatility' threshold and the time period to measure so it can adapt to highly volatile assets in all timeframes
Useful - increased volatility tells us nothing about direction. This script also provides a visual signal indicating if increased volatility corresponds with a bullish or bearish move
How it works:
The script compares the current volatility to the volatility of the last 365 periods. The IV is range-bound between 0% and 100% and so provides a clear view of current volatility relative to previous volatility.
Volatility is typically mean-reverting so the longer a period of low volatility, the more likely it is that an increase is upcoming. This knowledge can be used to place trades in advance of big moves.
Examples of how it can assist your trading:
Using the indicator before Bitcoin's 50% drop in November 2018:
Using the indicator before Cardano's (ADA) 60% rise in early 2019: