GRID

GRID RELOADED 1.0Script for grid trading on Bitmex XBTUSD 5min
A quick description for the input parameters. I can detail privately the ones that are important:
Points between two same dir trades = how much the price must change before a new DCA can happen
Points between SHORTS = same for short trades
Global Take Profit points = take profit for all open positions expressed in the same units as the price
Global Stop Loss points = same as for profit
Take Profit points decrease per bar = this is how much the target global profit decreases each bar toward zero
Trend up to start a trade long = wait for the DEMA to show a long slope before opening new long positions
Max long position = max n. of long positions
Check trend on trade = wait for a positive/negative bar before long/short
Min Stochastic overbought/sold for trade = wait for the stochastic to be below/above this before long/short
Limit Orders long % below close price = place limit orders % before current price. the order could be left pending.
DEMA 1 Length = periods of DEMA for trends
HA Candles = toggle a pattern match to enter trades

RSI_GridUses oversold/overbought conditions of RSI on multiple time frames to provide buy/sell signals.
Important points:
1. The highest time frame of the grid should be the one you are viewing on the chart. This helps avoid false signals.
2. The time frame inputs work on minutes, so if you want a 2 hour time frame you should input 120.
3. This DOES re-paint, but only up to the highest tf. For example, using the default settings, you should have a 1H chart and refresh the chart with F5 each hourly candle switch.
4. The red indicates oversold, green is overbought, grey is within normal range. The default alert condition is 4, this means when 4 time frames print overbought/sold and the next candle prints with less than 4 in an overbought/sold condition, an alert will trigger.
5. Pink is buy, blue is sell.
This is still a work in progress, but I kind of abandoned it once I realised how Tradingview plots indicators based on two different times (past and present). I can link an article if you are interested in the reasons why TV does this.

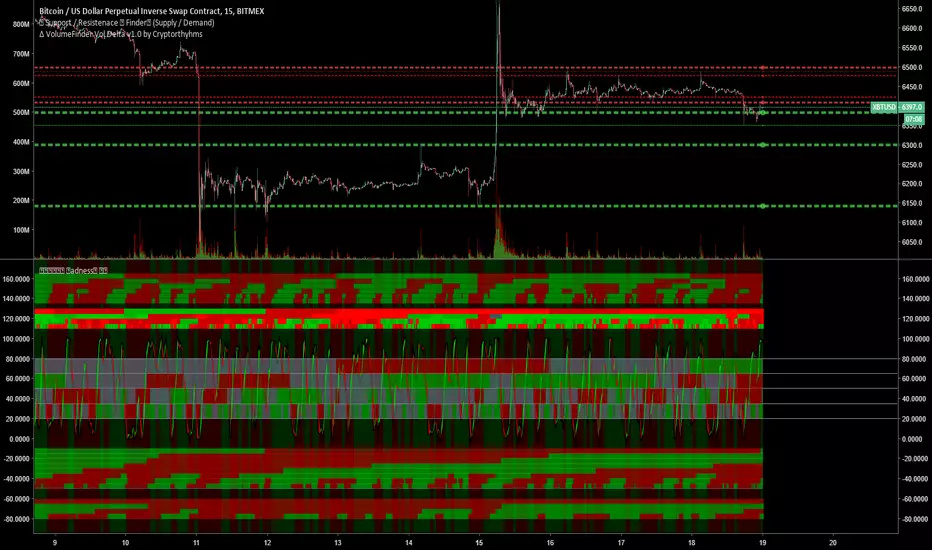
🕟𝕄🕗𝕋🕛𝔽 Madness MTF Grid by 🇨🇷🇾🇵🇹🇴🇷🇹🇭🇾🇭🇲🇸Here is a short description. This indicator being free will not have documentation for ALL things. Just the basics. There are 5 indicators included in it which I will not go into how each one works. There is ALOT of info on all the indicators included in here, just use google for that.
📊For each "row" of colored bands this represents one indicator. This is meant to be used on the 15m (or less) timeframe, and it looks up into higher TF's. It is meant to be maximized, so have this open in one tab and the chart on another. Dual Monitors are best. All options and Time frames are fully configurable inputs.
📈Indicators from top to bottom are:
1.)Polarity Filtration - 6 Timeframes
2.) Price Volume Trend - 4 Timeframes
3.) Stochastic RSI - 4 Timeframe Grid, and Current Timeframe in lines/ribbons
4.) MACD Crossovers - 8 Timeframes
5.)SuperTrend - 4 Timeframes
⏲Inside each larger "band" there are smaller rows. Each of these small rows represents one timeframe (30m, 60, 2h, 4h, etc) What timeframes you choose for them is completely configurable althought the current setup is already ideal to trade on 15m
⏲For these smaller rows the ones on top are highest timeframe(i.e. 4h) and the bottom small rows are lowest timeframe
⏲So each small row is like being able to check that indicator many timeframes at once. This will help you determine overall trends without switching to different timeframes on your chart all the time
📈The last piece of the puzzle is the background color. This background color is whether the chart is going up or down on the 1 hour heiken Ashi candle chart. Heiken ashi always shows up or down based on how they draw the candles, so its another useful trend indicator
👍If you enjoy MTF Madness all I ask in return is that you like the indicator and follow me on tradingview (profile here: www.tradingview.com)
❓If you have any questions, join us in the telegram chat in my signature!
CTC BTFD V3In cryptocurrency trading, It is normal that the price will retrace more than 70% in bear market. The bear market, the coin will be accumulated for the next bull market to come. To benefit in this situation, we need to buy low. The price must be low enough before we can enter the market.
This CTC BTFD Grid system is designed to proof the concept. It works exceptionally well on nearly all crypto. The ruls is simple. buy the fucking dip. Wait for 50% retracement or more before enter the market.

Neo BitMEX Futures Hedge Grid Alerts Premium v1.0This indicator was made to streamline finding the optimal entry to cash and carry/hedge on a futures contract when margin trading.
Explanation of the indicator:
This indicator has built-in alert conditions that you can use to give you email alerts, in-browser sound alerts, or SMS alerts. These alerts are based upon futures prices being in contango or backwardation.
From top to bottom, the grid shows XBTU18, XBTZ18, OkEx's Quarterlies (OKCOIN:BTCUSD3M), and CME's futures.
Red: Futures are trading above your defined range (default 1%) of spot
Maroon: Futures are trading above twice your defined range of spot
Lime: Futures are trading below your defined range (default 1%) of spot
Green: Futures are trading below twice your defined range of spot
What's configurable:
% to trigger
Grid size
Bar color toggle
Label toggle
Spot/index source (Bitfinex's BTCUSD, BitMEX's XBTUSD, and BitMEX's XBT Index are available)
Pricing:
Currently this standalone indicator is 0.007 BTC for lifetime use.
Example of use:
On 4 May 2018, BitMEX's XBTU18 was trading >2% above perpetual swap. The grid alerts signaled that and if one were long on bitcoin spot on any exchange, then it would have been a good idea to hedge a short on XBTU18. Eventually from there the premium gap was closed while bitcoin fell.
Here is the indicator shown with bar coloring and labels.

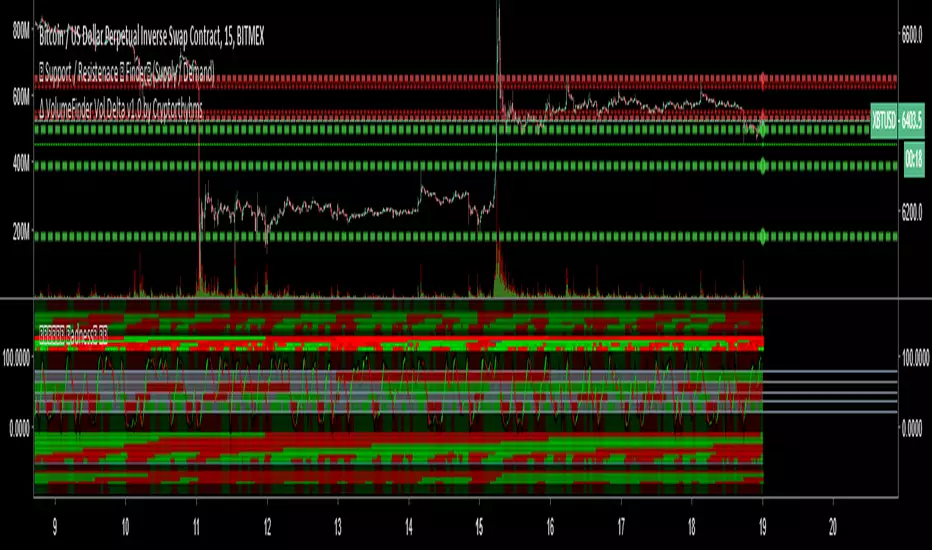
BottomFinder MTF Madness - 5x MTF Grid IndicatorsHello Again Trading View!
Bottom Finder Team here bringing another delicious indicator, this time to help spot those trends! This version is closed for Beta Testing with our subscribers only for the next few weeks. After beta improvements it will be released free to anyone who signs up as a free member on our site.
This is meant to be used on the 15m timeframe, and it looks up into higher TF's. It is meant to be maximized, so have this open in one tab and the chart on another. Dual Monitors are best. All options and Time frames are fully configurable inputs.
Indicators from top to bottom are:
1.)Polarity Filtration - 6 Timeframes
2.)Price Volume Trend - 4 Timeframes
3.)Stochastic RSI - 4 Timeframe Grid, and Current Timeframe in lines/ribbons
4.)MACD Crossovers - 8 Timeframes
5.)SuperTrend - 4 Timeframes
And last...
6.)Background Color indicator is up/down (green/red) price on 1 Hour Heiken Ashi candle chart.
No more swapping back and forth between timeframes!
For access to this and many other exclusive indicators - you can visit our telegram and ask about becoming a subscriber. All our paid indicators have a reasonable lifetime cap price. Once you reach it, indicator is yours for life - no more subscription.
DepthHouse RSI Grid MTFDepthHouse RSI Grid MTF is used to determine overbought and oversold levels based on the RSI across multiple time frames.
The default time frames are the 30m, 2H, 8H and 16H however these are completely adjustable.
This indicator also allows the user to select which RSI band to display based on the time frame.
The default is set to the current time frame, however the user can select any of the other four time frames.
OverBought & Oversold Levels are also entirely adjustable.
Meaning you can adjust the 30, 70 ranges, and it will alter the overbought and oversold values across ALL timeframes.
How to get:
As you can see this is an invite only script. In the coming month this indicator, along with many others will become pay to use only. (website on my profile page)
However all my indicators will be FREE until May 1, 2018 . So please try them out!
To take advantage of this free trial:
Just leave a comment!
IF you are viewing this after May 1st. Please feel free to send me a PM or visit my website.

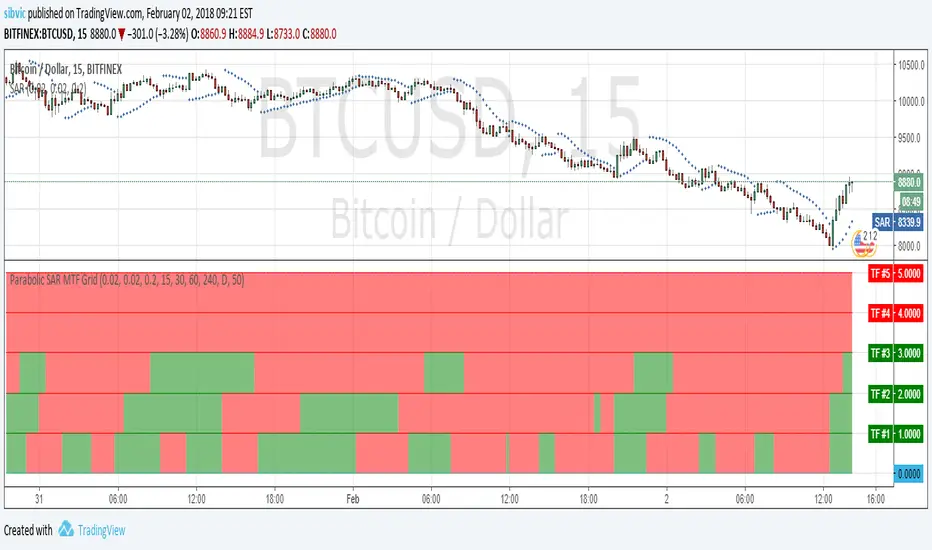
Parabolic SAR MTF GridShow a grid with Parabolic SAR in 5 timeframes. Shows an alert when the Parabolic SAR show the same direction for all 5 timeframes.
MTF Polarity Grid [DW]This is an experimental study designed to track directional polarities across multiple timeframes and express them as a simple two color grid.
The polarity in this calculation is determined by divergence between a fast and slow McGinley Dynamic.
Your current resolution's polarity is the top row, the rows below are are for higher timeframes of your choice.


[RS]Stop Hunt Levels V0Request for SpreadEagle71:
Stop Hunt Levels adapted from:
www.investopedia.com
configuration:
smoothing: smooths/average the source higher value will remove spikes but delay the speed of adjusting
source: source to compare crossing lines.
Rounding Value: value space of the grid.
Entry Window Size: Space for entrys.

[RS]Cumulative Average Price Gridgrid based on the cumulative average price.
on a sidenote: looks like im baned from chat for a week.
