TRV & nTRV - Trimmed Range VolatilityGrid bots require stable volatility measurement - ATR becomes misleading when gaps and sudden spikes distort the average. TRV (Trimmed Range Volatility) is an advanced version of ATR: it filters outliers at the extremes (highest and lowest ranges) and remains unaffected by gaps. This provides real-time, accurate volatility measurement for grid bot setup.Grid bots require stable volatility measurement - ATR becomes misleading when gaps and sudden spikes distort the average. TRV (Trimmed Range Volatility) is an advanced version of ATR: it filters outliers at the extremes (highest and lowest ranges) and remains unaffected by gaps. This provides real-time, accurate volatility measurement for grid bot setup.
Why We Developed TRV?
When a gap or sudden spike occurs in the morning, this extreme movement affects standard ATR calculations for an extended period. Even if the price moves sideways for the rest of the day, ATR remains elevated. This causes grid bots to operate with unnecessarily wide spacing and execute fewer trades.
TRV Advantages:
✅ Unaffected by Gaps: Opening gaps don't distort the calculation
✅ Extreme Point Elimination: Filters the largest and smallest outlier candles
✅ Real-Time Accuracy: Shows current market volatility
✅ Grid Bot Optimization: Enables tighter and more efficient grid spacing
✅ Comparison Capability: Compare different stocks and timeframes with nTRV
Grid Bot Usage:
The TRV value is used directly to calculate the number of grid lines:
(Resistance - Support) / TRV = Number of Grid Lines
Example:
Resistance: $110
Support: $90
TRV: $2
Grid Count: (110-90)/2 = 10 grid lines
Features:
Two Filtering Modes: Manual (enter number) or Percentage-Based (automatic ratio)
Four Indicators in One: nTRV, TRV, ATR, and nATR all displayed on the same panel
nTRV: Normalized value (percentage-based, for stock comparison)
TRV: Absolute value (currency-based, for grid calculation)
ATR & nATR Included: Standard ATR and nATR for direct comparison with TRV
Comprehensive Analysis: Compare filtered (TRV) vs unfiltered (ATR) volatility side-by-side
Default: 10% top, 10% bottom outlier elimination
Conclusion:
TRV is an advanced version of ATR specifically designed for grid bot traders. By filtering outlier movements, it provides more stable and reliable volatility measurement. The indicator includes both TRV (filtered) and ATR (unfiltered) on the same chart, giving traders a comprehensive view to make informed decisions. This dual-display approach enables more efficient grid strategies and increased trading frequency.
GRID

Multi-Mode Grid StrategyGrid Strategy (SIMPLE)
█ Overview
This script is a system trading tool designed to generate cash flow from market volatility without relying on short-term directional predictions. It operates on the principle of Grid Trading , creating a mesh of buy and sell orders within a user-defined price range.
The strategy automates the process of "buying the dip" and "selling the bounce" repeatedly. It is most effective in sideways markets or during accumulation phases where the price oscillates within a specific channel.
█ TRADING MINDSET & SETUP GUIDE
To use this tool effectively, you must shift your perspective from "Sniper" (trying to hit the perfect entry) to "Manager" (managing a zone). Here is the required mindset for setting up this strategy:
Shift from Prediction to Range Definition
Don't ask: "Will the price go up or down tomorrow?"
Ask instead: "What is the price range the asset is unlikely to break out of in the coming weeks?"
Your primary job is to define the Grid Top Price (Ceiling) and Grid Bottom Price (Floor). As long as the price stays within this "Arena," the strategy will continue to execute trades.
Embrace Volatility as Fuel
For a trend follower, chop/sideways action is a nightmare. For a Grid Trader, it is fuel. Every time the price crosses a grid line down, it builds inventory. Every time it crosses back up, it realizes profit. You want the price to wiggle as much as possible within your defined boundaries.
Capital Allocation & Survivability
The biggest risk in grid trading is the price crashing below your Grid Bottom Price .
Mindset Check: Before launching, assume the price WILL drop to your bottom price immediately. Can your account handle that drawdown?
The script includes leverage and capital percentage inputs to help you size your position correctly. Never allocate 100% of your capital to a tight range without understanding the liquidation risk.
█ HOW IT WORKS
Grid Construction:
The script divides the space between your Upper Border and Lower Border into specific levels based on the Grid Quantity .
- Arithmetic: Equal spacing between lines (Standard).
- Geometric: Spacing based on mathematical ratios (useful for wider ranges).
Execution Logic:
- Entry: When price crosses below a grid line, a Long position is opened.
- Exit: When price bounces back up by a specific number of grid levels (defined by "Distance of TP"), the specific position is closed for a profit.
Time & Backtesting:
You can set specific Start and End Times . This allows you to backtest how the grid would have performed during specific historical volatility events before deploying it on live markets.
█ VISUALIZATION DASHBOARD
To keep you informed without cluttering the chart, the script features an information table at the bottom right:
Cash Out: Total realized profit booked into the account.
Open Position: How many grid levels are currently active (holding bags) vs. total levels.
Open Trade: The current floating P/L of held positions (Unrealized).
Max Drawdown: The deepest drawdown the strategy experienced during the test period.
RISK DISCLAIMER
Grid trading involves significant risk, particularly in strong trending markets that break out of your range against your position. This strategy does not use a stop-loss per trade; it relies on the user defining a safe "Bottom Price" and allocating capital accordingly. Past performance in backtesting does not guarantee future results. This script is a tool for execution and analysis, not financial advice.

Simple Grid Trading v1.0 [PUCHON]Simple Grid Trading v1.0
Overview
This is a Long-Only Grid Trading Strategy developed in Pine Script v6 for TradingView. It is designed to profit from market volatility by placing a series of Buy Limit orders at predefined price levels. As the price drops, the strategy accumulates positions. As the price rises, it sells these positions at a profit.
Features
Grid Types : Supports both Arithmetic (equal price spacing) and Geometric (equal percentage spacing) grids.
Flexible Order Management : Uses strategy.order for precise control and prevents duplicate orders at the same level.
Performance Dashboard : A real-time table displaying key metrics like Capital, Cashflow, and Drawdown.
Advanced Metrics : Includes Max Drawdown (MaxDD) , Avg Monthly Return , and CAGR calculations.
Customizable : Fully adjustable price range, grid lines, and lot size.
Dashboard Metrics
The dashboard (default: Bottom Right) provides a quick snapshot of the strategy's performance:
Initial Capital : The starting capital defined in the strategy settings.
Lot Size : The fixed quantity of assets purchased per grid level.
Avg. Profit per Grid : The average realized profit for each closed trade.
Cashflow : The total realized net profit (closed trades only).
MaxDD : Maximum Drawdown . The largest percentage drop in equity (realized + unrealized) from a peak.
Avg Monthly Return : The average percentage return generated per month.
CAGR : Compound Annual Growth Rate . The mean annual growth rate of the investment over the specified time period.
Strategy Settings (Inputs)
Grid Settings
Upper Price : The highest price level for the grid.
Lower Price : The lowest price level for the grid.
Number of Grid Lines : The total number of levels (lines) in the grid.
Grid Type :
Arithmetic: Distance between lines is fixed in price terms (e.g., $10, $20, $30).
Geometric: Distance between lines is fixed in percentage terms (e.g., 1%, 2%, 3%).
Lot Size : The fixed amount of the asset to buy at each level.
Dashboard Settings
Show Dashboard : Toggle to hide/show the performance table.
Position : Choose where the dashboard appears on the chart (e.g., Bottom Right, Top Left).
How It Works
Initialization : On the first bar, the script calculates the price levels based on your Upper/Lower price and Grid Type.
Entry Logic :
The strategy places Buy Limit orders at every grid level below the current price.
It checks if a position already exists at a specific level to avoid "stacking" multiple orders on the same line.
Exit Logic :
For every Buy order, a corresponding Sell Limit (Take Profit) order is placed at the next higher grid level.
MaxDD Calculation :
The script continuously tracks the highest equity peak.
It calculates the drawdown on every bar (including intra-bar movements) to ensure accuracy.
Displayed as a percentage (e.g., 5.25%).
Disclaimer
This script is for educational and backtesting purposes only. Grid trading involves significant risk, especially in strong trending markets where the price may move outside your grid range. Always use proper risk management.

Advanced Grid Trading System - [WOLONG X DBG]Overview
This sophisticated grid trading system combines Bollinger Bands breakout analysis with RSI filtering to create a comprehensive automated trading approach. The system implements advanced grid management with dynamic lot sizing, intelligent ATR-based spacing, and comprehensive risk management features including drawdown protection, time-based trading controls, and multi-level position management.
Methodology
The indicator employs a multi-layered analytical approach based on established technical analysis principles:
Core Signal Generation
Bollinger Bands Breakout Engine: Utilizes customizable period Bollinger Bands (default 35) with highest/lowest price detection over the calculation period to identify potential reversal points when price breaks below recent lows or above recent highs
RSI Confirmation Filter: Implements RSI-based signal filtering with customizable maximum RSI values to avoid entries during overbought/oversold conditions, requiring RSI below (50 - max_rsi_value) for buy signals and above (50 + max_rsi_value) for sell signals
Grid Management System: Advanced progressive grid system with configurable pip-based spacing, intelligent ATR-based distance calculation, and cumulative lot sizing with customizable multipliers
Advanced Features
Dynamic Lot Sizing: Eight calculation methods including Fixed Lot, Dynamic by Balance/Equity, and risk-based percentage approaches (Low Risk 20%, Medium Risk 40%, High Risk 80%, Extreme Risk 120%, Margin Loading)
Comprehensive Risk Management: Multi-layered drawdown protection with percentage and absolute value limits, automatic position closure options, and trading suspension features with time-based recovery
Time-Based Controls: Configurable GMT-based trading hours with start/stop times for session-specific trading and market condition adaptation
Key Components
Signal Types
Primary Entry Signals: Buy signals when price breaks below recent lowest values within Bollinger period with RSI confirmation; Sell signals when price breaks above recent highest values with RSI confirmation
Grid Expansion Logic: Automatic additional entries based on configurable pip distances from base price, triggered when price moves against initial position by specified intervals
Take Profit Systems: Dual-mode TP calculation using either weighted average across all positions or individual level TP with customizable pip values
Stop Loss Protection: Grid-wide SL with customizable pip distances or default 1000-pip protection
Visual Elements
Bollinger Bands Display: Three-line Bollinger Bands system with upper, middle (SMA), and lower bands for trend and volatility analysis
Grid Base Line: Yellow dashed line showing initial grid entry level with right extension for reference
Comprehensive TP/SL Lines: Dual-line system showing both first order reference levels (dotted, light colors) and official Martingale weighted average levels (solid, bold colors)
Entry Point Labels: Detailed entry markers showing BUY/SELL direction, grid level, and lot size information
Dual Dashboard System: Main control panel (top-right) and dark theme entry log (bottom-right) with real-time status updates
Usage Instructions
Basic Configuration
Capital Management: Select lot calculation method from dropdown (recommended: "Low Risk 20%" for conservative approach)
Grid Parameters: Configure trading distance (default 35 pips) and enable smart distance for ATR-based dynamic adjustments
Strategy Settings: Set Bollinger period (35), RSI period (20), and maximum RSI value (15) for signal filtering
Risk Controls: Configure maximum drawdown percentage and action when limits are exceeded
Signal Interpretation
Buy Entry Conditions: Generated when current close price breaks below the lowest price in the Bollinger calculation period, with RSI below (50 - max_rsi_value)
Sell Entry Conditions: Generated when current close price breaks above the highest price in the Bollinger calculation period, with RSI above (50 + max_rsi_value)
Grid Expansion: Automatic additional entries when price moves against position by configured pip distances, with progressive lot sizing using multipliers
Exit Conditions: Weighted average TP achievement, breakeven after specified grid levels, or manual cycle completion
Dashboard Analysis
Main Control Panel: Displays current grid level, trading direction, open orders count, total volume, next lot size, grid P&L, current balance, floating drawdown, RSI status, trading hours, and system locks
Dark Theme Entry Log: Shows recent entry history with timestamps, entry types (BUY/SELL), prices, lot sizes, and grid levels for trade tracking
Risk Monitoring: Real-time drawdown tracking with color-coded warnings and automatic protection activation
Risk Management Features
Automatic Protections
Drawdown Limits: Configurable percentage (default 100%) and absolute USD drawdown limits with four response options: Close Orders and Stop 24h/Until Restart, or Prevent New Grid/Until Restart
Position Sizing: Eight dynamic lot calculation methods based on account equity, balance, or risk tolerance with maximum lot size limits
Grid Limitations: Maximum number of grid levels (default 9) to prevent excessive exposure accumulation
Time Controls: GMT-based trading hour restrictions to avoid high-volatility periods or specific market sessions
Confirmation Requirements
Multi-Indicator Alignment: Requires both Bollinger Bands breakout and RSI confirmation before signal generation
Intelligent Spacing: ATR-based grid spacing adjustment using short-term (96-period) vs long-term (672-period) ATR ratio for market volatility adaptation
Progressive Sizing: Configurable lot multipliers for different grid levels (Order 2: 1.0x, Orders 3-5: 2.0x, Orders 6+: 1.5x default)
Optimal Settings
Timeframe Recommendations
Scalping: 1M-5M charts with reduced grid spacing (20-25 pips) and tighter RSI filters
Day Trading: 15M-1H charts with standard settings (35 pips) and default RSI parameters
Swing Trading: 4H-Daily charts with increased spacing (50+ pips) and relaxed RSI filters
Market Conditions
Trending Markets: Reduce RSI maximum value to 10-12, increase grid spacing to 40-50 pips, enable breakeven functionality
Ranging Markets: Standard settings with weighted TP enabled and moderate grid spacing
High Volatility: Enable smart distance, reduce maximum grid levels to 6-7, increase drawdown limits
Advanced Features
Customization Options
Lot Calculation Methods: Eight different approaches from fixed lot (0.01) to risk-based percentage calculations with margin loading options
Grid Multipliers: Separate multiplier settings for different grid levels (2nd order, 3rd-5th orders, 6th+ orders) with decimal precision
TP/SL Configuration: Individual or weighted average TP calculation with positive/negative pip values, breakeven after specified levels
Visual Controls: Toggle options for dashboard display, entry labels, TP/SL lines, lot information, and dark theme components
Technical Specifications
Grid Management: Up to 50 configurable grid levels with progressive lot sizing and cumulative position tracking
Risk Controls: Dual drawdown limits (percentage and absolute) with four different response actions and time-based recovery
Time Management: GMT-based trading hours with flexible start/end times supporting overnight sessions
Alert System: Five comprehensive alert conditions for new signals, drawdown warnings, maximum levels, and cycle completion
Important Limitations
Lagging Nature: Signals may appear after optimal entry points due to confirmation requirements and breakout validation
Grid Risk: Progressive lot sizing can lead to significant exposure accumulation during extended adverse price movements
Market Dependency: Performance varies significantly between trending and ranging market conditions, requiring parameter adjustments
Computational Load: Complex multi-array calculations and real-time dashboard updates may impact performance on slower devices
No Guarantee: All signals are suggestions based on technical analysis calculations and may be incorrect
Educational Disclaimers
This indicator is designed for educational and analytical purposes only. It represents a technical analysis tool based on mathematical calculations of historical price data and should not be considered as financial advice or trading recommendations.
Risk Warning: Grid trading involves substantial risk of loss and is not suitable for all investors. The progressive lot sizing methodology can lead to significant exposure accumulation during adverse market movements. Past performance of any trading system or methodology is not necessarily indicative of future results.
Important Notes:
Always conduct your own analysis before making trading decisions
Use appropriate position sizing and risk management strategies
Never risk more than you can afford to lose
Consider your investment objectives, experience level, and risk tolerance
Seek advice from qualified financial professionals when needed
Grid trading can result in multiple simultaneous positions with compounding risk exposure
Performance Disclaimer: Backtesting results do not guarantee future performance. Market conditions change constantly, and what worked in the past may not work in the future. The indicator's mathematical calculations are based on historical data patterns that may not repeat. Always paper trade new strategies before risking real capital.
System Limitations: The indicator relies on technical analysis principles and may produce false signals during unusual market conditions, news events, or periods of extreme volatility. Users should implement additional confirmation methods and maintain strict risk management protocols.

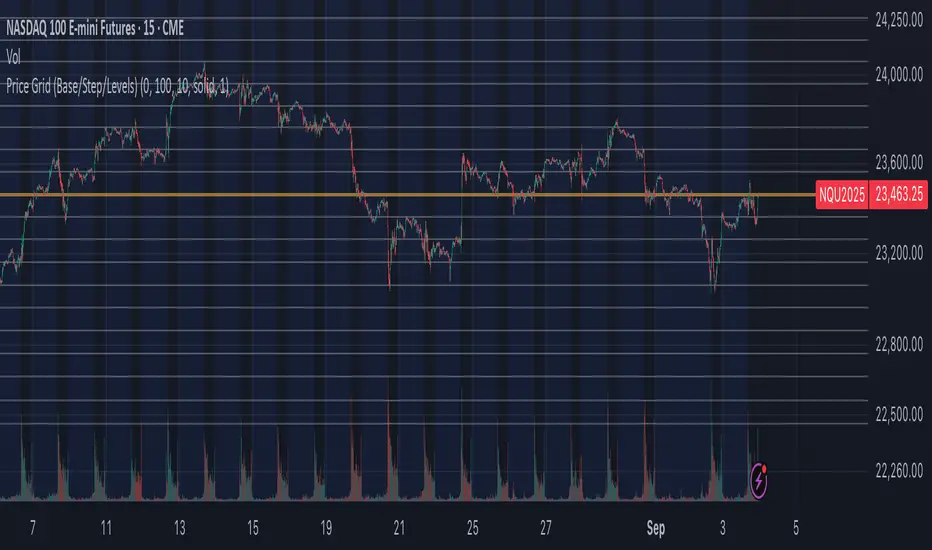
Price Grid (Base/Step/Levels)Price Grid (Base/Step/Levels) is a simple yet powerful tool for visual traders. It automatically draws a customizable grid of horizontal price levels on your chart.
You choose a base price, a grid step size, and the number of levels to display above and below. The indicator then plots evenly spaced lines around the base, helping you:
Spot round-number zones and psychological levels
Plan entries, exits, and stop-loss placements
Visualize support/resistance clusters
Build grid or ladder trading strategies
The base line is highlighted so you always know your anchor level, while the other levels are styled separately for clarity.
⚙️ Inputs
Base price → anchor level (set 0 to use current close price)
Grid step → distance between levels
Number of levels → lines drawn above & below base
Line style / width / colors → full customization
✅ Notes
Works on any market and timeframe
Automatically respects the symbol’s minimum tick size
Lightweight & non-repainting
Autoback Grid Lab [trade_lexx]Autoback Grid Lab: Your personal laboratory for optimizing grid strategies.
Introduction
First of all, it is important to understand that Autoback Grid Lab is a powerful professional tool for backtesting and optimization, created specifically for traders using both grid strategies and regular take profit with stop loss.
The main purpose of this script is to save you weeks and months of manual testing and parameter selection. Instead of manually testing one combination of settings after another, Autoback Grid Lab automatically tests thousands of unique strategies on historical data, providing you with a comprehensive report on the most profitable and, more importantly, sustainable ones.
If you want to find mathematically sound, most effective settings for your grid strategy on a specific asset and timeframe, then this tool was created for you.
Key Features
My tool has functionality that transforms the process of finding the perfect strategy from a routine into an exciting exploration.
🧪 Mass testing of thousands of combinations
The script is able to systematically generate and run a huge number of unique combinations of parameters through the built-in simulator. You set the ranges, and the indicator does all the work, testing all possible options for the following grid settings:
* Number of safety orders (SO Count)
* Grid step (SO Step)
* Step Multiplier (SO Multiplier) for building nonlinear grids
* Martingale for controlling the volume of subsequent orders
* Take Profit (%)
* Stop Loss (%), with the possibility of calculating both from the entry point and from the dynamic breakeven line
* The volume of the base order (Volume BO) as a percentage of the deposit
🏆 Unique `FinalScore` rating system
Sorting strategies by net profit alone is a direct path to self—deception and choosing strategies that are "tailored" to history and will inevitably fail in real trading. To solve this problem, we have developed FinalScore, a comprehensive assessment of the sustainability and quality of the strategy.
How does it work?
FinalScore analyzes each combination not one by one, but by nine key performance metrics at once, including Net Profit, Drawdown, Profit Factor, WinRate, Sharpe coefficients, Sortino, Squid and Omega. Each of these indicators is normalized, that is, reduced to a single scale. Then, to test the strategy for strength, the system performs 30 iterations, each time assigning random weights to these 9 metrics. A strategy gets a high FinalScore only if it shows consistently high results under different evaluation criteria. This proves her reliability and reduces the likelihood that her success was an accident.
📈 Realistic backtesting engine
The test results are meaningless if they do not take into account the actual trading conditions. Our simulator simulates real trading as accurately as possible, taking into account:
* Leverage: Calculation of the required margin to open and hold positions.
* Commission: A percentage commission is charged each time an order is opened and closed.
* Slippage: The order execution price is adjusted by a set percentage to simulate real market conditions.
* Liquidation model: This is one of the most important functions. The script continuously monitors the equity of the account (capital + unrealized P&L). If equity falls below the level of the supporting margin (calculated from the current value of the position), the simulator forcibly closes the position, as it would happen on a real exchange. This eliminates unrealistic scenarios where the strategy survives after a huge drawdown.
🔌 Integration with external signals
The indicator operates in two modes:
1. `No Signal': Standard mode. The trading cycle starts immediately as soon as the previous one has been closed. Ideal for testing the "pure" mechanics of the grid.
2. `External Signal`: In this mode, a new trading cycle will start only when a signal is received from an external source. You can connect any other indicator (such as the RSI, MACD, or your own strategy) to the script and use it as a trigger to log in. This allows you to combine the power of a grid strategy with your own entry points.
📊 Interactive and informative results panel
Upon completion of the calculations, a detailed table with the TOP N best strategies appears on the screen, sorted according to your chosen criterion. For each strategy in the rating, you will see not only the key metrics (Profit, Drawdown, duration of transactions), but also all the parameters that led to this result. You can immediately take these settings and apply them in your trading.
Application Options: How To Solve Your Problems
Autoback Grid Lab is a flexible tool that can be adapted to solve various tasks, from complete grid optimization to fine—tuning existing strategies. Here are some key scenarios for its use:
1. Complete Optimization Of The Grid Strategy
This is the basic and most powerful mode of use. You can find the most efficient grid configuration for any asset from scratch.
* How to use: Set wide ranges for all key grid parameters ('SO Count`, SO Step, SO Multiplier, Martingale, TP, etc.).
* In the `No Signal` mode: You will find the most stable grid configuration that works as an independent, constantly active strategy, regardless of which-or entrance indicators.
* In the `External Signal` mode: You can connect your favorite indicator for input (for example, RSI, MACD or a complex author's script) and find the optimal grid parameters that best complement your input signals. This allows you to turn a simple signaling strategy into a full-fledged grid system.
2. Selecting the Optimal Take Profit and Stop Loss for Your Strategy
Do you already have an entry strategy, but you are not sure where it is best to put Take Profit and Stop Loss? Autoback Grid Lab can solve this problem as well.
* How to use:
1. Disable optimization of all grid parameters (uncheck SO Count, SO Step, Martingale, etc.). Set the Min value for SO Count to 0.
2. Set the ranges for iteration only for 'Take Profit` and `Stop Loss'.
3. Turn on the External Signal mode and connect your indicator with input signals.
* Result: The script will run your historical entry signals with hundreds of different TP and SL combinations and show you which stop order levels bring maximum profit with minimal risk specifically for your entry points.
3. Building a Secure Network with Risk Management
Many traders are afraid of grid strategies because of the risk of large drawdowns. With the help of the optimizer, you can purposefully find the parameters for such a grid, which includes mandatory risk management through Stop Loss.
* How to use: Enable and set the range for Stop Loss, along with other grid parameters. Don't forget to test both types of SL calculations (`From entry point` and `From breakeven line`) to determine which one works more efficiently.
* Result: You will find balanced strategies in which the grid parameters (number of orders, martingale) and the Stop Loss level are selected in such a way as to maximize profits without going beyond the acceptable risk level for you.
How To Use The Indicator (Step-By-Step Guide)
Working with the Autoback Grid Lab is a sequential process consisting of four main steps: from initial setup to analysis of the finished results. Follow this guide to get the most out of the tool.
Step 1: Initial Setup
1. Add the indicator to the chart of your chosen asset and timeframe.
2. Open the script settings. The first thing you should pay attention to is the ⚙️ Optimization Settings ⚙️ group.
3. Set the `Bars Count'. This parameter determines how much historical data will be used for testing.
* Important: The more bars you specify, the more statistically reliable the backtest results will be. We recommend using the maximum available value (25,000) to test strategies at different market phases.
* Consider: The indicator performs all calculations on the last historical bar. After applying the TradingView settings, it will take some time to load all the specified bars. The results table will appear only after the data is fully loaded. Don't worry if it doesn't appear instantly. And if an error occurs, simply switch the number of combinations to 990 and back to 1000 until the table appears.
Step 2: Optimization Configuration
At this stage, you define the "universe" of parameters that our algorithm will explore.
1. Set the search ranges (🛠 Optimization Parameters 🛠 group).
For each grid parameter that you want to optimize (for example, SO Count or `Take Profit'), you must specify three values:
* Min: The minimum value of the range.
* Max: The maximum value of the range.
* Step: The step with which the values from Min to Max will be traversed.
*Example:* If you set Min=5, Max=10, and Step=1 for SO Count, the script will test strategies with 5, 6, 7, 8, 9, and 10 safety orders.
* Tip for users: To get the first results quickly, start with a larger step (for example, TP from 0.5% to 2.5% in 0.5 increments instead of 0.1). After you identify the most promising areas, you can perform a deeper analysis by expanding the ranges around these values.
2. Set Up Money Management (Group `💰 Money Management Settings 💰`).
Fill in these fields with the values that best match your actual trading conditions. This is critically important for obtaining reliable results.
* Capital: Your initial deposit.
* Leverage: Leverage.
* Commission (%): Your trading commission as a percentage.
* Slippage (%): Expected slippage.
* Liquidation Level (%): The level of the supporting margin (MMR in %). For example, for Binance Futures, this value is usually between 0.4% and 2.5%, depending on the asset and position size. Specify this value for your exchange.
3. Select the Sorting Criterion and the Direction (Group `⚙️ Optimization Settings ⚙️').
* `Sort by': Specify the main criteria by which the best strategies will be selected and sorted. I strongly recommend using finalScore to find the most balanced and sustainable strategies.
* `Direction': Choose which trades to test: Long, Short or Both.
Step 3: Start Testing and Work with "Parts"
The total number of unique combinations generated based on your ranges can reach tens of millions. TradingView has technical limitations on the number of calculations that the script can perform at a time. To get around this, I implemented a "Parts" system.
1. What are `Part` and `Combinations in Part'?
* `Combinations in Part': This is the number of backtests that the script performs in one run (1000 by default).
* `Part`: This is the number of the "portion" of combinations that you want to test.
2. How does it work in practice?
* After you have everything set up, leave Part:1 and wait for the results table to appear. You will see the TOP N best strategies from the first thousand tested.
* Analyze them. Then, to check the next thousand combinations, just change the Part to 2 in the settings and click OK. The script will run a test for the next batch.
* Repeat this process by increasing the Part number (`3`, 4, 5...), until you reach the last available part.
* Where can I see the total number of parts? In the information row below the results table, you will find Total parts. This will help you figure out how many more tests are left to run.
Step 4: Analyze the Results in the Table
The results table is your main decision—making tool. It displays the best strategies found, sorted by the criteria you have chosen.
1. Study the performance metrics:
* Rating: Position in the rating.
* Profit %: Net profit as a percentage of the initial capital.
* Drawdown%: The maximum drawdown of the deposit for the entire test period.
* Max Length: The maximum duration of one transaction in days, hours and minutes.
* Trades: The total number of completed trades.
2. Examine the winning parameters:
* To the right of the performance metrics are columns showing the exact settings that led to this result ('SO Count`, SO Step, TP (%), etc.).
3. How to choose the best strategy?
* Don't chase after the maximum profit! The strategy with the highest profit often has the highest drawdown, which makes it extremely risky.
* Seek a balance. The ideal strategy is a compromise between high profitability, low drawdown (Drawdown) and the maximum length of trades acceptable to you (Max Length).
* finalScore was created to find this balance. Trust him — he often highlights not the most profitable, but the most stable and reliable options.
Detailed Description Of The Settings
This section serves as a complete reference for each parameter available in the script settings. The parameters are grouped in the same way as in the indicator interface for your convenience.
Group: ⚙️ Optimization Settings ⚙️
The main parameters governing the testing process are collected here.
* `Enable Optimizer': The main switch. Activates or deactivates all backtesting functionality.
* `Direction': Determines which way trades will be opened during the simulation.
* Long: Shopping only.
* Short: Sales only.
* Both: Testing in both directions. Important: This mode only works in conjunction with an External Signal, as the script needs an external signal to determine the direction for each specific transaction.
* `Signal Mode`: Controls the conditions for starting a new trading cycle (opening a base order).
* No Signal: A new cycle starts immediately after the previous one is completed. This mode is used to test "pure" grid mechanics without reference to market conditions.
* External Signal: A new cycle begins only when a signal is received from an external indicator connected via the Signal field.
* `Signal': A field for connecting an external signal source (works only in the `External Signal` mode). You can select any other indicator on the chart.
* For Long** trades, the signal is considered received if the value of the external indicator ** is greater than 0.
* For Short** trades, the signal is considered received if the value of the external indicator ** is less than 0.
* `Bars Count': Sets the depth of the history in the bars for the backtest. The maximum value (25000) provides the most reliable results.
* `Sort by`: A key criterion for selecting and ranking the best strategies in the final table.
* FinalScore: Recommended mode. A comprehensive assessment that takes into account 9 metrics to find the most balanced and sustainable strategies.
* Profit: Sort by net profit.
* Drawdown: Sort by minimum drawdown.
* Max Length: Sort by the minimum length of the longest transaction.
* `Combinations Count': Indicates how many of the best strategies (from 1 to 50) will be displayed in the results table.
* `Close last trade`: If this option is enabled, any active trade will be forcibly closed at the closing price of the last historical bar. For grid strategies, it is recommended to always enable this option in order to get the correct calculation of the final profit and eliminate grid strategies that have been stuck for a long time.
Group: 💰 Money Management Settings 💰
The parameters in this group determine the financial conditions of the simulation. Specify values that are as close as possible to your actual values in order to get reliable results.
* `Capital': The initial deposit amount for the simulation.
* `Leverage`: The leverage used to calculate the margin.
* `Slippage` (%): Simulates the difference between the expected and actual order execution price. The specified percentage will be applied to each transaction.
* `Commission` (%): The trading commission of your exchange as a percentage. It is charged at the execution of each order (both at opening and closing).
* `Liquidation Level' (%): Maintenance Margin Ratio. This is a critical parameter for a realistic test. Liquidation in the simulator occurs if the Equity of the account (Capital + Unrealized P&L) falls below the level of the supporting margin.
Group: 🛠 Optimization Parameters 🛠
This is the "heart" of the optimizer, where you set ranges for iterating through the grid parameters.
* `Part`: The portion number of the combinations to be tested. Start with 1, and then increment (`2`, 3, ...) sequentially to check all generated strategies.
* `Combinations in Part': The number of backtests performed at a time (in one "Part"). Increasing the value may speed up the process, but it may cause the script to error due to platform limitations. If an error occurs, it is recommended to switch to the step below and back.
Three fields are available for each of the following parameters (`SO Count`, SO Step, SO Multiplier, etc.):
* `Min`: Minimum value for testing.
* `Max': The maximum value for testing.
* `Step`: The step with which the values in the range from Min to Max will be iterated over.
There is also a checkbox for each parameter. If it is enabled, the parameter will be optimized in the specified range. If disabled, only one value specified in the Min field will be used for all tests.
* 'Stop Loss': In addition to the standard settings Min, Max, Step, it has an additional parameter:
* `Type`: Defines how the stop loss price is calculated.
* From entry point: The SL level is calculated once from the entry price (base order price).
* From breakeven line: The SL level is dynamically recalculated from the average position price after each new safety order is executed.
Group: ⚡️Filters⚡️
Filters allow you to filter out those results from the final table that do not meet your minimum requirements.
For each filter (`Max Profit`, Min Drawdown, `Min Trade Length`), you can:
1. Turn it on or off using the checkbox.
2. Select the comparison condition: Greater (More) or Less (Less).
3. Set a threshold value.
*Example:* If you set Less and 20 for the Min Drawdown filter, only those strategies with a maximum drawdown of less than 20% will be included in the final table.
Group: 🎨 Visual Settings 🎨
Here you can customize the appearance of the results table.
* `Position': Selects the position of the table on the screen (for example, Bottom Left — bottom left).
* `Font Size': The size of the text in the table.
* `Header Background / Data Background`: Background colors for the header and data cells.
* `Header Font Color / Data Font Color`: Text colors for the header and data cells.
Important Notes and Limitations
So that you can use the Autoback Grid Lab as efficiently and consciously as possible, please familiarize yourself with the following key features of its work.
1. It is a Tool for Analysis, not for Signals
It is extremely important to understand that this script does not generate trading signals in real time. Its sole purpose is to conduct in—depth research (**backtesting**) on historical data.
* The results you see in the table are a report on how a particular strategy would have worked in the past.
* The script does not provide alerts and does not draw entry/exit points on the chart for the current market situation.
* Your task is to take the best sets of parameters found during optimization and use them in your real trading, for example, when setting up a trading bot or in a manual trading system.
2. Features Of Calculations (This is not a "Repainting")
You will notice that the results table appears and is updated only once — when all historical bars on the chart are loaded. It does not change in real time with each tick of the price.
This is correct and intentional behavior.:
* To test thousands, and sometimes millions of combinations, the script needs to perform a huge amount of calculations. In the Pine Script™ environment, it is technically possible to do this only once, at the very last bar in history.
* The script does not show false historical signals, which then disappear or change. It provides a static report on the results of the simulation, which remains unchanged for a specific historical period.
3. Past Results do not Guarantee Future Results.
This is the golden rule of trading, and it fully applies to the results of backtesting. Successful strategy performance in the past is not a guarantee that it will be as profitable in the future. Market conditions, volatility and trends are constantly changing.
My tool, especially when sorting by finalScore, is aimed at finding statistically stable and reliable strategies to increase the likelihood of their success in the future. However, it is a tool for managing probabilities, not a crystal ball for predicting the future. Always use proper risk management.
4. Dependence on the Quality and Depth of the Story
The reliability of the results directly depends on the quantity and quality of the historical data on which the test was conducted.
* Always strive to use the maximum number of bars available (`Bars Count: 25,000`) so that your strategy is tested on different market cycles (rise, fall, flat).
* The results obtained on data for one month may differ dramatically from the results obtained on data for two years. The longer the testing period, the higher the confidence in the parameters found.
Conclusion
The Autoback Grid Lab is your personal research laboratory, designed to replace intuitive guesses and endless manual selection of settings with a systematic, data—driven approach. Experiment with different assets, timeframes, and settings ranges to find the unique combinations that best suit your trading style.

Anchored Grids ft. VolumeINTRO
The 'Volume Profile' is a great tool, isn’t it? It shows us where volume has accumulated on the chart and helps guide trading decisions. The only catch is that we can’t really choose the levels—it’s all based on where volume happens to cluster. But what if we reversed the logic and measured the volume at the levels we define? That’s exactly what this script does, giving you a fresh way to spot support and resistance :)
OVERVIEW
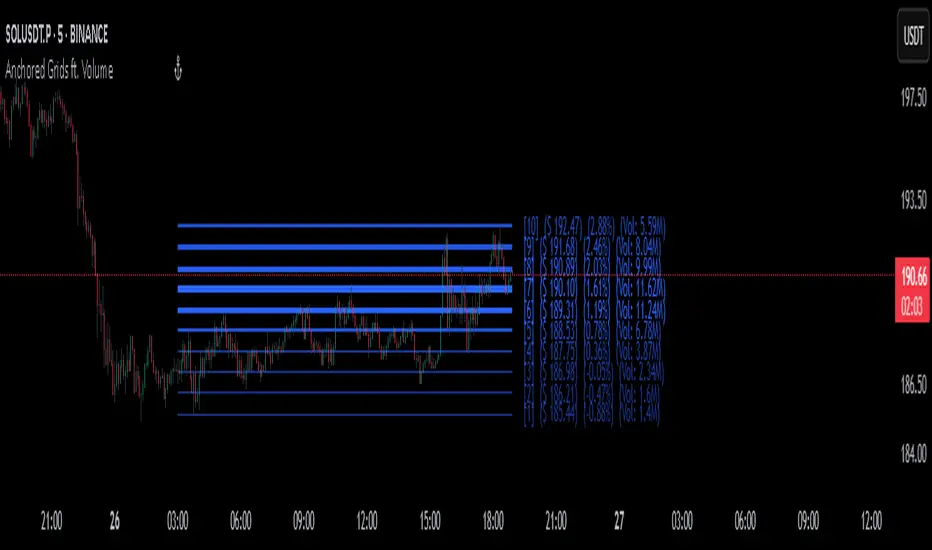
'Anchored Grids ft. Volume' is a sophisticated technical analysis tool that combines price grid analysis with volume accumulation metrics. This indicator dynamically calculates and displays custom support and resistance levels based on a user-defined timeframe, while simultaneously tracking and visualizing volume accumulation at each specific price level. Unlike traditional volume profile indicators that use complex statistical clustering, this tool provides straightforward volume measurement at predetermined technical levels. It answers a critical question: "How much trading activity occurred near the key price levels I care about?".
HOW DOES THIS INDICATOR WORK?
This indicator builds a customizable grid system anchored to the opening price of any user-selected timeframe (hourly, daily, weekly, etc.). From that anchor point, it continuously tracks the highest high and lowest low, then calculates equidistant grid levels within that range. Two calculation modes are available—Arithmetic and Geometric—allowing flexibility in how the levels are distributed.
Once the grid is established, a volume accumulation engine comes into play. For each price bar, the script checks whether the bar’s range intersects with any level’s tolerance zone (default 0.01%). If a touch is detected, that bar’s volume is added to the corresponding level. Over time, this process builds a clear picture of where significant trading activity has clustered.
The visualization system highlights these dynamics by applying a color gradient based on volume intensity and adjusting line thickness proportional to accumulated volume. Each level is also labeled with four key data points:
The grid number (in square brackets)
The price of the level
The percentage distance between the level and the opening price of the selected timeframe
The total volume accumulated within the level’s tolerance range
PARAMETERS
Timeframe: Defines the anchor period for grid calculation. Then, the indicator automatically determines the open, high, and low prices.
Mode: This option determines how the distance between levels is calculated: Arithmetic (linear) means equal price spacing between levels, while Geometric (logarithmic) means equal percentage spacing between levels.
Grids: It's the number of levels between high and low.
Color: Base color for grid lines and labels. When volume data is displayed, lower values are darkened by 50%.
Show Volume Accumulation: When this parameter is activated, the volume calculation is enabled.
Tolerance : The Tolerance parameter (default range: 0.01%) defines the price range around each grid level where volume accumulation is registered. It acts as a sensitivity control that determines how close price must be to a level to count trading volume toward that level's accumulation.
ORIGINALITY
It’s possible to find comprehensive grid-drawing tools among community indicators, but I haven’t come across an example that combines this concept with volume data. More importantly, I wanted to demonstrate how volume accumulation can be generated for any data modeled as an array on the chart by developers.
SUMMARY
In conclusion, the selected timeframe and the number of grids are only used as a reference to determine where the levels are drawn. The true value of this indicator lies in its ability to calculate volume accumulation directly from the chart’s own candles, showing how much trading activity occurred around each level. The result is a hybrid framework that merges structural price analysis with volume distribution, offering traders deeper insights into where markets are likely to react.
NOTE
While powerful, this tool should be used as part of a comprehensive trading strategy rather than as a standalone system. Always combine with risk management principles and market context awareness. I hope it helps everyone. Trade as safely as possible. Best of luck!
Multi Channel GRID & DCA LTF [trade_lexx]Multi Channel GRID & DCA LTF
Usage Guide
Part 1: The concept and general possibilities of the "Multi Channel GRID & DCA LTF" strategy
Introduction
Welcome to the guide to "Multi Channel GRID & DCA LTF", a powerful and versatile automated trading strategy for the TradingView platform. This tool was developed for traders who are looking for flexibility, control and a high degree of adaptability to various market conditions.
The strategy is based on a hybrid approach that combines two popular and time-tested techniques.:
1. GRID (grid trading): The classic method of averaging a position is by placing a grid of limit orders.
2. DCA (Dollar Cost averaging): Smart position averaging based on signals from external indicators.
However, "Multi Channel GRID & DCA LTF" goes far beyond the simple combination of these two techniques. The strategy includes a number of unique and innovative features, such as cascading MultiGRID grids for dealing with extreme volatility, Channel Mode range trading mode for profiting from sideways movement, and Low Time Frame analysis (LTF) to achieve surgical accuracy in backtesting. Deep customization options for risk management, capital, take profits, and stop losses allow you to configure a strategy for almost any trading style, asset, and timeframe.
The basic idea: How does it work?
Let's take a detailed look at each of the key concepts embedded in the logic of the strategy.
1. GRID — Automatic placement of buy and sell orders at certain price intervals.
This is a fundamental mode of operation. Its main goal is to systematically improve the average entry price for a position if the market is going against you.
* The principle of operation: After opening the base (first) order (`BO`), the strategy automatically places a series of pending limit orders (here they are called "safety orders" or "SO") at certain price intervals. For a long position, orders are placed below the entry price, and for a short position, orders are placed higher.
* Target: When the price moves against an open position, it consistently hits and executes safety orders. Each such execution adds additional volume to the position at a more favorable price, thereby shifting the overall average entry price (`position_avg_price') closer to the current market price. This means that a much smaller corrective movement will be required to gain ground.
* Flexibility: You have full control over the geometry of the grid: the number of safety orders, the percentage distance between them (`SO Step`), and you can even set a coefficient that will increase this step for each subsequent order (`SO Multiplier`), creating an expanding grid.
2. DCA (Signal Averaging) — Smart Averaging
This mode adds an additional layer of analysis to the averaging process. Instead of just buying/selling at the set price levels, the strategy waits for a confirmation signal.
* Working principle: You can connect any external indicator (for example, RSI, CCI, or even your own complex signal system) to the strategy, which outputs numerical values. As standard, 1 is used for a long signal, and -1 is used for a short signal. The strategy will place the next averaging order only at the moment when it receives the appropriate signal.
* Goal: To average a position not just during a fall (or a rise for a short), but at the moments that your main trading system considers the most favorable for this. This allows you to avoid "catching falling knives" and enter only if there are good reasons.
3. Hybrid Mode (GRID+DCA) is the best of the previous two modes
This mode is designed for maximum filtering and control. It requires two conditions to be fulfilled simultaneously.
* Working principle: The safety order will be executed only if the price has reached the calculated grid level and a confirmation signal has been received from your external indicator. If a confirmation signal is received from an external indicator, the next calculated grid level activates the limit order.
* Goal: To create the most reliable averaging system that protects against premature entries and requires double confirmation (both by price and indicator) before increasing the position size.
4. MultiGRID — Adaptation to extreme volatility
This is one of the most powerful and unique features of a strategy designed to survive and make a profit in the face of strong, protracted trends or "black swans".
* The problem it solves: The usual grid of orders has a limited depth. If the price goes beyond the last safety order, the strategy loses the opportunity to average and becomes vulnerable.
* The principle of operation: The MultiGRID function allows you to create "cascades" — several grids following one another. When all the orders of the first grid are executed, the strategy does not stop. Instead, she can activate the second, third (and so on) a grid of orders. The new grid can be activated by one of two triggers:
1. Offset: The new grid is activated when the price passes another set percentage deviation from the last executed order.
2. Signal: The new grid is activated when a signal is received from an external indicator.
* Goal: To significantly expand the working range of the strategy. This allows it to adapt to strong market movements that would "break" the usual grid, and continue to effectively average a position at a much greater depth of decline or growth.
5. Channel Mode — Trading in the range
This feature turns a standard averaging strategy into a machine for "farming" profits within a price channel that is formed during a sideways market movement.
* The problem it solves: In the standard grid strategy, after partially closing a take profit position, the volume of this part "leaves" the trade until the deal is fully closed. You are missing the opportunity to reuse this capital.
* Operating principle: When Channel Mode is enabled, the following happens. Suppose the price went against you, executed several safety orders, and then turned around and reached one of the partial take profits. At this point, the strategy is:
1. Fixes the profit, as it should be.
2. Instantly places a new limit order to buy (or sell for a short) at exactly the same price level where the last triggered safety order was executed. The volume of this order is equal to the volume of the part that was just closed for take profit.
3. If the price goes down again and executes this "repeat" order, the strategy immediately sets a corresponding take profit for it at the level where the previous profit was taken.
* Goal: To create a continuous buy-sell cycle within the local range (channel). The lower limit of the channel is the price of the last averaging, and the upper limit is the price of a partial take profit. This allows you to repeatedly profit from sideways price fluctuations, without waiting for the full closure of the main, large transaction.
6. LTF (Lower Timeframe Analysis) — Surgical precision of backtesting
This feature is critically important for obtaining reliable results during historical testing (backtesting) of grid strategies.
* The problem it solves: The standard testing mechanism in TradingView has a serious limitation. Working, for example, on a 4-hour chart, he sees only 4 candle points: Open, High, Low and Close. He does not know in what order the price moved within these 4 hours. He could have touched High first and then Low, or vice versa. For grid strategies, this is fatal — the engine can show that a take profit has been executed, although in reality the price first went down, collected the entire grid of orders and only then turned around.
* How it works: When you turn on the LTF mode, the strategy for each candle on your main chart (for example, 4H) requests and analyzes all candles from the lower timeframe you specified (for example, 1-minute). Then it virtually trades the entire price path for these minute candles, executing orders, take profits and stop losses in the sequence in which they would occur in reality. It works in the single take profit mode of the Grid strategy.
* Goal: To provide the most realistic and reliable backtest that reflects the real dynamics of the market. This allows you to avoid false expectations and accurately assess the potential performance of the strategy.
// ------------------------
Part 2: Detailed description of the strategy settings
This section is your main guide to all the switches and options available in the strategy. Understanding each setting is the key to unlocking the full potential of this powerful tool.
1. 🛡️ Risk Management 🛡️
This group contains fundamental parameters that determine the basic logic of risk management and the geometry of grid orders.
* Strategy type: Determines the direction of transactions.
* Long: The strategy will only open long positions (buy).
* Short: The strategy will only open short positions (sell).
* Both: The strategy will work both ways, opening long or short depending on the incoming signal.
* SO Count: Sets the maximum number of Safety (averaging) Orders (SO) that the strategy will place within the same grid. If you have MultiGRID enabled, this number applies to each individual grid.
* SO Step (%): This is the base percentage deviation from the entry price at which the first safety order will be placed. For example, at a value of 0.5, the first SO in a long trade will be placed 0.5% lower than the opening price of the base order.
* SO Multiplier: A coefficient that exponentially increases the step for each subsequent safety order. This allows you to create an expanding grid where averaging orders are placed further and further apart, which is effective with strong and accelerating price movements.
* *The step formula for the nth order*: Step(N) = (SO Step) * (SO Multiplier ^(N-1)).
* If the value is 1, all steps will be the same.
* With a value of 1.6, the step of the second SO will be 1.6 times larger than the first, the step of the third will be 1.6 times larger than the second, and so on.
* 1️⃣ TP/SL: These are simplified settings for quick configuration. They allow you to turn on/off the main take profit and stop loss and set basic percentage values for them. More detailed settings for these parameters can be found in the relevant sections below.
// ------------------------
2. 💰 Money Management 💰
Everything related to position size, leverage, and capital is configured here.
* Volume BO (Base Order): Determines the size of the trade's opening order.
* Volume BO: A fixed amount in the quote currency (for example, in USDT).
* USDT (check mark): Manages the information in the comments to the orders. If enabled, the volume of orders in USDT will be displayed in the comments. This is convenient for visual analysis and for sending the amount of USDT by the placeholder {{strategy.order.comment}} via webhooks when connecting the strategy to the exchange or trading terminals.
* or % of deposit: The amount calculated as a percentage of the available capital of the strategy. The check mark to the right of this field enables this mode. Important: using a percentage activates the effect of compounding (compound interest), as the amount of each new transaction will be automatically recalculated based on the current capital (initial capital + profit/loss). If enabled, the percentage of orders will be displayed in the comments. This is convenient for visual analysis and for sending percentages on the placeholder {{strategy.order.comment}} via webhooks when connecting the strategy to the stock exchange, trading terminals, or creating Copy trading.
* Martingale: The coefficient applied to the volume of orders. It increases the size of each subsequent insurance order compared to the base one.
* Volume formula for the nth SO: Volume SO (N) = (Volume BO) * (Martingale^N).
* With a value of 1.2, the volume of the first SO will be 1.2 times greater than the base, the second — 1.44 times (`1.2 * 1.2`) and so on.
* Leverage: Specify the size of your leverage. This parameter is used exclusively for calculating and displaying the approximate liquidation price. It does not affect the size of positions, but it helps to visually assess the risks.
* Liquidation: Enables or disables the calculation and display of the liquidation line on the chart.
* Margin type: Allows you to select a method for calculating the liquidation price, simulating the logic of exchanges:
* Isolated: The liquidation price is calculated based on the size and leverage of the current open position only.
* Cross: The calculation simulates using the entire available balance to maintain a position. In the strategy, the liquidation price is calculated as the level at which the loss on the current transaction is equal to the current capital.
* Commission (%): Specify the percentage of your exchange's commission per transaction. The correct value of this parameter is crucial for obtaining realistic backtest results.
// ------------------------
3. 🕸️ Grid Management 🕸️
This group is responsible for the logic of safety orders and advanced mechanics such as Channel Mode and MultiGRID.
* SO Type: Defines the logic of placing averaging orders.
* GRID: Classic grid. All safety orders are placed in advance as limit orders.
* DCA: Signal averaging. The strategy is waiting for a signal from an external indicator to place a market averaging order.
* GRID+DCA: Hybrid. The strategy waits for a signal, and if it arrives, places a limit order at the appropriate price level of the grid or executes a market order if the signal has arrived below the limit order level.
* Signal for SO: A data source (indicator) that will be used for signals in DCA and GRID+DCA modes.
* ↔️ Channel Mode: When this option is enabled, the strategy tries to trade in a sideways range. After partially closing a take profit position, it immediately places a limit order for re-entry at the price of the last triggered safety order. This creates a buy-sell cycle within the local channel.
* Best Price Only: This filter adds an additional condition for averaging in DCA and MultiGRID modes (when it operates on a signal). The next averaging order or a new grid will be activated only if the current price is more favorable (lower for long, higher for short) than the price of the previous entry.
* 🧩 MultiGRID ⮕ Enables cascading grid mode.
* Grid Count: The total number of grids that can be activated sequentially.
* Offset: Percentage deviation from the price of the last order of the previous grid. When this margin is reached, the following grid of orders is activated (this mode does not require a signal).
* Or signal: Allows you to use the signal from an external indicator as a trigger to activate the next grid. The checkmark on the right turns on this mode.
// ------------------------
4. 🎯 Entry and Stop 🎯
This group of settings allows you to fine-tune the conditions for starting a new trade and all aspects related to protective stop orders, including the complex mechanics of trailing and managing SL after partial take profits.
* 🎯 Signal: A data source (indicator) that will be used to determine when to enter a trade. The strategy expects a value of 1 for the start of a long trade and -1 for a short trade.
* Min Bars: Sets the minimum number of candles that must pass from the moment of opening the previous trade to the moment of opening the next one. A value of 0 disables this filter. This is a useful tool to prevent overly frequent entries in a "noisy" market.
* Non-stop: If this option is enabled, the strategy ignores the Entry Signal and opens a new trade immediately after closing the previous one (taking into account the Min Bars filter, if it is set). This turns the strategy into a constantly working mechanism that is always on the market.
* 🛑 SL Type: Defines the base price from which the stop loss percentage will be calculated. The stop loss in the first section must be enabled for this block of settings to work.
* From the entry point: SL is always calculated from the opening price of the very first base order. It remains static throughout the entire transaction unless it is moved by other functions.
* From breakeven line: SL is dynamically recalculated and shifted each time a safety order is executed. It always follows the average price of the position, being at a given percentage distance from it.
* From last executed SO: SL is recalculated from the price of the last executed order, whether it is a base or a safety order.
* From last SO: SL is calculated from the price of the most recent possible safety order in the grid. This is usually the most remote and conservative type of SL.
* Trailing SL Type: Defines the algorithm by which the stop loss will move after its activation.
* Standard: Classic trailing. After activation, SL will follow the price at a fixed distance.
* ATR: SL will follow the price at a distance equal to the value of the ATR indicator multiplied by the specified multiplier.
* External Source: SL will follow any selected line of the third-party indicator.
* Period and Multiplier: Common parameters for all types of trailing.
* Source: The source of the line for the trailing SL of the third-party indicator.
* Trailing SL after entry: The mode of activation of the trailing SL after entering the transaction
* SL management after TP (sections 1️⃣, 2️⃣, 3️⃣): These three blocks allow you to create a complex stop loss management logic as profits are recorded.
For each take profit level (TP1, TP2, TP3), you can configure:
* SL BE / SL TP1 / SL TP2: When the corresponding TP is reached, the stop loss will be moved to the breakeven point (for TP1), to the TP1 price level (for TP2) or to the TP2 price level (for TP3).
* Trailing SL: When the corresponding TP is reached, the trailing stop loss is activated according to the settings above.
* By ↔️ Signal: A very powerful option. If it is enabled, the above action (SL transfer or trailing activation) will occur when the opposite trading signal is received from an external indicator. This allows you to protect profits or reduce losses if the market turns sharply, even before reaching the target.
* SL Delay ⮕ Allows you to delay the activation of the stop loss.
* Number of Bars: The Stop loss will be physically placed on the market only after the specified number of candles has passed since entering the trade. This can help to avoid "taking out" the stop with a random short movement (squiz) immediately after opening a position.
* SL Block: Unique defensive mechanics for trading both ways (`Strategy Type: Both`).
* Number of SL: If the strategy receives the specified number of stop losses in a row in one direction (for example, 2 stops long), it temporarily blocks the opportunity to open new trades in that direction.
* Lock Reset mode:
* By direction: The lock is lifted if a profitable trade is closed in the allowed direction or if a stop loss is triggered in the opposite direction.
* First profit: The lock is lifted after closing any profitable transaction, regardless of its direction.
// ------------------------
5. ✅ Take Profit ✅
This group of settings provides comprehensive control over profit taking, from a simple take profit to a complex system of partial closures and trailing.
* ✅ TP Type: Defines the base price for calculating the percentage deviation of the take profit.
* From entry point: TP is calculated from the base order price.
* From breakeven line: TP dynamically follows the average position price.
* From last executed SO: TP is calculated from the price of the last executed order.
* Filters for closing on signal
* Only ➕: If TP is triggered by a signal, the deal will be closed only if it is in the black relative to the average price.
* Or >TP: If TP is triggered by a signal, the trade will be closed only if the closing price is better than (or equal to) the estimated price of this TP.
* TP type of trailing: Yes, take profit has a trailing too! It works differently than the SL trailing.
* Standard / ATR: After the price touches the "virtual" TP level, the trailing is activated. He does not place a stop order, but begins to move away from the price, dynamically moving the limit order to close further and further in the profitable direction, allowing him to collect the maximum from the impulse movement.
* External Source: TP will follow any selected line of the third-party indicator.
* Period and Multiplier: Parameters for calculating the trailing margin TP.
* Source: The source of the line for the trailing TP of the third-party indicator.
* TP level settings (sections 1️⃣, 2️⃣, 3️⃣, 4️⃣): The strategy supports up to four independent take profit levels, which allows for a flexible system of partial commits.
For each level, you can set:
* TP: Enable the level and set its percentage deviation from the base price.
* Size: What percentage of the current position will be closed when this level is reached. For the last active TP, this parameter is ignored, and 100% of the remaining position is closed.
* Trailing TP: Enable the above-described trailing mechanism for this particular level.
* Signal: Enable closing based on the signal from the external indicator for this level.
* Or take: If both the closing on the signal and the limit order are enabled, then whatever comes first will work.
* After SO: Activate this TP level only after the specified number of safety orders has been executed. This allows you to set closer targets for riskier (deeply averaged) positions.
// ------------------------
6. 🔬 GRID and MultiGrid Analysis on Lower TFs (LTF) 🔬
This group activates one of the most important functions for accurate testing of grid strategies.
* Enable LTF Calculation ⮕ The main switch of the analysis mode on the lower timeframes.
* Timeframe selection: A drop-down list where you can select a timeframe for detailed analysis. For example, if your main schedule is 1 hour, you can select 1 minute here. The strategy will emulate the trading of minute candles within each hour candle.
❗️Important: As mentioned in the first part, the use of this mode is critically necessary to obtain realistic backtest results, especially for strategies with a dense grid of orders. Without it, the results may be overly optimistic and not reflect the real dynamics of the market. It should be remembered that TradingView imposes a limit on the number of intra-bars (minor TF bars) that can be requested. This is usually about 100,000 bars.
// ------------------------
7. 🕘 Backtest Date Range 🕘
This group allows you to focus testing on a specific historical period.
* Limit Date Range: Enables date filtering.
* Start time: The date and time when the strategy will start analyzing and opening deals.
* End time: The date and time after which the strategy will stop opening new deals and complete testing.
// ------------------------
8. 🎨 Visualization 🎨
All the options responsible for the appearance and information content of the chart are collected here.
* Show PnL labels: Enables/disables the display of text labels with the result (profit/loss) after closing each trade.
* Statistics Table: Enables/disables the main dashboard with detailed statistics on the results of the backtest.
* Strategy Settings Table: Enables/disables an additional panel that summarizes all the key parameters of the current configuration.
* Monthly Profit Table: Enables/disables a table with a breakdown of percentage returns by month and year.
* Table settings: For each of the three tables, you can individually adjust the Text size and Table Position on the screen to position them as conveniently as possible.
* Decimal places: Defines how many decimal places will be displayed in numeric values in tables and on labels.
// ------------------------
9. ✉️ Webhook Settings ✉️
This group is intended for traders who want to automate trading on strategy signals using third-party services and exchanges (for example, 3Commas, WunderTrading, Cryptorobotics, Cryptohopper, Bitsgap, Binance, ByBit, OKX, Pionex, Bitget or proprietary solutions).
For each key event in the strategy, there is a separate switch and a text field:
* Webhook for Open: Enable and set a message for the webhook that will be sent when the base order is opened.
* Webhook for Averaging: A message sent when executing any insurance order.
* Webhook for Take Profit: A message sent when closing on take profit (including partial ones).
* Webhook for Stop-Loss: A message sent when a stop loss is closed.
You can insert a JSON code or any other message format that your service requires for automation into the text fields. The strategy supports special placeholders (for example, `{{strategy.order.alert_message}}`), which allow you to dynamically insert the necessary data into the message, such as the amount of USDT or the percentage of the deposit for entry, averaging and take profit orders.

EMA Grid + Martingale Strategy (Long-Only) with CooldownTitle:
EMA Grid + Martingale Strategy (Long-Only) with Cooldown
Short Summary:
A long-only strategy combining EMA trend filters, grid-based entries, optional martingale sizing, and a cooldown feature to manage position timing and exits.
Full Description:
This strategy uses a 4-EMA trend confirmation system to detect bullish momentum, then deploys a grid-style entry method with optional martingale position sizing. It includes a cooldown mechanism to prevent reentry too soon after a completed trade cycle.
How It Works
1. Trend Confirmation: Two EMA groups (fast/slow) determine whether market conditions are bullish.
2. Initial Entry: A new position is entered when both EMA groups confirm an uptrend and no position is currently active.
3. Grid Entries: Additional long entries are placed when price drops by a defined pip distance from the last entry, respecting the maximum number of entries.
4. Martingale Sizing (Optional): Grid orders can increase in size with each level using a customizable multiplier.
5. Weighted-Average Exit: All positions close once price reaches or exceeds the average entry price plus a buffer.
6. Cooldown Timer: After closing a position set, the strategy waits a defined number of bars before opening a new grid.
Key Features
• 4 customizable EMAs for trend confirmation.
• Dynamic grid-style long entries based on pip intervals.
• Optional martingale-style position sizing.
• Weighted-average price exit logic with buffer control.
• Cooldown bar period to limit overtrading.
• Suitable for optimization and backtesting with full control over inputs.
Use Cases
• Designed for trending markets where pullbacks present entry opportunities.
• Helps manage staged entries while avoiding premature reentry.
• Ideal for testing martingale and grid-based strategies with exit precision.
Note: This strategy is for testing and educational purposes only. It does not guarantee profits and is not financial advice.

Buy The Dip - ENGThis script implements a grid trading strategy for long positions in the USDT market. The core idea is to place a series of buy limit orders at progressively lower prices below an initial entry point, aiming to lower the average entry price as the price drops. It then aims to exit the entire position when the price rises a certain percentage above the average entry price.
Here's a detailed breakdown:
1. Strategy Setup (`strategy` function):
`'거미줄 자동매매 250227'`: The name of the strategy.
`overlay = true`: Draws plots and labels directly on the main price chart.
`pyramiding = 15`: Allows up to 15 entries in the same direction (long). This is essential for grid trading, as it needs to open multiple buy orders.
`initial_capital = 600`: Sets the starting capital for backtesting to 600 USDT.
`currency = currency.USDT`: Specifies the account currency as USDT.
`margin_long/short = 0`: Doesn't define specific margin requirements (might imply spot trading logic or rely on exchange defaults if used live).
`calc_on_order_fills = false`: Strategy calculations happen on each bar's close, not just when orders fill.
2. Inputs (`input`):
Core Settings:
`lev`: Leverage (default 10x). Used to calculate position sizes.
`Investment Percentage %`: Percentage of total capital to allocate to the initial grid (default 80%).
`final entry Percentage %`: Percentage of the *remaining* capital (100 - `Investment Percentage %`) to use for the "semifinal" entry (default 50%). The rest goes to the "final" entry.
`Price Adjustment Length`: Lookback period (default 4 bars) to determine the initial `maxPrice`.
`price range`: The total percentage range downwards from `maxPrice` where the grid orders will be placed (default -10%, meaning 10% down).
`tp`: Take profit percentage above the average entry price (default 0.45%).
`semifinal entry price percent`: Percentage drop from `maxPrice` to trigger the "semifinal" larger entry (default -12%).
`final entry price percent`: Percentage drop from `maxPrice` to trigger the "final" larger entry (default -15%).
Rounding & Display:
`roundprice`, `round`: Decimal places for rounding price and quantity calculations.
`texts`, `label_style`: User interface preferences for text size and label appearance on the chart.
Time Filter:
`startTime`, `endTime`: Defines the date range for the backtest.
3. Calculations & Grid Setup:
`maxPrice`: The highest price point for the grid setup. Calculated as the lowest low of the previous `len` bars only if no trades are open. If trades are open, it uses the entry price of the very first order placed in the current sequence (`strategy.opentrades.entry_price(0)`).
`minPrice`: The lowest price point for the grid, calculated based on `maxPrice` and `range1`.
`totalCapital`: The amount of capital (considering leverage and `per1`) allocated for the main grid orders.
`coinRatios`: An array ` `. This defines the *relative* size ratio for each of the 11 grid orders. Later orders (at lower prices) will be progressively larger.
`totalRatio`: The sum of all ratios (66).
`positionSizes`: An array calculated based on `totalCapital` and `coinRatios`. It determines the actual quantity (size) for each of the 11 grid orders.
4. Order Placement Logic (`strategy.entry`):
Initial Grid Orders:
Runs only if within the specified time range and no position is currently open (`strategy.opentrades == 0`).
A loop places 11 limit buy orders (`Buy 1` to `Buy 11`).
Prices are calculated linearly between `maxPrice` and `minPrice`.
Order sizes are taken from the `positionSizes` array.
Semifinal & Final Entries:
Two additional, larger limit buy orders are placed simultaneously with the grid orders:
`semifinal entry`: At `maxPrice * (1 - semifinal / 100)`. Size is based on `per2`% of the capital *not* used by the main grid (`1 - per1`).
`final entry`: At `maxPrice * (1 - final / 100)`. Size is based on the remaining capital (`1 - per2`% of the unused portion).
5. Visualization (`line.new`, `label.new`, `plot`, `plotshape`, `plotchar`):
Grid Lines & Labels:
When a position is open (`strategy.opentrades > 0`), horizontal lines and labels are drawn for each of the 11 grid order prices and the "final" entry price.
Lines extend from the bar where the *first* entry occurred.
Labels show the price and planned size for each level.
Dynamic Coloring: If the price drops below a grid level, the corresponding line turns green, and the label color changes, visually indicating that the level has been reached or filled.
Plotted Lines:
`maxPrice` (initial high point for the grid).
`strategy.position_avg_price` (current average entry price of the open position, shown in red).
Target Profit Price (`strategy.position_avg_price * (1 + tp / 100)`, shown in green).
Markers:
A flag marks the `startTime`.
A rocket icon (`🚀`) appears below the bar where the `final entry` triggers.
A stop icon (`🛑`) appears below the bar where the `semifinal entry` triggers.
6. Exit Logic (`strategy.exit`, `strategy.entry` with `qty=0`):
Main Take Profit (`Full Exit`):
Uses `strategy.entry('Full Exit', strategy.short, qty = 0, limit = target2)`. This places a limit order to close the entire position (`qty=0`) at the calculated take profit level (`target2 = avgPrice * (1 + tp / 100)`). Note: Using `strategy.entry` with `strategy.short` and `qty=0` is a way to close a long position, though `strategy.exit` is often clearer. This exit seems intended to apply whenever any part of the grid position is open.
First Order Trailing Stop (`1st order Full Exit`):
Conditional: Only active if `trail` input is true AND the *last* order filled was "Buy 1" (meaning only the very first grid level was entered).
Uses `strategy.exit` with `trail_points` and `trail_offset` based on ATR values to implement a trailing stop loss/profit mechanism for this specific scenario.
This trailing stop order is cancelled (`strategy.cancel`) if any subsequent grid orders ("Buy 2", etc.) are filled.
Final/Semifinal Take Profit (`final Full Exit`):
Conditional: Only active if more than 11 entries have occurred (meaning either the "semifinal" or "final" entry must have triggered).
Uses `strategy.exit` to place a limit order to close the entire position at the take profit level (`target3 = avgPrice * (1 + tp / 100)`).
7. Information Display (Tables & UI Label):
`statsTable` (Top Right):
A comprehensive table displaying grouped information:
Market Info (Entry Point, Current Price)
Position Info (Avg Price, Target Price, Unrealized PNL $, Unrealized PNL %, Position Size, Position Value)
Strategy Performance (Realized PNL $, Realized PNL %, Initial/Total Balance, MDD, APY, Daily Profit %)
Trade Statistics (Trade Count, Wins/Losses, Win Rate, Cumulative Profit)
`buyAvgTable` (Bottom Left):
* Shows the *theoretical* entry price and average position price if trades were filled sequentially up to each `buy` level (buy1 to buy10). It uses hardcoded percentage drops (`buyper`, `avgper`) based on the initial `maxPrice` and `coinRatios`, not the dynamically changing actual average price.
`uiLabel` (Floating Label on Last Bar):
Updates only on the most recent bar (`barstate.islast`).
Provides real-time context when a position is open: Size, Avg Price, Current Price, Open PNL ($ and %), estimated % drop needed for the *next* theoretical buy (based on `ui_gridStep` input), % rise needed to hit TP, and estimated USDT profit at TP.
Shows "No Position" and basic balance/trade info otherwise.
In Summary:
This is a sophisticated long-only grid trading strategy. It aims to:
1. Define an entry range based on recent lows (`maxPrice`).
2. Place 11 scaled-in limit buy orders within a percentage range below `maxPrice`.
3. Place two additional, larger buy orders at deeper percentage drops (`semifinal`, `final`).
4. Calculate the average entry price as orders fill.
5. Exit the entire position for a small take profit (`tp`) above the average entry price.
6. Offer a conditional ATR trailing stop if only the first order fills.
7. Provide extensive visual feedback through lines, labels, icons, and detailed information tables/UI elements.
Keep in mind that grid strategies can perform well in ranging or slowly trending markets but can incur significant drawdowns if the price trends strongly against the position without sufficient retracements to hit the take profit. The leverage (`lev`) input significantly amplifies both potential profits and losses.

EMA Grid + Martingale Indicator (Long-Only)Title:
EMA Grid + Martingale Indicator (Long-Only)
Short Summary:
A 4-EMA trend filter combined with a grid-based entry system and optional martingale sizing to visualize staged long entries and exits in bullish markets.
Full Description:
This indicator combines a 4-EMA trend filter with a grid-based entry system and optional martingale-style position sizing to help traders visualize staged long entries and exits in trending markets.
How It Works
1. Trend Detection: Uses two sets of EMAs (fast/slow pairs) to confirm bullish momentum. A long signal is generated when both EMA groups align in an uptrend.
2. Grid Entries: After the initial long entry, additional grid levels are triggered every time price drops by the specified grid step (in pips).
3. Martingale Sizing (Optional): Each subsequent entry can increase in size based on the defined martingale factor.
4. Weighted-Average Exit: Calculates the weighted average of all grid entries and signals an exit when the price reaches or surpasses this level plus an optional buffer.
Key Features
• 4 EMA Trend Filter with fully customizable lengths.
• Dynamic grid entries with visual labels (L1, L2, etc.).
• Optional martingale position sizing.
• Weighted-average exit with adjustable buffer.
• Customizable parameters for EMAs, grid steps, max entries, and buffer pips.
• Clear chart visualization of EMAs and entry/exit levels.
Use Cases
• For traders using cost-averaging or grid strategies in bullish markets.
• Visualizes multiple entry levels and profit targets.
• Useful for backtesting and strategy planning.
Note: This indicator is for visualization and planning purposes only. It does not execute trades automatically. It does not guarantee profits and is not financial advice.
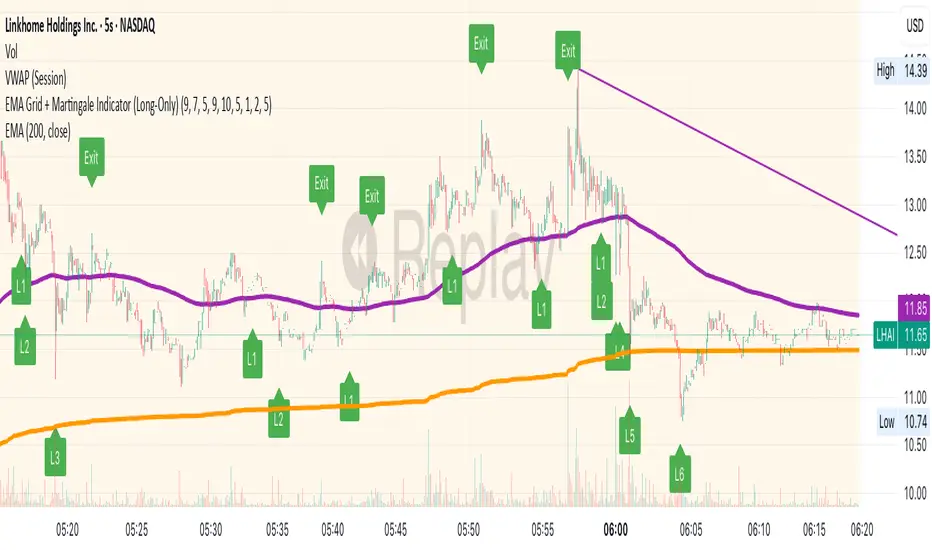
Internal Candle Strength [LuxAlgo]The Internal Candle Strength tool allows traders to divide each chart bar into multiple rows of custom size and inspect the strength of the lower timeframes trends located within each row.
This tool effectively helps traders in identifying the power dynamic between bulls and bears within multiple areas within each bar, providing the ability to conduct LTF analysis.
🔶 USAGE
The strength displayed within each row ranges from 0% to 100%, with 0% being the most bearish and 100% being the most bullish.
Traders should be aware of the extreme probabilities located at the higher/lower end of the bars, as this can signal a change in strength and price direction.
Traders can select the lower timeframe to pull the data from or the row size in the scale of the chart. Selecting a lower timeframe will provide more data to evaluate an area's strength.
Do note that only a timeframe lower than the chart timeframe should be selected.
🔹 Row Size
Selecting a smaller row size will increase the number of rows per bar, allowing for a more detailed analysis. A lower value will also generally mean that less data will be considered when calculating the strength of a specific area.
As we can see on the chart above (all BTCUSD 30m), by selecting a different row size, traders can control how many rows are displayed per bar.
🔶 SETTINGS
Timeframe: Lower timeframe used to calculate the candle strength.
Row Size: Size of each row on the chart scale, expressed as a fraction of the candle range.

TitanGrid L/S SuperEngineTitanGrid L/S SuperEngine
Experimental Trend-Aligned Grid Signal Engine for Long & Short Execution
🔹 Overview
TitanGrid is an advanced, real-time signal engine built around a tactical grid structure.
It manages Long and Short trades using trend-aligned entries, layered scaling, and partial exits.
Unlike traditional strategy() -based scripts, TitanGrid runs as an indicator() , but includes its own full internal simulation engine.
This allows it to track capital, equity, PnL, risk exposure, and trade performance bar-by-bar — effectively simulating a custom backtest, while remaining compatible with real-time alert-based execution systems.
The concept was born from the fusion of two prior systems:
Assassin’s Grid (grid-based execution and structure) + Super 8 (trend-filtering, smart capital logic), both developed under the AssassinsGrid framework.
🔹 Disclaimer
This is an experimental tool intended for research, testing, and educational use.
It does not provide guaranteed outcomes and should not be interpreted as financial advice.
Use with demo or simulated accounts before considering live deployment.
🔹 Execution Logic
Trend direction is filtered through a custom SuperTrend engine. Once confirmed:
• Long entries trigger on pullbacks, exiting progressively as price moves up
• Short entries trigger on rallies, exiting as price declines
Grid levels are spaced by configurable percentage width, and entries scale dynamically.
🔹 Stop Loss Mechanism
TitanGrid uses a dual-layer stop system:
• A static stop per entry, placed at a fixed percentage distance matching the grid width
• A trend reversal exit that closes the entire position if price crosses the SuperTrend in the opposite direction
Stops are triggered once per cycle, ensuring predictable and capital-aware behavior.
🔹 Key Features
• Dual-side grid logic (Long-only, Short-only, or Both)
• SuperTrend filtering to enforce directional bias
• Adjustable grid spacing, scaling, and sizing
• Static and dynamic stop-loss logic
• Partial exits and reset conditions
• Webhook-ready alerts (browser-based automation compatible)
• Internal simulation of equity, PnL, fees, and liquidation levels
• Real-time dashboard for full transparency
🔹 Best Use Cases
TitanGrid performs best in structured or mean-reverting environments.
It is especially well-suited to assets with the behavioral profile of ETH — reactive, trend-intraday, and prone to clean pullback formations.
While adaptable to multiple timeframes, it shows strongest performance on the 15-minute chart , offering a balance of signal frequency and directional clarity.
🔹 License
Published under the Mozilla Public License 2.0 .
You are free to study, adapt, and extend this script.
🔹 Panel Reference
The real-time dashboard displays performance metrics, capital state, and position behavior:
• Asset Type – Automatically detects the instrument class (e.g., Crypto, Stock, Forex) from symbol metadata
• Equity – Total simulated capital: realized PnL + floating PnL + remaining cash
• Available Cash – Capital not currently allocated to any position
• Used Margin – Capital locked in open trades, based on position size and leverage
• Net Profit – Realized gain/loss after commissions and fees
• Raw Net Profit – Gross result before trading costs
• Floating PnL – Unrealized profit or loss from active positions
• ROI – Return on initial capital, including realized and floating PnL. Leverage directly impacts this metric, amplifying both gains and losses relative to account size.
• Long/Short Size & Avg Price – Open position sizes and volume-weighted average entry prices
• Leverage & Liquidation – Simulated effective leverage and projected liquidation level
• Hold – Best-performing hold side (Long or Short) over the session
• Hold Efficiency – Performance efficiency during holding phases, relative to capital used
• Profit Factor – Ratio of gross profits to gross losses (realized)
• Payoff Ratio – Average profit per win / average loss per loss
• Win Rate – Percent of profitable closes (including partial exits)
• Expectancy – Net average result per closed trade
• Max Drawdown – Largest recorded drop in equity during the session
• Commission Paid – Simulated trading costs: maker, taker, funding
• Long / Short Trades – Count of entry signals per side
• Time Trading – Number of bars spent in active positions
• Volume / Month – Extrapolated 30-day trading volume estimate
• Min Capital – Lowest equity level recorded during the session
🔹 Reference Ranges by Strategy Type
Use the following metrics as reference depending on the trading style:
Grid / Mean Reversion
• Profit Factor: 1.2 – 2.0
• Payoff Ratio: 0.5 – 1.2
• Win Rate: 50% – 70% (based on partial exits)
• Expectancy: 0.05% – 0.25%
• Drawdown: Moderate to high
• Commission Impact: High
Trend-Following
• Profit Factor: 1.5 – 3.0
• Payoff Ratio: 1.5 – 3.5
• Win Rate: 30% – 50%
• Expectancy: 0.3% – 1.0%
• Drawdown: Low to moderate
Scalping / High-Frequency
• Profit Factor: 1.1 – 1.6
• Payoff Ratio: 0.3 – 0.8
• Win Rate: 80% – 95%
• Expectancy: 0.01% – 0.05%
• Volume / Month: Very high
Breakout Strategies
• Profit Factor: 1.4 – 2.2
• Payoff Ratio: 1.2 – 2.0
• Win Rate: 35% – 60%
• Expectancy: 0.2% – 0.6%
• Drawdown: Can be sharp after failed breakouts
🔹 Note on Performance Simulation
TitanGrid includes internal accounting of fees, slippage, and funding costs.
While its logic is designed for precision and capital efficiency, performance is naturally affected by exchange commissions.
In frictionless environments (e.g., zero-fee simulation), its high-frequency logic could — in theory — extract substantial micro-edges from the market.
However, real-world conditions introduce limits, and all results should be interpreted accordingly.

Grid TLong V1The “Grid TLong V1” strategy is based on the classic Grid strategy, but in the mode of buying and selling in favor of the trend and only on Long. This allows to take advantage of large uptrend movements to maximize profits in bull markets. For this reason, excessively sideways or bearish markets may not be very conducive to this strategy.
Like our Grid strategies in favor of the trend, you can enter and exit with the balance with controlled risk, as the distance between each grid functions as a natural and adaptable stop loss and take profit. What differentiates it from bidirectional strategies is that Short uses a minimum amount of follow-through, so that the percentage distance between the grids is maintained.
In this version of the script the entries and exits can be chosen at market or limit , and are based on the profit or loss of the current position, not on the percentage change in price.
The user may also notice that the strategy setup is risk-controlled, because it risks 5% on each trade, has a fairly standard commission and modest initial capital, all in order to protect the strategy user from unrealistic results.
As with all strategies, it is strongly recommended to optimize the parameters for the strategy to be effective for each asset and for each time frame.

Long Explosive V1The “Long Explosive V1” strategy calculates the percentage change in price from the last closing price of the candlestick, so that if it increases by a certain percentage it goes long, but if it decreases by another percentage it sends an exit order, so that the percentage limits above and below the current price function as inherent stop loss and take profit, with the benefit of taking advantage of the volatility of the bull market.
Entries and exits are always at the market and based on percentage changes in the price. Of course, the default configuration of the strategy considers a position with a 5% risk control, modest initial capital and standard commissions, which helps to obtain realistic results and protect the user from unexpectedly controlled potential losses.
It is again emphasized that it is always advisable to adjust the parameters of the strategy well, so that the risk-reward is well controlled.

Grid Tendence V1The “Grid Tendence V1” strategy is based on the classic Grid strategy, only in this case the entries and exits are made in favor of the trend, which allows to take advantage of large movements to maximize profits, since it is also possible to enter and exit with the balance with a controlled risk, because precisely the distance between each Grid works as a natural and adaptable stop loss and take profit. This fact helps to avoid overlapping entries and exits that would result from using stop loss and take profit as limit orders.
In this version of the script the entries and exits are always at market, and based on the percentage change of the price, not on the profit or loss of the current position.
The user will notice that the strategy setup is based on a controlled risk, risking 5% on each trade, a fairly standard commission and a modest initial capital, all this in order to protect the user of the strategy from unexpected or unrealistic results.
However, it is always recommended to optimize the parameters so that the strategy is effective for each asset and for each time frame.

Probability Grid [LuxAlgo]The Probability Grid tool allows traders to see the probability of where and when the next reversal would occur, it displays a 10x10 grid and/or dashboard with the probability of the next reversal occurring beyond each cell or within each cell.
🔶 USAGE
By default, the tool displays deciles (percentiles from 0 to 90), users can enable, disable and modify each percentile, but two of them must always be enabled or the tool will display an error message alerting of it.
The use of the tool is quite simple, as shown in the chart above, the further the price moves on the grid, the higher the probability of a reversal.
In this case, the reversal took place on the cell with a probability of 9%, which means that there is a probability of 91% within the square defined by the last reversal and this cell.
🔹 Grid vs Dashboard
The tool can display a grid starting from the last reversal and/or a dashboard at three predefined locations, as shown in the chart above.
🔶 DETAILS
🔹 Raw Data vs Normalized Data
By default the tool displays the normalized data, this means that instead of using the raw data (price delta between reversals) it uses the returns between each reversal, this is useful to make an apples to apples comparison of all the data in the dataset.
This can be seen in the left side of the chart above (BTCUSD Daily chart) where normalize data is disabled, the percentiles from 0 to 40 overlap and are indistinguishable from each other because the tool uses the raw price delta over the entire bitcoin history, with normalize data enabled as we can see in the right side of the chart we can have a fair comparison of the data over the entire history.
🔹 Probability Beyond or Within Each Cell
Two different probability modes are available, the default mode is Probability Beyond Each Cell, the number displayed in each cell is the probability of the next reversal to be located in the area beyond the cell, for example, if the cell displays 20%, it means that in the area formed by the square starting from the last reversal and ending at the cell, there is an 80% probability and outside that square there is a 20% probability for the location of the next reversal.
The second probability mode is the probability within each cell, this outlines the chance that the next reversal will be within the cell, as we can see on the right chart above, when using deciles as percentiles (default settings), each cell has the same 1% probability for the 10x10 grid.
🔶 SETTINGS
Swing Length: The maximum length in bars used to identify a swing
Maximum Reversals: Maximum number of reversals included in calculations
Normalize Data: Use returns between swings instead of raw price
Probability: Choose between two different probability modes: beyond and inside each cell
Percentiles: Enable/disable each of the ten percentiles and select the percentile number and line style
🔹 Dashboard
Show Dashboard: Enable or disable the dashboard
Position: Choose dashboard location
Size: Choose dashboard size
🔹 Style
Show Grid: Enable or disable the grid
Size: Choose grid text size
Colors: Choose grid background colors
Show Marks: Enable/disable reversal markers

Grid Level Visualizer v1.0Overview
This indicator draws a customizable grid of horizontal price levels directly on your chart. It's designed to help traders visualize potential support and resistance zones, manage grid trading strategies, or simply divide a price range into equal segments. The script offers interactive controls, extensive customization options, and alert functionality.
Key Features:
Customizable Grid: Draws a grid based on user-defined Upper Price Bound and Lower Price Bound.
Interactive Bounds: Easily adjust the Upper and Lower bounds by dragging the corresponding lines directly on the chart (click the line first to select, then drag). Bounds can also be set numerically in the settings.
Adjustable Levels: Specify the total number of horizontal lines in the grid (Number of Grid Levels), including bounds.
Custom Styling: Independently configure the color, width, and style (Solid, Dashed, Dotted) for the boundary lines and the intermediate grid lines.
Price Labels: Optional display of price values for each grid level, positioned on the right side near the current bar.
Labels for boundary levels automatically inherit the boundary line colors.
Adjustable horizontal offset (Price Label Offset (X)) for labels.
Customizable text size (Text Size) and color (Price Text Color (Mid)) for mid-levels.
Grid Start Time: Define a specific date and time (Grid Start Time) from which the grid lines should start appearing on the chart (defaults to the beginning of the current month).
Line Extension: Grid lines automatically extend to the right margin of the chart.
Alert Condition: Provides a "Grid Level Cross" condition for creating custom alerts when price crosses any active grid level.
Alert Toggle: An option (Enable Alert Condition?) in the settings to enable or disable the availability of the "Grid Level Cross" condition when creating alerts.
Real-time Calculation: Uses calc_on_every_tick=true for responsive alert checking against the current price.
How to Use:
Add the "Improved Grid Level Visualizer" indicator to your chart.
Set Bounds: Adjust the Upper Price Bound and Lower Price Bound lines by clicking and dragging them on the chart, or set precise values in the indicator settings.
Set Levels: Define the Number of Grid Levels you need in the settings.
Set Start Time: Use the Grid Start Time input to control when the grid visualization begins.
Customize: Configure colors, line styles, label visibility, etc., in the settings panel.
Set Alerts (Optional): Follow the steps below.
Notes:
The grid levels are calculated purely based on the mathematical division of the specified price range. They do not automatically adapt to market structure unless you manually adjust the bounds.
When changing the Grid Start Time after the indicator has been running, you might need to refresh the chart or remove/re-add the indicator for the visual starting point to update correctly.

GRID EXTENSIONGRID EXTENSION
Overview
The GRID EXTENSION is a simple grid-based indicator for TradingView, built with Pine Script v6. It plots horizontal price levels starting from a user-defined anchor price, with spacing set by a tick increment. Use it to identify key support, resistance, or price zones on charts for Crypto, Forex, or Futures.
Key Features
Custom Grid Levels: Plot up to 22 levels (e.g., 0, 0.25, 1.25, -2.50) with options to show/hide, set values, and choose colors.
Market-Specific Tick Increments: Select your asset type (Crypto, Forex, Futures) and choose from a range of tick increments tailored for each market:
Crypto: 1 to 5000 ticks (e.g., 100 ticks = $0.001 on ADA/USD, 5000 ticks = $50 on BTC/USD).
Forex: 5 to 5000 ticks (e.g., 100 ticks = 1 pip on EUR/USD, 5000 ticks = 50 pips).
Futures: 1 to 2500 ticks (e.g., 25 ticks = 6.25 points on E-mini S&P 500, $312.50 per contract).
Visual Options:
Extend lines to the right.
Show price and level labels (as values or percentages).
Place labels on the left or right.
Adjust background transparency for filled areas between levels.
How to Use
Set Asset Type: Choose "Crypto," "Forex," or "Futures" to match your chart.
Set Anchor Price: Enter a starting price for the grid.
Pick Tick Increment: Select a tick increment from the dropdown, following the guidance for your asset type (see Key Features).
Customize Levels: Turn levels on/off, set values, and pick colors.
Add to Chart: Apply the indicator to see the grid on your chart.
Tips
Use levels to mark support/resistance zones for entries or exits.
Extend lines to project future price zones.
Choose smaller increments (e.g., 5 ticks) for scalping, or larger ones (e.g., 1000 ticks) for swing trading.
Combine with indicators like moving averages for better signals.
Settings
Asset Type: Select "Crypto," "Forex," or "Futures" (default: "Crypto").
Anchor Price: Starting price for the grid (default: 0.0).
Tick Increment: Space between levels (options: 1, 5, 10, 25, 50, 100, 250, 500, 1000, 2500, 5000). Choose based on asset type.
Extend Right: Extend lines to the right (default: true).
Show Prices: Show price labels (default: true).
Show Levels: Show level values or percentages (default: true).
Format: Display levels as "Values" or "Percent" (default: "Values").
Labels Position: Place labels on "Left" or "Right" (default: "Left").
Background Transparency: Set transparency for filled areas (default: 100, range 0-100).
Level Options: Enable/disable levels, set values, and choose colors.
Notes
Set the anchor price to a key level (like a recent high or low) for best results.
Check the tick increment tooltip to ensure the spacing suits your market type.
Works on any chart, best for clear price trends or ranges.
Acknowledgments
Made with Pine Script v6 for TradingView. This is v1.0—feedback welcome for future updates!

Adaptive Fractal Grid Scalping StrategyThis Pine Script v6 component implements an "Adaptive Fractal Grid Scalping Strategy" with an added volatility threshold feature.
Here's how it works:
Fractal Break Detection: Uses ta.pivothigh and ta.pivotlow to identify local highs and lows.
Volatility Clustering: Measures volatility using the Average True Range (ATR).
Adaptive Grid Levels: Dynamically adjusts grid levels based on ATR and user-defined multipliers.
Directional Bias Filter: Uses a Simple Moving Average (SMA) to determine trend direction.
Volatility Threshold: Introduces a new input to specify a minimum ATR value required to activate the strategy.
Trade Execution Logic: Places limit orders at grid levels based on trend direction and fractal levels, but only when ATR exceeds the volatility threshold.
Profit-Taking and Stop-Loss: Implements profit-taking at grid levels and a trailing stop-loss based on ATR.
How to Use
Inputs: Customize the ATR length, SMA length, grid multipliers, trailing stop multiplier, and volatility threshold through the input settings.
Visuals: The script plots fractal points and grid levels on the chart for easy visualization.
Trade Signals: The strategy automatically places buy/sell orders based on the detected fractals, trend direction, and volatility threshold.
Profit and Risk Management: The script includes logic for taking profits and setting stop-loss levels to manage trades effectively.
This strategy is designed to capitalize on micro-movements during high volatility and avoid overtrading during low-volatility trends. Adjust the input parameters to suit your trading style and market conditions.

Rounded Grid Levels🟩 Rounded Grid Levels is a visual tool that helps traders quickly identify key psychological price levels on any chart. By dynamically adapting to the user's visible screen area, it provides consistent, easy-to-read round number grids that align with price action. The indicator offers a traditional visualization of horizontal round level grids, along with enhanced options such as tilted grids that align with market sentiment, and fan-shaped grids for alternative price interaction views. It serves purely as a visual aid, providing an adaptable way to observe rounded price levels without making predictions or generating trading signals.
⚡ OVERVIEW ⚡
The Rounded Grid Levels indicator is a visual tool designed to help traders identify and track price levels that may hold psychological significance, such as round numbers or significant milestones. These levels often serve as potential areas for price reactions, including support, resistance, or points of market interest. The indicator's gridlines are determined by user-defined settings and adjust dynamically based on the visible chart area, meaning they are influenced by the user's current zoom level and perspective. This behavior is similar to TradingView's built-in grid lines found in the chart settings canvas, which also adjust in real-time based on the visible screen, ensuring the most relevant price levels are displayed. By default, the indicator provides consistent gridlines to represent traditional round number levels, offering a straightforward view of key psychological areas. Additionally, users have access to experimental and novel configurations, such as fan-shaped layouts, which expand from a central point and adapt directionally based on user settings. This configuration can provide an alternate perspective for traders, especially useful in analyzing broader market moves and visualizing expansion relative to the current price.
Users can display the gridlines in a variety of configurations, including horizontal, neutral, auto, or fan-shaped layouts, depending on their preferred method of analysis. This flexibility allows traders to focus on different types of price action without overcrowding the visual representation of price movements.
This indicator is intended purely as a visual aid for understanding how price interacts with rounded levels over time. It does not generate predictive trading signals or recommendations but rather provides traders with a customizable framework to enhance their market analysis.
⭕ ROUND NUMBERS IN MARKET PSYCHOLOGY ⭕
Round numbers hold a significant place in financial markets, largely due to the psychological tendencies of traders and investors. These levels often represent areas of interest where human behavior, market biases, and trading strategies converge. Whether it's prices ending in 000, 500, or other recognizable values, these levels naturally attract more attention and influence decision-making.
Round numbers can act as key support or resistance levels and often become focal points in market activity. They are frequently highlighted by financial media, embedded in products like options, and serve as foundations for various trading theories. Their impact extends across different market participants and strategies, making them important focal points in both short-term and long-term market analysis.
Round numbers play an important role in guiding trader behavior and market activity. To better understand why these levels are so impactful, there are several key factors that highlight their significance in trading and price dynamics:
Psychological Impact : Humans naturally gravitate toward round numbers, such as prices ending in 000, 500, or 00. These levels tend to draw attention as traders perceive them as psychologically significant. This behavior is rooted in the cognitive bias known as "left-digit bias," where people assign greater importance to rounded, more recognizable numbers. In trading, this means that prices at these levels are more memorable and thus more likely to attract attention, creating an area where traders focus their buying or selling decisions.
Order Clustering : Traders often place buy and sell orders around these rounded levels, either manually or automatically through stop and limit orders. This clustering leads to the formation of visible support or resistance zones, as the concentrated orders tend to influence price behavior around these key levels. Market participants tend to converge their orders around these price points because of their perceived psychological importance, creating a liquidity pocket. As a result, these areas often act as barriers that the price either struggles to cross or uses as springboards for further movement.
External Influences : Financial media frequently highlights round-number milestones, amplifying market sentiment and drawing traders' attention to these levels. Additionally, algorithmic trading systems often react to round-number thresholds, which can further reinforce price movements, creating self-reinforcing reactions at these levels. As media and analysts emphasize these milestones, more traders pay attention to them, leading to increased volume and often heightened volatility at those points. This self-reinforcing cycle makes round numbers an area where price movement can either accelerate due to a breakout or stall because of clustering interest.
Option Strike Prices : Options contracts typically have strike prices set at round numbers, and as expiration approaches, these levels can influence the price of the underlying asset due to concentrated trading activity. The behavior around these levels, often called "pinning," happens because traders adjust their positions to avoid unfavorable scenarios at these key strikes. This activity tends to concentrate price movement toward these levels as traders hedge their positions, leading to increased liquidity and the potential for abrupt price reactions near option expiration dates.
Whole Number Theory : This theory suggests that whole numbers act as natural psychological barriers, where traders tend to make decisions, place orders, or expect price reactions, making these levels crucial for analysis. Whole numbers are simple to remember and are often used as informal targets for profit-taking or stop placement. This behavior leads to a natural ebb and flow around these levels, where the market finds equilibrium temporarily before deciding on a future direction. Whole numbers tend to work like magnets, drawing price to them and often creating reactions that are visible across different timeframes.
Quarters Theory : Commonly used in Forex markets, this theory focuses on quarter-point increments (e.g., 1.0000, 1.2500, 1.5000) as key levels where price often pauses or reverses. These quarter levels are treated as important psychological barriers, with price frequently interacting at these intervals. Traders use these points to gauge market strength or weakness because quarter levels divide larger round-number ranges into more manageable and meaningful segments. For example, in highly traded forex pairs like EUR/USD, traders might treat 1.2500 as a significant barrier because it represents a halfway point between 1.0000 and 1.5000, offering a balanced reference point for decision-making.
Big Round Numbers : Major round numbers, such as 100, 500, or 1000, often attract significant attention and serve as psychological thresholds. Traders anticipate strong reactions when prices approach or cross these levels. This is often because large round numbers symbolize major milestones, and price behavior around them tends to signal important market sentiment shifts. When price crosses a major level, such as a stock moving above $100 or Bitcoin crossing $50,000, it often creates a surge in trading activity as it is viewed as a validation or invalidation of market trends, drawing in momentum traders and triggering both retail and institutional responses.
By visualizing these round levels on the chart, the Rounded Grid Levels indicator helps traders identify areas where price may pause, reverse, or gain momentum. While round numbers provide useful insights, they should be used in conjunction with other technical analysis tools for a comprehensive trading strategy.
🛠️ CONFIGURATION AND SETTINGS 🛠️
The Rounded Grid Levels indicator offers a variety of configurable settings to tailor the visualization according to individual trader preferences. Below are the key settings available for customization:
Custom Settings
Rounding Step : The Rounding Step parameter sets the minimum interval between gridlines. This value determines how closely spaced the rounded levels are on the chart. For example, if the Rounding Step is set to 100, gridlines will be displayed at every 100 points (e.g., $100, $200, $300) relative to the current price level. The Rounding Step is scaled to the chart's visible area, meaning users should adjust it appropriately for different assets to ensure effective visualization. Lower values provide a more granular view, while larger values give a broader, higher-level perspective.
Major Grids : Defines the interval at which major gridlines will appear compared to minor ones. For example, if the Rounding Step is 100 and Major Grids is set to 10, major gridlines will be displayed every $1,000, while minor gridlines will be at every $100. This distinction allows traders to better visualize key psychological levels by emphasizing significant price intervals.
Direction : Users can select the gridline direction, choosing between options such as 'Up', 'Down', 'Auto', or 'Neutral'. This setting controls how the gridlines extend relative to the current price level, which can help in analyzing directional trends.
Neutral Direction : This option provides balanced gridlines both above and below the current price, allowing traders to visualize support and resistance levels symmetrically. This is useful for analyzing sideways or ranging markets without directional bias.
Up Direction : The gridlines are tilted upwards, starting from visible lows and extending toward the rounded level at the current price. By choosing Up , traders emphasize an upward sentiment, visualizing price action that aligns with rising trends. This option helps illustrate potential areas where pullbacks may occur, as well as how price might expand upwards in the current market context.
Down Direction : The gridlines are tilted downwards, starting from visible highs and extending toward the rounded level at the current price. Selecting Down allows traders to emphasize a downward sentiment, visualizing how price may expand downwards, which is particularly useful when analyzing downtrends or potential correction levels. The gridlines provide an illustrative view of how price interacts with lower levels during market declines.
Auto Direction : The gridlines automatically adjust their direction based on recent market trends. This adaptive option allows traders to visualize gridlines that dynamically change according to price action, making it suitable for evolving market conditions where the direction is uncertain. It’s useful for traders looking for an indicator that moves in sync with market shifts and doesn’t require manual adjustment.
Grid Type : Allows users to choose between 'Linear' or 'Fan' grid types. The Linear type creates evenly spaced gridlines that can be either horizontal or tilted, depending on the chosen direction setting, providing a straightforward view of price levels. The Fan type radiates lines from a central point, offering a more dynamic perspective for analyzing price expansions relative to the current price. These grid types introduce experimental visualizations influenced by chart properties, including visible highs, lows, and the current price. Regardless of the configuration, the gridlines will always end at the current bar, which represents a rounded price level, ensuring consistency in how key price areas are displayed.
Extend : This setting allows gridlines to be projected into the future, helping traders see potential levels beyond the current bar. When enabled, the behavior of the extended lines varies based on the selected grid type and direction. For Neutral and Horizontal Linear settings, the extended gridlines maintain their round-number alignment indefinitely. However, for Up , Down , or Auto directions, the angle of the extended gridlines can change dynamically based on the chart’s visible high and low or the latest price action. As a result, extended lines may not continue to align with round-number levels beyond the current bar, reflecting instead the current trend and sentiment of the market. Regardless of direction, extended gridlines remain consistently spaced and either parallel or evenly distributed, ensuring a structured visual representation.
Color Settings : Users can customize the colors for resistance, support, and minor gridlines at the current price. This helps in visually distinguishing between different grid types and their significance on the chart.
Color Options
These configuration options make the Rounded Grid Levels indicator a versatile tool for traders looking to customize their charts based on their personal trading strategies and analytical preferences.
🖼️ CHART EXAMPLES 🖼️
The following chart examples illustrate different configurations available in the Rounded Grid Levels indicator. These examples show how variations in grid type, direction, and rounding step settings impact the visualization of price levels. Traders may find that smaller rounding steps are more effective on lower time frames, where precision is key, whereas larger rounding steps help to reduce clutter and highlight key levels on higher time frames. Each image includes a caption to explain the specific configuration used, helping users better understand how to apply these settings in different market conditions.
Smaller Rounding Step (100) : With a smaller rounding step, the gridlines are spaced closely together. This setting is particularly useful for lower time frames where price action is more granular and finer details are needed. It allows traders to track price interactions at narrower levels, but on higher time frames, it may lead to clutter and exceed Pine Script's 500-line limit.
Larger Rounding Step (1000) : With a larger rounding step, the gridlines are spaced farther apart. This visualization is better suited for higher time frames or broader market overviews, allowing users to focus on major psychological levels without overloading the chart. On lower time frames, this may result in fewer actionable levels, but it helps in maintaining clarity and staying within Pine Script's line limit.
Linear Grid Type, Neutral Direction (Traditional Rounded Price Levels) : The Linear gridlines are displayed in a neutral fashion, representing traditional round-number levels with consistent spacing above and below the current price. This layout helps visualize key psychological price levels over time in a straightforward manner.
Linear Grid Type, Down Direction : The Linear gridlines are tilted downwards, remaining parallel and ending at the rounded level at the current price. This setup emphasizes downward market sentiment, allowing traders to visualize price expansion towards lower levels, which is useful when analyzing downtrends or potential correction levels.
Linear Grid Type, Down Direction : The Linear gridlines are tilted downwards, extending from the current price to lower levels. Useful for observing downtrending price movements and visualizing pullback areas during uptrends.
Linear Grid Type, Auto Direction : The Linear gridlines adjust dynamically, tilting either upwards or downwards to align with recent price trends, remaining parallel and ending at the rounded level at the current price. This configuration reflects the current market sentiment and offers traders a flexible way to observe price dynamics as they develop in real time.
Fan Grid Type, Neutral Direction : The fan-shaped gridlines radiate symmetrically from a central point, ending at the rounded level at the current price. This configuration provides an unbiased view of price action, giving traders a balanced visualization of rounded levels without directional influence.
Fan Grid Type, Up Direction : The fan-shaped gridlines originate from lower visible price points and radiate upwards, ending at the rounded level at the current price. This layout helps visualize potential price expansion to higher levels, offering insights into upward momentum while maintaining a dynamic and evolving perspective on market conditions.
Fan Grid Type, Down Direction : The fan-shaped gridlines originate from higher visible price points and radiate downwards, ending at the rounded level at the current price. This setup is particularly useful for observing potential price expansion towards lower levels, illustrating areas where the price might extend during a downtrend.
Fan Grid Type, Auto Direction : The fan-shaped gridlines dynamically adjust, originating from visible chart points based on the current market trend, and radiate outward, ending at the rounded level at the current price. This adaptive visualization offers a continuously evolving representation that aligns with changing market sentiment, helping traders assess price expansion dynamically.
📊 SUMMARY 📊
The Rounded Grid Levels indicator helps traders highlight important round-number price levels on their charts, providing a dynamic way to visualize these psychological areas. With customizable gridline options—including traditional, tilted, and fan-shaped styles—users can adapt the indicator to suit their analysis needs. The gridlines adjust with chart zoom or scale, offering a flexible tool for observing price action, without providing specific trading signals or predictions.
⚙️ COMPATIBILITY AND LIMITATIONS ⚙️
Asset Compatibility :
The Rounded Grid Levels indicator is compatible with all asset classes, including cryptocurrencies, forex, stocks, and commodities. Users should adjust both the Rounding Step and the Major Grid settings to ensure the correct scale is used for the specific asset. This adjustment ensures that the most relevant round price levels are displayed effectively regardless of the instrument being analyzed. For instance, when analyzing BTCUSD, a higher Rounding Step may be needed compared to forex pairs like EURUSD, and the Major Grid value should also be adjusted to appropriately emphasize significant levels.
Line Limitations in Pine Script :
The Rounded Grid Levels indicator is subject to Pine Script's 500-line limit. This means that it cannot draw more than 500 gridlines on the chart at any given time. The number of gridlines depends directly on the chosen Rounding Step . If the steps are too small, the gridlines will be spaced too closely, causing the indicator to quickly reach the line limit. For example, if Ethereum is trading around $2,500, a Rounding Step of 100 might be appropriate, but a step of 1.00 would create too many gridlines, exceeding Pine Script's limit. Users should consider appropriate settings to avoid running into this constraint.
Runtime Error Considerations
When using the Rounded Grid Levels indicator, users might encounter a runtime error in specific scenarios. This typically happens if the Rounding Step is set too small, causing the indicator to exceed Pine Script's line limit or take too long to process. This can often occur when switching between charts that have significantly different price ranges. Since the Rounding Step requires flexibility to work with a wide variety of assets—ranging from decimals to thousands—it is not practically limited within the script itself. If a runtime error occurs, the recommended solution is to increase the Rounding Step to a larger value that better matches the current asset's price range.
Runtime Error: If the Rounding Step is too small for the current asset or chart, the indicator may generate a runtime error. Users should increase the Rounding Step to ensure proper visualization.
⚠️ DISCLAIMER ⚠️
The Rounded Grid Levels indicator is not designed as a predictive tool. While it extends gridlines into the future, this extension is purely for visual continuity and does not imply any forecast of future price movements. The primary function of this indicator is to help users visualize significant round number price levels.
The gridlines adjust dynamically based on the visible chart range, ensuring that the most relevant round price levels are displayed. This behavior allows the indicator to adapt to your current view of the market, but it should not be used to predict price movements. The indicator is intended as a visual aid and should be used alongside other tools in a comprehensive market analysis approach.
While gridlines may align with significant price levels in hindsight, they should not be interpreted as indicators of future price movements. Traders are encouraged to adjust settings based on their strategy and market conditions.
🧠 BEYOND THE CODE 🧠
The Rounded Grid Levels indicator, like other xxattaxx indicators , is designed with education and community collaboration in mind. Its open-source nature encourages exploration, experimentation, and the development of new grid calculation indicators, drawings, and strategies. We hope this indicator serves as a framework and a starting point for future innovations in grid trading.
Your comments, suggestions, and discussions are invaluable in shaping the future of this project. We actively encourage your feedback and contributions, which will directly help us refine and improve the Rounded Grid Levels indicator. We look forward to seeing the creative ways in which you use and enhance this tool.

Revenue GridDescription:
The Revenue Grid indicator helps traders and investors visualize a stock’s valuation by plotting horizontal lines based on its price-to-sales (P/S) ratio. This tool displays how the stock price compares to multiples of its total revenue per share, giving a clear perspective on valuation benchmarks.
Fundamental Concept:
The price-to-sales ratio compares a company’s stock price to its revenue per share. It’s used to evaluate whether a stock is overvalued or undervalued based on its revenue.
This indicator offers a unique way to view this ratio by applying Fibonacci multiples to the revenue per share. It plots lines at these multiples to show how the stock price measures up against different valuation levels.
How It Works:
Data Inputs:
Total Revenue (TR): The company’s revenue over the past twelve months.
Total Shares Outstanding (TSO): The total number of shares in circulation.
Calculation:
Calculates the revenue per share (TR/TSO).
Plots lines at fixed Fibonacci multiples (e.g., 1x, 2x, 3x, 5x, 8x, 13x) of the revenue per share value.
How to Use:
1. Add the "Revenue Grid" indicator to your chart by searching for it in the indicator library and applying it.
2. Observe the lines plotted on the chart. If these lines are trending upwards, it indicates that the revenue is increasing.
3. Analyze how historical prices trend relative to these lines. Look for periods where the stock price supports around specific multiples, you can easily get a sense of overvaluation or undervaluation in certain periods.
Use this information to guide further analysis and investment decisions.
Benefits:
1. Clear Valuation View: Easily see how the company’s revenue translates into stock price levels.
2. Investment Insight: Identify if the stock price is lagging behind revenue growth, which might signal a buying opportunity.
3. Historical Context: Understand how the market has historically valued the company and assess the current valuation.
Do let me know your feedbacks in comments. Happy Investing :)

Grid Bot Parabolic [xxattaxx]🟩 The Grid Bot Parabolic, a continuation of the Grid Bot Simulator Series , enhances traditional gridbot theory by employing a dynamic parabolic curve to visualize potential support and resistance levels. This adaptability is particularly useful in volatile or trending markets, enabling traders to explore grid-based strategies and gain deeper market insights. The grids are divided into customizable trade zones that trigger signals as prices move into new zones, empowering traders to gain deeper insights into market dynamics and potential turning points.
While traditional grid bots excel in ranging markets, the Grid Bot Parabolic’s introduction of acceleration and curvature adds new dimensions, enabling its use in trending markets as well. It can function as a traditional grid bot with horizontal lines, a tilted grid bot with linear slopes, or a fully parabolic grid with curves. This dynamic nature allows the indicator to adapt to various market conditions, providing traders with a versatile tool for visualizing dynamic support and resistance levels.
🔑 KEY FEATURES 🔑
Adaptable Grid Structures (Horizontal, Linear, Curved)
Buy and Sell Signals with Multiple Trigger/Confirmation Conditions
Secondary Buy and Secondary Sell Signals
Projected Grid Lines
Customizable Grid Spacing and Zones
Acceleration and Curvature Control
Sensitivity Adjustments
📐 GRID STRUCTURES 📐
Beyond its core parabolic functionality, the Parabolic Grid Bot offers a range of grid configurations to suit different market conditions and trading preferences. By adjusting the "Acceleration" and "Curvature" parameters, you can transform the grid's structure:
Parabolic Grids
Setting both acceleration and curvature to non-zero values results in a parabolic grid.This configuration can be particularly useful for visualizing potential turning points and trend reversals. Example: Accel = 10, Curve = -10)
Linear Grids
With a non-zero acceleration and zero curvature, the grid tilts to represent a linear trend, aiding in identifying potential support and resistance levels during trending phases. Example: Accel =1.75, Curve = 0
Horizontal Grids
When both acceleration and curvature are set to zero, the indicator reverts to a traditional grid bot with horizontal lines, suitable for ranging markets. Example: Accel=0, Curve=0
⚙️ INITIAL SETUP ⚙️
1.Adding the Indicator to Your Chart
Locate a Starting Point: To begin, visually identify a price point on your chart where you want the grid to start.This point will anchor your grid.
2. Setting Up the Grid
Add the Grid Bot Parabolic Indicator to your chart. A “Start Time/Price” dialog will appear
CLICK on the chart at your chosen start point. This will anchor the start point and open a "Confirm Inputs" dialog box.
3. Configure Settings. In the dialog box, you can set the following:
Acceleration: Adjust how quickly the grid reacts to price changes.
Curve: Define the shape of the parabola.
Intervals: Determine the distance between grid levels.
If you choose to keep the default settings, with acceleration set to 0 and curve set to 0, the grid will display as traditional horizontal lines. The grid will align with your selected price point, and you can adjust the settings at any time through the indicator’s settings panel.
⚙️ CONFIGURATION AND SETTINGS ⚙️
Grid Settings
Accel (Acceleration): Controls how quickly the price reacts to changes over time.
Curve (Curvature): Defines the overall shape of the parabola.
Intervals (Grid Spacing): Determines the vertical spacing between the grid lines.
Sensitivity: Fine tunes the magnitude of Acceleration and Curve.
Buy Zones & Sell Zones: Define the number of grid levels used for potential buy and sell signals.
* Each zone is represented on the chart with different colors:
* Green: Buy Zones
* Red: Sell Zones
* Yellow: Overlap (Buy and Sell Zones intersect)
* Gray: Neutral areas
Trigger: Chooses which part of the candlestick is used to trigger a signal.
* `Wick`: Uses the high or low of the candlestick
* `Close`: Uses the closing price of the candlestick
* `Midpoint`: Uses the middle point between the high and low of the candlestick
* `SWMA`: Uses the Symmetrical Weighted Moving Average
Confirm: Specifies how a signal is confirmed.
* `Reverse`: The signal is confirmed if the price moves in the opposite direction of the initial trigger
* `Touch`: The signal is confirmed when the price touches the specified level or zone
Sentiment: Determines the market sentiment, which can influence signal generation.
* `Slope`: Sentiment is based on the direction of the curve, reflecting the current trend
* `Long`: Sentiment is bullish, favoring buy signals
* `Short`: Sentiment is bearish, favoring sell signals
* `Neutral`: Sentiment is neutral. No secondary signals will be generated
Show Signals: Toggles the display of buy and sell signals on the chart
Chart Settings
Grid Colors: These colors define the visual appearance of the grid lines
Projected: These colors define the visual appearance of the projected lines
Parabola/SWMA: Adjust colors as needed. These are disabled by default.
Time/Price
Start Time & Start Price: These set the starting point for the parabolic curve.
* These fields are automatically populated when you add the indicator to the chart and click on an initial location
* These can be adjusted manually in the settings panel, but he easiest way to change these is by directly interacting with the start point on the chart
Please note: Time and Price must be adjusted for each chart when switching assets. For example, a Start Price on BTCUSD of $60,000 will not work on an ETHUSD chart.
🤖 ALGORITHM AND CALCULATION 🤖
The Parabolic Function
At the core of the Parabolic Grid Bot lies the parabolic function, which calculates a dynamic curve that adapts to price action over time. This curve serves as the foundation for visualizing potential support and resistance levels.
The shape and behavior of the parabola are influenced by three key user-defined parameters:
Acceleration: This parameter controls the rate of change of the curve's slope, influencing its tilt or steepness. A higher acceleration value results in a more pronounced tilt, while a lower value leads to a gentler slope. This applies to both curved and linear grid configurations.
Curvature: This parameter introduces and controls the curvature or bend of the grid. A higher curvature value results in a more pronounced parabolic shape, while a lower value leads to a flatter curve or even a straight line (when set to zero).
Sensitivity: This setting fine-tunes the overall responsiveness of the grid, influencing how strongly the Acceleration and Curvature parameters affect its shape. Increasing sensitivity amplifies the impact of these parameters, making the grid more adaptable to price changes but potentially leading to more frequent adjustments. Decreasing sensitivity reduces their impact, resulting in a more stable grid structure with fewer adjustments. It may be necessary to adjust Sensitivity when switching between different assets or timeframes to ensure optimal scaling and responsiveness.
The parabolic function combines these parameters to generate a curve that visually represents the potential path of price movement. By understanding how these inputs influence the parabola's shape and behavior, traders can gain valuable insights into potential support and resistance areas, aiding in their decision-making process.
Sentiment
The Parabolic Grid Bot incorporates sentiment to enhance signal generation. The "Sentiment" input allows you to either:
Manually specify the market sentiment: Choose between 'Long' (bullish), 'Short' (bearish), or 'Neutral'.
Let the script determine sentiment based on the slope of the parabolic curve: If 'Slope' is selected, the sentiment will be considered 'Long' when the curve is sloping upwards, 'Short' when it's sloping downwards, and 'Neutral' when it's flat.
Buy and Sell Signals
The Parabolic Grid Bot generates buy and sell signals based on the interaction between the price and the grid levels.
Trigger: The "Trigger" input determines which part of the candlestick is used to trigger a signal (wick, close, midpoint, or SWMA).
Confirmation: The "Confirm" input specifies how a signal is confirmed ('Reverse' or 'Touch').
Zones: The number of "Buy Zones" and "Sell Zones" determines the areas on the grid where buy and sell signals can be generated.
When the trigger condition is met within a buy zone and the confirmation criteria are satisfied, a buy signal is generated. Similarly, a sell signal is generated when the trigger and confirmation occur within a sell zone.
Secondary Signals
Secondary signals are generated when a regular buy or sell signal contradicts the prevailing sentiment. For example:
A buy signal in a bearish market (Sentiment = 'Short') would be considered a "secondary buy" signal.
A sell signal in a bullish market (Sentiment = 'Long') would be considered a "secondary sell" signal.
These secondary signals are visually represented on the chart using hollow triangles, differentiating them from regular signals (filled triangles).
While they can be interpreted as potential contrarian trade opportunities, secondary signals can also serve other purposes within a grid trading strategy:
Exit Signals: A secondary signal can suggest a potential shift in market sentiment or a weakening trend. This could be a cue to consider exiting an existing position, even if it's currently profitable, to lock in gains before a potential reversal
Risk Management: In a strong trend, secondary signals might offer opportunities for cautious counter-trend trades with controlled risk. These trades could utilize smaller position sizes or tighter stop-losses to manage potential downside if the main trend continues
Dollar-Cost Averaging (DCA): During a prolonged trend, the parabolic curve might generate multiple secondary signals in the opposite direction. These signals could be used to implement a DCA strategy, gradually accumulating a position at potentially favorable prices as the market retraces or consolidates within the larger trend
Secondary signals should be interpreted with caution and considered in conjunction with other technical indicators and market context. They provide additional insights into potential market reversals or consolidation phases within a broader trend, aiding in adapting your grid trading strategy to the evolving market dynamics.
Examples
Trigger=Wick, Confirm=Touch. Signals are generated when the wick touches the next gridline.
Trigger=Close, Confirm=Touch. Signals require the close to touch the next gridline.
Trigger=SWMA, Confirm=Reverse. Signals are triggered when the Symmetrically Weighted Moving Average reverse crosses the next gridline.
🧠THEORY AND RATIONALE 🧠
The innovative approach of the Parabolic Grid Bot can be better understood by first examining the limitations of traditional grid trading strategies and exploring how this indicator addresses them by incorporating principles of market cycles and dynamic price behavior
Traditional Grid Bots: One-Dimensional and Static
Traditional grid bots operate on a simple premise: they divide the price chart into a series of equally spaced horizontal lines, creating a grid of trading zones. These bots excel in ranging markets where prices oscillate within a defined range. Buy and sell orders are placed at these grid levels, aiming to profit from mean reversion as prices bounce between the support and resistance zones.
However, traditional grid bots face challenges in trending markets. As the market moves in one direction, the bot continues to place orders in that direction, leading to a stacking of positions. If the market eventually reverses, these stacked trades can be profitable, amplifying gains. But the risk lies in the potential for the market to continue trending, leaving the trader with a series of losing trades on the wrong side of the market
The Parabolic Grid Bot: Adding Dimensions
The Parabolic Grid Bot addresses the limitations of traditional grid bots by introducing two additional dimensions:
Acceleration (Second Dimension): This parameter introduces a second dimension to the grid, allowing it to tilt upwards or downwards to align with the prevailing market trend. A positive acceleration creates an upward-sloping grid, suitable for uptrends, while a negative acceleration results in a downward-sloping grid, ideal for downtrends. The magnitude of acceleration controls the steepness of the tilt, enabling you to fine-tune the grid's responsiveness to the trend's strength
Curvature (Third Dimension): This parameter adds a third dimension to the grid by introducing a parabolic curve. The curve's shape, ranging from gentle bends to sharp turns, is controlled by the curvature value. This flexibility allows the grid to closely mirror the market's evolving structure, potentially identifying turning points and trend reversals.
Mean Reversion in Trending Markets
Even in trending markets, the Parabolic Grid Bot can help identify opportunities for mean reversion strategies. While the grid may be tilted to reflect the trend, the buy and sell zones can capture short-term price oscillations or consolidations within the broader trend. This allows traders to potentially pinpoint entry and exit points based on temporary pullbacks or reversals.
Visualize and Adapt
The Parabolic Grid Bot acts as a visual aid, enhancing your understanding of market dynamics. It allows you to "see the curve" by adapting the grid to the market's patterns. If the market shows a parabolic shape, like an upward curve followed by a peak and a downward turn (similar to a head and shoulders pattern), adjust the Accel and Curve to match. This highlights potential areas of interest for further analysis.
Beyond Straight Lines: Visualizing Market Cycle
Traditional technical analysis often employs straight lines, such as trend lines and support/resistance levels, to interpret market movements. However, many analysts, including Brian Millard, contend that these lines can be misleading. They propose that what might appear as a straight line could represent just a small part of a larger curve or cycle that's not fully visible on the chart.
Markets are inherently cyclical, marked by phases of expansion, contraction, and reversal. The Parabolic Grid Bot acknowledges this cyclical behavior by offering a dynamic, curved grid that adapts to these shifts. This approach helps traders move beyond the limitations of straight lines and visualize potential support and resistance levels in a way that better reflects the market's true nature
By capturing these cyclical patterns, whether subtle or pronounced, the Parabolic Grid Bot offers a nuanced understanding of market dynamics, potentially leading to more accurate interpretations of price action and informed trading decisions.
⚠️ DISCLAIMER⚠️
This indicator utilizes a parabolic curve fitting approach to visualize potential support and resistance levels. The mathematical formulas employed have been designed with adaptability and scalability in mind, aiming to accommodate various assets and price ranges. While the resulting curves may visually resemble parabolas, it's important to note that they might not strictly adhere to the precise mathematical definition of a parabola.
The indicator's calculations have been tested and generally produce reliable results. However, no guarantees are made regarding their absolute mathematical accuracy. Traders are encouraged to use this tool as part of their broader analysis and decision-making process, combining it with other technical indicators and market context.
Please remember that trading involves inherent risks, and past performance is not indicative of future results. It is always advisable to conduct your own research and exercise prudent risk management before making any trading decisions.
🧠 BEYOND THE CODE 🧠
The Parabolic Grid Bot, like the other grid bots in this series, is designed with education and community collaboration in mind. Its open-source nature encourages exploration, experimentation, and the development of new grid trading strategies. We hope this indicator serves as a framework and a starting point for future innovations in the field of grid trading.
Your comments, suggestions, and discussions are invaluable in shaping the future of this project. We welcome your feedback and look forward to seeing how you utilize and enhance the Parabolic Grid Bot.
