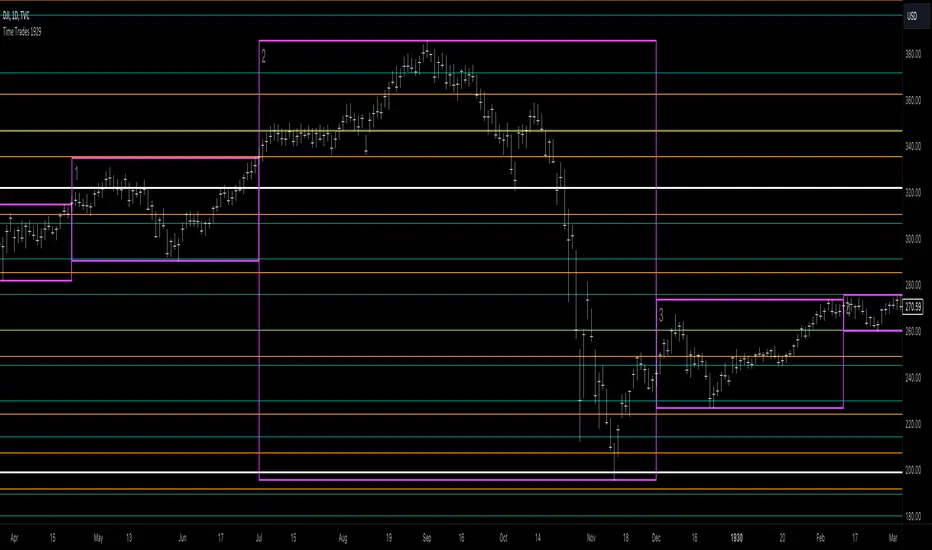
Time Trades 1929The Time Trades script showing key timing elements for the period of 1927-1930, centered around the 1929 crash.
This script includes the following timing elements:
Medium Pivots is a rough 3 month cycle based on the inner planets. This script includes Medium Pivots from 1924-10-01 to 1930-09-30
Small Pivots is a monthly cycle based on the Moon. This script includes Small Pivots from 1926-10-01 to 1929-12-29
Gann Waves is a different monthly cycle based on the Moon. This script includes Gann Waves from 1926-10-01 to 1930-03-29
New lunar signs indicates when the moon enters Aquarius or Leo which tends to be important signs for trend changes. This script includes Aquarius and Leo lunar signs from 1929-04-03 to 1929-12-29
Unlike the Time Trades script for current dates, this script does NOT include:
Cheat Code purple or teal vertical lines
Moon void of course periods as we don't have access to intraday prices in the historical dataset
Lunar aspects as we don't have access to intraday prices in the historical dataset
This script is part of the Time Trades service.
간
Gann Box by time frame
█ OVERVIEW
This script is designed to plot Gann boxes within a specific time frame candle. That means, you can get your intraday Gann box with one click and zoom in to low time frame. Highs and lows are set by candle chosen, you can display the yearly Gann box if that's something you want to view!
In addition, this script can highlight the golden ratio and its inverse ( .618 & .382 ) within the box itself. You have the option to select between a daily, a weekly, or a monthly candle. Not to mention that you have the ability to select a multiplier to those candles, where for example, you would be able to plot the 3 month ( quarterly ) gann box. or the yearly by selecting 12 months! This script includes zero, one and two divisions to Gann box. The first division would get you the sun lines only. while the first division has the middle 0.5 point and so on. This script is meant to be used as a one-click fast solution. Highs and lows get adjusted as the chart breaks those levels automatically.
█ Future Plans and upgrades to this script may include :
1. Adding more divisions.
2. Data box that shows box stats and performance.
3. More geometrical features such as the spirals and the circles on demand by one click.
and more! feel free to let me know what you'd like to see!
█ How to use :
1. Put the script on your chart
2. Navigate to the settings
3. Select your box's time frame.
give the script a few seconds and you should be set.
This script is coded as an addon to the Gann ToolBox package/scripts.

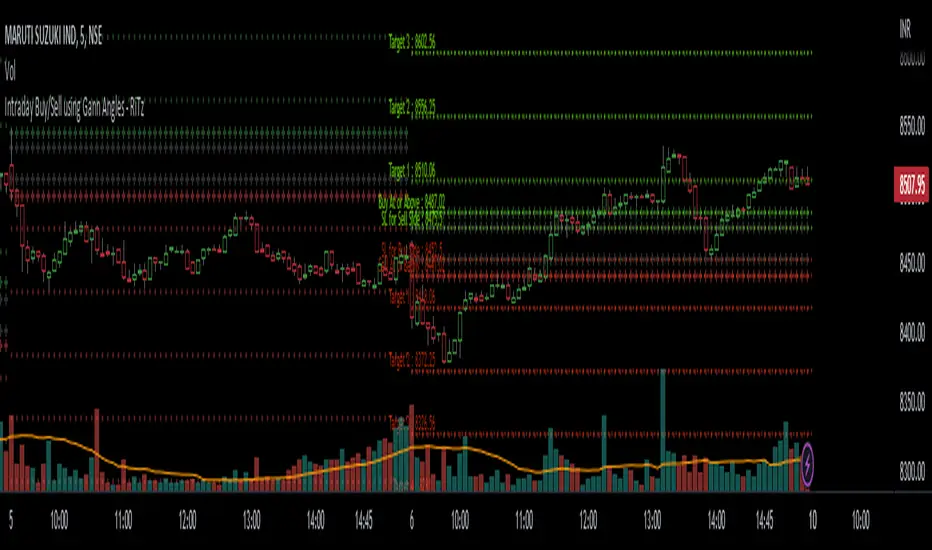
Intraday Buy/Sell using Gann Angles - RiTzIntraday Buy/Sell Levels using Gann Angles based on Todays Open/previous Day High/Low/Close prices
How to use this :
The Buy/Sell levels will be calculated on 1 of 4 things (you can choose any one which you prefer)
1. Todays Open price
2. Previous Day High
3. Previous Day Low
4. Previous Day Close
The Buy/Sell levels will be displayed in these ways
1. In a Table
2. on the Chart
You can turn them on/off according to your preference!
I can't seem to find the original documentation or a link to it.
i have it's excel file, in which we have to enter following data :
1. Todays Open price
2. Previous Day High
3. Previous Day Low
4. Previous Day Close
and the buy/sell levels are calculated by using the above data in following manner :
Based On Today's Opening Price
(lets call it TDO)
Degree's````````````````` Degree Factor```````````````````````` Buy````````````````````````` Sell
11.25```````````````````` =degree/180=11.25/180=0.0625````````` =(sqrt(TDO)-0.0625)^2``````` =(sqrt(TDO)+0.0625)^2````` SL
22.5````````````````````` =degree/180=22.5/180=0.125``````````` =(sqrt(TDO)+0.125)^2```````` =(sqrt(TDO)-0.125)^2`````` Buy/Sell At
45``````````````````````` =degree/180=45/180=0.25`````````````` =(sqrt(TDO)+0.25)^2````````` =(sqrt(TDO)-0.25)^2``````` Target-1
90``````````````````````` =degree/180=90/180=0.5``````````````` =(sqrt(TDO)+0.5)^2`````````` =(sqrt(TDO)-0.5)^2```````` Target-2
135`````````````````````` =degree/180=135/180=0.75````````````` =(sqrt(TDO)+0.75)^2````````` =(sqrt(TDO)-0.75)^2``````` Target-3
180`````````````````````` =degree/180=180/180=1```````````````` =(sqrt(TDO)+1)^2```````````` =(sqrt(TDO)-1)^2`````````` Target-4
225`````````````````````` =degree/180=225/180=1.25````````````` =(sqrt(TDO)+1.25)^2````````` =(sqrt(TDO)-1.25)^2``````` Target-5
270`````````````````````` =degree/180=270/180=1.5`````````````` =(sqrt(TDO)+1.5)^2`````````` =(sqrt(TDO)-1.5)^2```````` Target-6
315`````````````````````` =degree/180=315/180=1.75````````````` =(sqrt(TDO)+1.75)^2````````` =(sqrt(TDO)-1.75)^2``````` Target-7
360`````````````````````` =degree/180=360/180=2```````````````` =(sqrt(TDO)+2)^2```````````` =(sqrt(TDO)-2)^2`````````` Target-8
sqrt = square root
TDO = Today's Opening Price
PDH = Previous Days High
PDL = Previous Days Low
PDC = Previous Days Close
Based On Previous Days High Price
(lets call it PDH)
Degree's````````````````` Degree Factor```````````````````````` Buy````````````````````````` Sell
11.25```````````````````` =degree/180=11.25/180=0.0625````````` =(sqrt(PDH)-0.0625)^2``````` =(sqrt(PDH)+0.0625)^2````` SL
22.5````````````````````` =degree/180=22.5/180=0.125``````````` =(sqrt(PDH)+0.125)^2```````` =(sqrt(PDH)-0.125)^2`````` Buy/Sell At
45``````````````````````` =degree/180=45/180=0.25`````````````` =(sqrt(PDH)+0.25)^2````````` =(sqrt(PDH)-0.25)^2``````` Target-1
90``````````````````````` =degree/180=90/180=0.5``````````````` =(sqrt(PDH)+0.5)^2`````````` =(sqrt(PDH)-0.5)^2```````` Target-2
135`````````````````````` =degree/180=135/180=0.75````````````` =(sqrt(PDH)+0.75)^2````````` =(sqrt(PDH)-0.75)^2``````` Target-3
180`````````````````````` =degree/180=180/180=1```````````````` =(sqrt(PDH)+1)^2```````````` =(sqrt(PDH)-1)^2`````````` Target-4
225`````````````````````` =degree/180=225/180=1.25````````````` =(sqrt(PDH)+1.25)^2````````` =(sqrt(PDH)-1.25)^2``````` Target-5
270`````````````````````` =degree/180=270/180=1.5`````````````` =(sqrt(PDH)+1.5)^2`````````` =(sqrt(PDH)-1.5)^2```````` Target-6
315`````````````````````` =degree/180=315/180=1.75````````````` =(sqrt(PDH)+1.75)^2````````` =(sqrt(PDH)-1.75)^2``````` Target-7
360`````````````````````` =degree/180=360/180=2```````````````` =(sqrt(PDH)+2)^2```````````` =(sqrt(PDH)-2)^2`````````` Target-8
Based On Previous Days Low Price
(lets call it PDL)
Degree's````````````````` Degree Factor```````````````````````` Buy````````````````````````` Sell
11.25```````````````````` =degree/180=11.25/180=0.0625````````` =(sqrt(PDL)-0.0625)^2``````` =(sqrt(PDL)+0.0625)^2````` SL
22.5````````````````````` =degree/180=22.5/180=0.125``````````` =(sqrt(PDL)+0.125)^2```````` =(sqrt(PDL)-0.125)^2`````` Buy/Sell At
45``````````````````````` =degree/180=45/180=0.25`````````````` =(sqrt(PDL)+0.25)^2````````` =(sqrt(PDL)-0.25)^2``````` Target-1
90``````````````````````` =degree/180=90/180=0.5``````````````` =(sqrt(PDL)+0.5)^2`````````` =(sqrt(PDL)-0.5)^2```````` Target-2
135`````````````````````` =degree/180=135/180=0.75````````````` =(sqrt(PDL)+0.75)^2````````` =(sqrt(PDL)-0.75)^2``````` Target-3
180`````````````````````` =degree/180=180/180=1```````````````` =(sqrt(PDL)+1)^2```````````` =(sqrt(PDL)-1)^2`````````` Target-4
225`````````````````````` =degree/180=225/180=1.25````````````` =(sqrt(PDL)+1.25)^2````````` =(sqrt(PDL)-1.25)^2``````` Target-5
270`````````````````````` =degree/180=270/180=1.5`````````````` =(sqrt(PDL)+1.5)^2`````````` =(sqrt(PDL)-1.5)^2```````` Target-6
315`````````````````````` =degree/180=315/180=1.75````````````` =(sqrt(PDL)+1.75)^2````````` =(sqrt(PDL)-1.75)^2``````` Target-7
360`````````````````````` =degree/180=360/180=2```````````````` =(sqrt(PDL)+2)^2```````````` =(sqrt(PDL)-2)^2`````````` Target-8
Based On Previous Days Close Price
(lets call it PDC)
Degree's````````````````` Degree Factor```````````````````````` Buy````````````````````````` Sell
11.25```````````````````` =degree/180=11.25/180=0.0625````````` =(sqrt(PDC)-0.0625)^2``````` =(sqrt(PDC)+0.0625)^2````` SL
22.5````````````````````` =degree/180=22.5/180=0.125``````````` =(sqrt(PDC)+0.125)^2```````` =(sqrt(PDC)-0.125)^2`````` Buy/Sell At
45``````````````````````` =degree/180=45/180=0.25`````````````` =(sqrt(PDC)+0.25)^2````````` =(sqrt(PDC)-0.25)^2``````` Target-1
90``````````````````````` =degree/180=90/180=0.5``````````````` =(sqrt(PDC)+0.5)^2`````````` =(sqrt(PDC)-0.5)^2```````` Target-2
135`````````````````````` =degree/180=135/180=0.75````````````` =(sqrt(PDC)+0.75)^2````````` =(sqrt(PDC)-0.75)^2``````` Target-3
180`````````````````````` =degree/180=180/180=1```````````````` =(sqrt(PDC)+1)^2```````````` =(sqrt(PDC)-1)^2`````````` Target-4
225`````````````````````` =degree/180=225/180=1.25````````````` =(sqrt(PDC)+1.25)^2````````` =(sqrt(PDC)-1.25)^2``````` Target-5
270`````````````````````` =degree/180=270/180=1.5`````````````` =(sqrt(PDC)+1.5)^2`````````` =(sqrt(PDC)-1.5)^2```````` Target-6
315`````````````````````` =degree/180=315/180=1.75````````````` =(sqrt(PDC)+1.75)^2````````` =(sqrt(PDC)-1.75)^2``````` Target-7
360`````````````````````` =degree/180=360/180=2```````````````` =(sqrt(PDC)+2)^2```````````` =(sqrt(PDC)-2)^2`````````` Target-8
example based On Today's Opening Price = 4339
Degree's```````` Degree Factor```````` Buy`````````` Sell
11.25``````````` 0.0625``````````````` 4330.77`````` 4347.24```````` SL
22.5```````````` 0.125```````````````` 4355.48`````` 4322.55```````` Buy/Sell At
45`````````````` 0.25````````````````` 4372.00`````` 4306.13```````` Target-1
90`````````````` 0.5`````````````````` 4405.12`````` 4273.38```````` Target-2
135````````````` 0.75````````````````` 4438.37`````` 4240.76```````` Target-3
180````````````` 1```````````````````` 4471.74`````` 4208.26```````` Target-4
225````````````` 1.25````````````````` 4505.24`````` 4175.88```````` Target-5
270````````````` 1.5`````````````````` 4538.86`````` 4143.64```````` Target-6
315````````````` 1.75````````````````` 4572.61`````` 4111.51```````` Target-7
360````````````` 2```````````````````` 4606.48`````` 4079.52```````` Target-8
Note : ignore the '`' , inserted them to fill up the spaces , it was looking very weird!, tried to fix it as much as I can.
Note :- Please correct me if I'm wrong , as I've already mentioned I don't have it's original documentation.
if anyone can find it or already has it then please feel free to share it.
nifty gann & 100 levelsnifty gannlevels with 100 points defference
gann levels with manual entry of cuurent gann level
manual entry of diffeence between two gann levels

Time Machine█ OVERVIEW
This script is designed to display future and current time resistance levels based on multiple techniques such as candle behaviors and count and some significant financial times according to Gann and more.
Each chart consists of an X-Axis ( time ) and a Y-Axis ( price ). Price can travel up and down giving you both support and resistance levels, on the other hand, time only travels forward which is why they are called time resistance levels.
Time resistance happens at multiple significant places. Have you noticed that when a triangle breaks north or south that the tip of the triangle acts as time resistance level where something happens ? Many patterns and techniques are designed
to detect and these levels through patters, candle behavior and more. This script aims to assist in detecting these levels ahead of time or at candle opens . This is a very important point. A signal of time resistance can be displayed at candle open
or ahead of time. both of these cases mean that the time resistance is confirmed. These resistance levels are rated on a scale from 0 to 3 and this scale could change and more filtering could be applied in the future to make this script
even more powerful. I would say this is a functional beta version ( v0.5 ) that could be improved upon and that's what I intend to do. scroll down to see if there are any other upgrades to this script. Each time frame has its own time resistance levels. Future levels could appear at any point;
for example, if there are no future time resistance levels within the next 6 days -lets say,- this does not mean that one doesn't appear tomorrow. A regular check would give you an edge in this script. Of course this is something that can be improved in the near future. This script does not reprint ( confirmed data does not change ) but more future data can be added no previous data.
Enjoy!
█ Future Plans and upgrades to this script may include :
1. Adding more astro influencers into the script.
2. Fine tuning the script a bit more to filter unwanted noise.
3. Adding toggle switches for users to select from. ( toggle between multiple techniques )
and more! feel free to let me know what you'd like to see!
█ How to use :
1. Put the script on your chart
give the script a few seconds and you should be set.
This script is coded as an addon to the Gann ToolBox package/scripts.

Planetary Speed█ OVERVIEW
This script is designed to measure the speed of planets from Mercury to Pluto by comparing longitude data across time.
Planetary Speed cycles are very important for those trading Gann theory / Time theory and for Astrology Traders alike. You can toggle the mode of the planet
from a heliocentric setting to a geocentric one. This script is especially important for those who want to research the market and observe the effects of planetary cycles.
Planetary Speed works better on markets that do not close at the moment and on selected time frames ( all the default tradingview timeframes except the monthly ).
This script can also plot 250 days of future data with ease.
█ Future Plans and upgrades to this script may include :
1. Capability to work on different markets that do not open 24/7.
2. Adding lunar and solar speed.
And more! Feel free to contact me with any feature that you would like to see in this script
█ How to use :
1. Open the settings.
2. Select the planet.
3. Choose between Heliocentric and Geocentric
Then Press OK & give the script a few seconds and you should be set. You can add this script to your chart more than once!
This script is coded as an addon to the Gann ToolBox package/scripts.

OMA-Filtered, Gann HiLo Activator [Loxx]OMA-Filtered, Gann HiLo Activator is a Gann HiLo activator that uses OMA filtering instead SMA filtering. This GHA calculation also includes a variable for close period to further tune the indicator.
What is Gann HiLo?
The HiLo Activator study is a trend-following indicator introduced by Robert Krausz as part of the Gann Swing trading strategy. In addition to indicating the current trend direction, this can be used as both entry signal and trailing stop.
Here is how the HiLo Activator is calculated:
1. The system calculates the moving averages of the high and low prices over the last several candles. By default, the average is calculated using the last three candles.
2. If the close price falls below the average low or rises above the average high, the system plots the opposite moving average. For example, if the price crosses above the average high, the system will plot the average low. If the price crosses below the average low afterward, the system will stop plotting the average low and will start plotting the average high, and so forth .
The plot of the HiLo Activator thus consists of sections on the top and bottom of the price plot. The sections on the bottom signify bullish trending conditions. Vice versa, those on the top signify the bearish conditions.
Included
-Toggle bar color on/off
Sun Ingress ZodiacHi Traders,
Astrological signs of the tropical zodiac remain fixed relative to seasonal markers, such as the equinox and solstice points on the sky’s dome.
The zodiac used for the calculations does not correspond to the astronomical zodiac, but to 12 zones of 30 degrees along the ecliptic, measured from the position of the Sun at the spring equinox. The ecliptic is the plane of the Earth’s orbit around the Sun.
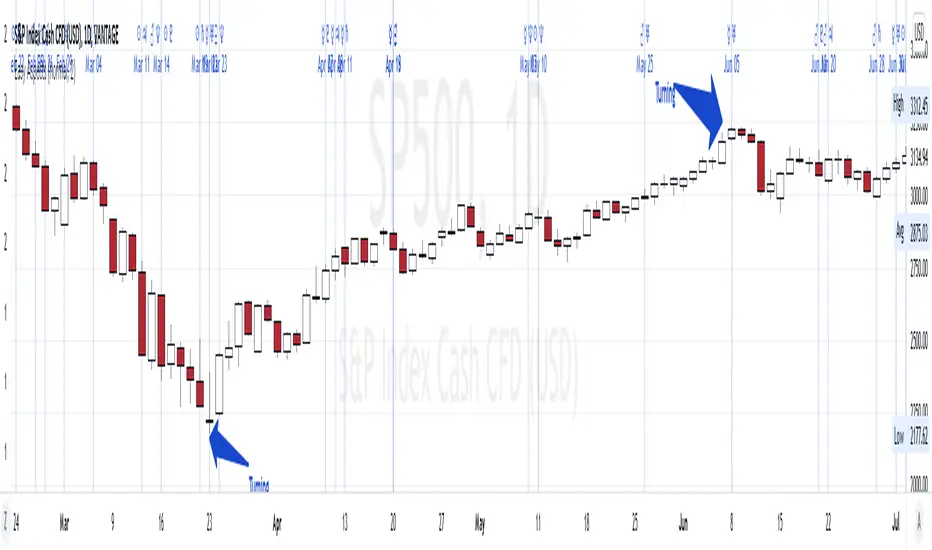
This script allows you see how Sun Ingress Zodiac can affect the Crypto, Stock, Indices & Commodity market.
The objectives of this script are:
1. you can see the Zodiac schedules in certain periods (earthsky.org)
2. you can see the correlation between Sun Ingress Zodiac and market reaction (is it turning or is it a swing high/ low? )
Those Dates are the Zodiac schedule (history & future), so when the Zodiac dates arrived, we can forecast the turning or swing high/low in the market (crypto, stocks, commodities & indices), the turning or swing high/low is +/- 1 day.
Those lines are just a simply vertical lines that can help us backtesting easily, hopefully we can take profit from this..
Here are some examples of the specific Zodiac affect:
Sun Ingress Aries
Sun Ingress Taurus
Sun Ingress Gemini
Sun Ingress Cancer
Sun Ingress Leo
Sun Ingress Virgo
Sun Ingress Libra
Sun Ingress Scorpio
Sun Ingress Sagittarius
Sun Ingress Capricorn
Sun Ingress Aquarius
Sun Ingress Pisces
PS:
when you subscribe, you will get:
1. Planetary Aspects & Transits (9 Planetary Ruler)
2. Retrogrades
3. Moon Phase, Moon Eclipse & 4 seasons
4. Easy Aspects (Trine & Sextile)
5. Hard Aspects (Opposition, Square & Conjunction)
6. Gann Seasonal Dates
7. Sun Ingress Zodiac

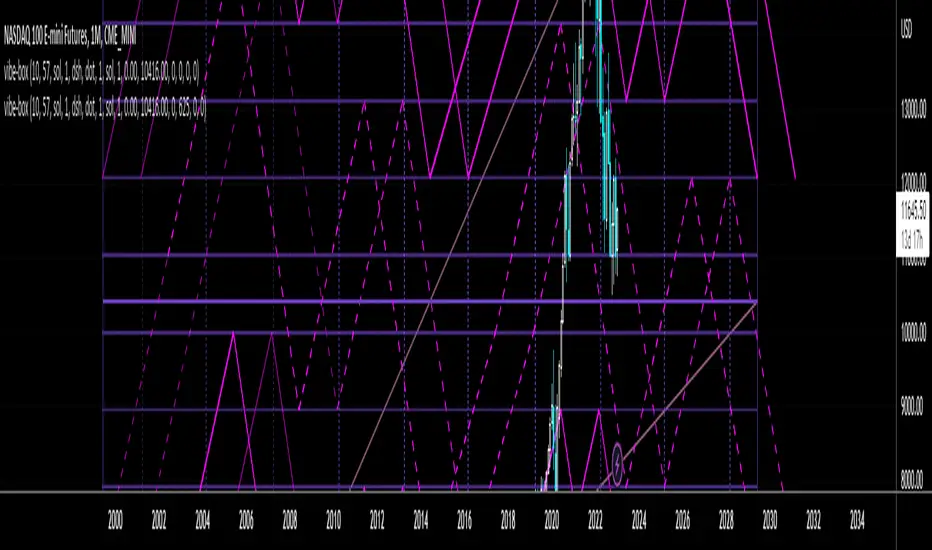
Vibration BoxFirst Public release of the Vibration Box
WARNING - THESE CYCLES CANNOT PREDICT PERFECT "UP & DOWN" MOTION
There is absolutely no guarantee that these cycles will predict perfect "up & down" motion for the markets
Please be aware that this tool is to be used with a robust risk management system
These cycles are representative of "circle geometry within a square of price & time"
Slowly, I will build up some ideas to go along with this script so that you can learn to apply it to many different markets in many different ways
Those familiar with the work of W.D. Gann should be able to utilize this tool in many different ways
Instructions:
Place the box down with 2 mouse clicks (first is for bottom left corner & second is for top right corner)
NOTE: DUE TO TRADINGVIEW LIMITATIONS
-There is a maximum of 12 divisions for your box/vibration (I will work on increasing this number)
-You MUST choose a coordinate that is within the price action that has already occurred
-You CANNOT initially place the box BEFORE THE FIRST BAR of data
-You CANNOT initially place the box BEYOND THE LAST BAR of data
THEN, ONCE YOU HAVE PLACED THE BOX FOR THE FIRST TIME
YOU CAN MANUALLY ADJUST THE DATES WITHIN THE SETTINGS TO PLACE THE BOX IN ANYWAY YOU WOULD LIKE!
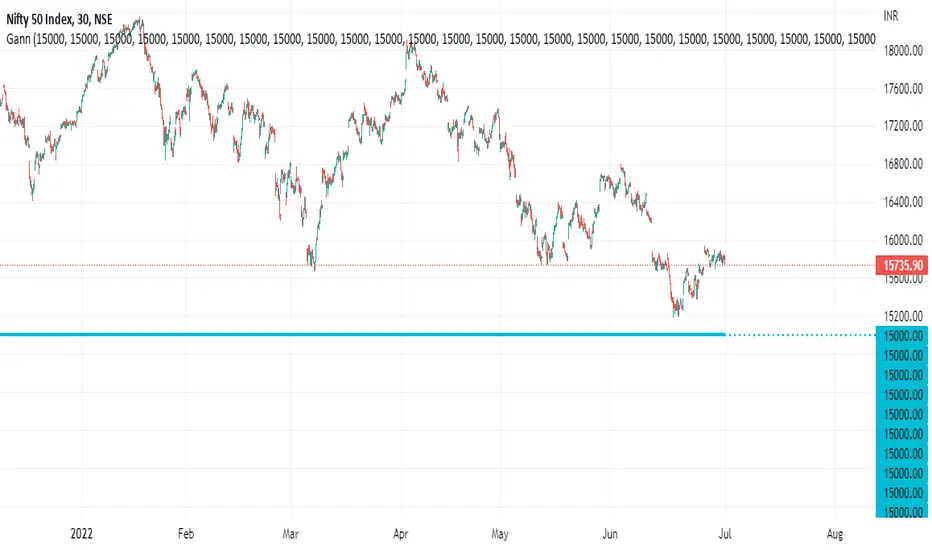
Gann Levels For Nifty Gann Levels for nifty 50 is very important to trade in options. so i create 50 gann levels for intraday trading.
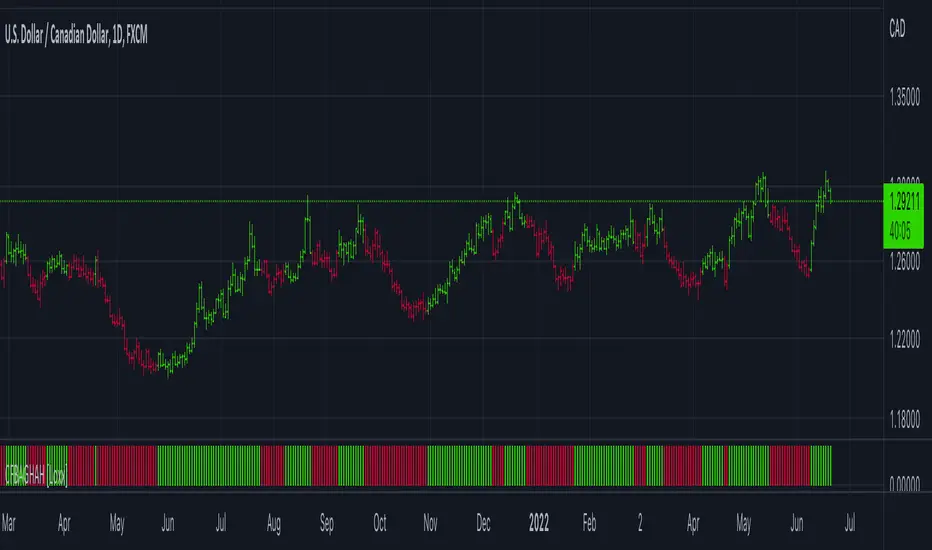
CFB Adaptive Gann HiLo Activator Histogram [Loxx]CFB Adaptive Gann HiLo Activator Histogram is a Composite-Fractal-Behavior-adaptive Gann HiLo activator in histogram form that has been smoothed using Jurik Filtering to reduce noise and better identify trending markets. This indicator is the CFB adaptive version of Jurik-Filtered, Gann HiLo Activator .
What is Gann HiLo
The HiLo Activator study is a trend-following indicator introduced by Robert Krausz as part of the Gann Swing trading strategy. In addition to indicating the current trend direction, this can be used as both entry signal and trailing stop.
Here is how the HiLo Activator is calculated:
1. The system calculates the moving averages of the high and low prices over the last several candles. By default, the average is calculated using the last three candles.
2. If the close price falls below the average low or rises above the average high, the system plots the opposite moving average. For example, if the price crosses above the average high, the system will plot the average low. If the price crosses below the average low afterward, the system will stop plotting the average low and will start plotting the average high, and so forth .
The plot of the HiLo Activator thus consists of sections on the top and bottom of the price plot. The sections on the bottom signify bullish trending conditions. Vice versa, those on the top signify the bearish conditions.
What is Composite Fractal Behavior ( CFB )?
All around you mechanisms adjust themselves to their environment. From simple thermostats that react to air temperature to computer chips in modern cars that respond to changes in engine temperature, r.p.m.'s, torque, and throttle position. It was only a matter of time before fast desktop computers applied the mathematics of self-adjustment to systems that trade the financial markets.
Unlike basic systems with fixed formulas, an adaptive system adjusts its own equations. For example, start with a basic channel breakout system that uses the highest closing price of the last N bars as a threshold for detecting breakouts on the up side. An adaptive and improved version of this system would adjust N according to market conditions, such as momentum, price volatility or acceleration.
Since many systems are based directly or indirectly on cycles, another useful measure of market condition is the periodic length of a price chart's dominant cycle, (DC), that cycle with the greatest influence on price action.
The utility of this new DC measure was noted by author Murray Ruggiero in the January '96 issue of Futures Magazine. In it. Mr. Ruggiero used it to adaptive adjust the value of N in a channel breakout system. He then simulated trading 15 years of D-Mark futures in order to compare its performance to a similar system that had a fixed optimal value of N. The adaptive version produced 20% more profit!
This DC index utilized the popular MESA algorithm (a formulation by John Ehlers adapted from Burg's maximum entropy algorithm, MEM). Unfortunately, the DC approach is problematic when the market has no real dominant cycle momentum, because the mathematics will produce a value whether or not one actually exists! Therefore, we developed a proprietary indicator that does not presuppose the presence of market cycles. It's called CFB (Composite Fractal Behavior) and it works well whether or not the market is cyclic.
CFB examines price action for a particular fractal pattern, categorizes them by size, and then outputs a composite fractal size index. This index is smooth, timely and accurate
Essentially, CFB reveals the length of the market's trending action time frame. Long trending activity produces a large CFB index and short choppy action produces a small index value. Investors have found many applications for CFB which involve scaling other existing technical indicators adaptively, on a bar-to-bar basis.
What is Jurik Volty used in the Juirk Filter?
One of the lesser known qualities of Juirk smoothing is that the Jurik smoothing process is adaptive. "Jurik Volty" (a sort of market volatility ) is what makes Jurik smoothing adaptive. The Jurik Volty calculation can be used as both a standalone indicator and to smooth other indicators that you wish to make adaptive.
What is the Jurik Moving Average?
Have you noticed how moving averages add some lag (delay) to your signals? ... especially when price gaps up or down in a big move, and you are waiting for your moving average to catch up? Wait no more! JMA eliminates this problem forever and gives you the best of both worlds: low lag and smooth lines.
Ideally, you would like a filtered signal to be both smooth and lag-free. Lag causes delays in your trades, and increasing lag in your indicators typically result in lower profits. In other words, late comers get what's left on the table after the feast has already begun.
Included
-Toggle bar color on/off
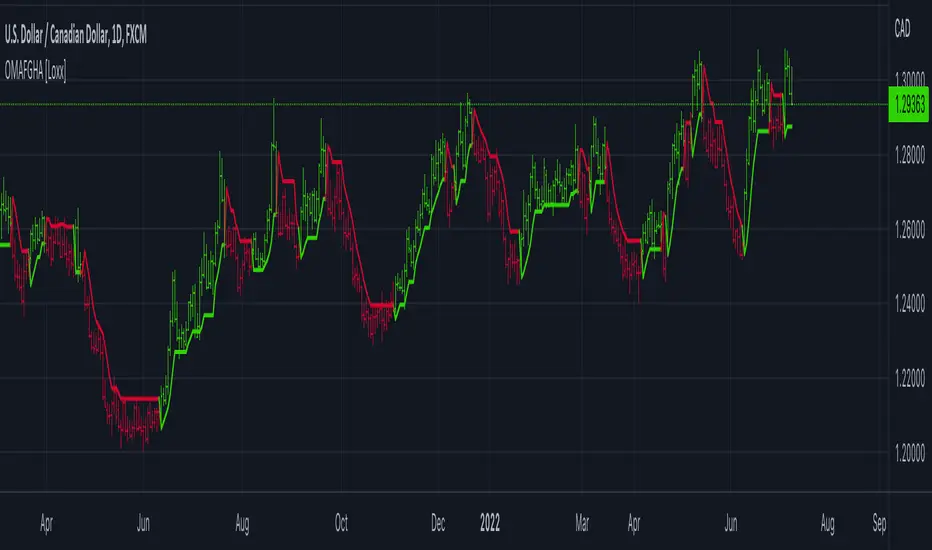
Jurik-Filtered, Gann HiLo Activator [Loxx]Jurik-Filtered, Gann HiLo Activator is a Gann HiLo activator that has been smoothed using Jurik Filtering to reduce noise and better identify trending markets.
What is Gann HiLo
The HiLo Activator study is a trend-following indicator introduced by Robert Krausz as part of the Gann Swing trading strategy. In addition to indicating the current trend direction, this can be used as both entry signal and trailing stop.
Here is how the HiLo Activator is calculated:
1. The system calculates the moving averages of the high and low prices over the last several candles. By default, the average is calculated using the last three candles.
2. If the close price falls below the average low or rises above the average high, the system plots the opposite moving average. For example, if the price crosses above the average high, the system will plot the average low. If the price crosses below the average low afterward, the system will stop plotting the average low and will start plotting the average high, and so forth.
The plot of the HiLo Activator thus consists of sections on the top and bottom of the price plot. The sections on the bottom signify bullish trending conditions. Vice versa, those on the top signify the bearish conditions.
What is Jurik Volty used in the Juirk Filter?
One of the lesser known qualities of Juirk smoothing is that the Jurik smoothing process is adaptive. "Jurik Volty" (a sort of market volatility ) is what makes Jurik smoothing adaptive. The Jurik Volty calculation can be used as both a standalone indicator and to smooth other indicators that you wish to make adaptive.
What is the Jurik Moving Average?
Have you noticed how moving averages add some lag (delay) to your signals? ... especially when price gaps up or down in a big move, and you are waiting for your moving average to catch up? Wait no more! JMA eliminates this problem forever and gives you the best of both worlds: low lag and smooth lines.
Ideally, you would like a filtered signal to be both smooth and lag-free. Lag causes delays in your trades, and increasing lag in your indicators typically result in lower profits. In other words, late comers get what's left on the table after the feast has already begun.
Included
-Toggle bar color on/off

NhaDuHanhFX - Gann SwingsThe swings indicator follows the smallest movements of price action. Can monitor and analyze the context of the market, trying to find bias of each timeframe.
If there is a candlestick completely above the previous swinghigh. It shows a good bullish momentum. The market is favoring the upward direction. If the candlestick is still in the previous swinghigh range, it shows a weak bullish momentum. The market is reluctant to go up.
If there is a candlestick completely below the previous swinglow. It presents a good bearish momentum. The market is favoring the downward direction. If the candlestick is still in the previous swinglow range, it shows a weak bearish momentum. The market is reluctant to go down.

Gann Swing Chart [One-Bar]"Gann used three types of swings chart.
One-Bar Swing Chart (1-Bar Swing Chart): The One-Bar Swing Chart, or Minor Trend Chart, follows the one-bar movements of the market. From a low price, each time the market makes a higher-high than the previous bar, a One-Bar trend line moves up from the recent low to the new high. This action makes the previous low price a One-Bar bottom. From a high price each time the market makes a lower-low than the previous bar, a One-Bar swing line moves down from the recent high to the new low. This action makes the previous high price a One-Bar top.
The combination of One-Bar tops and bottoms forms the One-Bar trend indicator chart. The crossing of a One-Bar swing top changes the One-Bar trend to up. The penetration of a One-Bar swing bottom changes the One-Bar trend to down."
This Indicator only show Gann Swing Chart use One-Bar type.

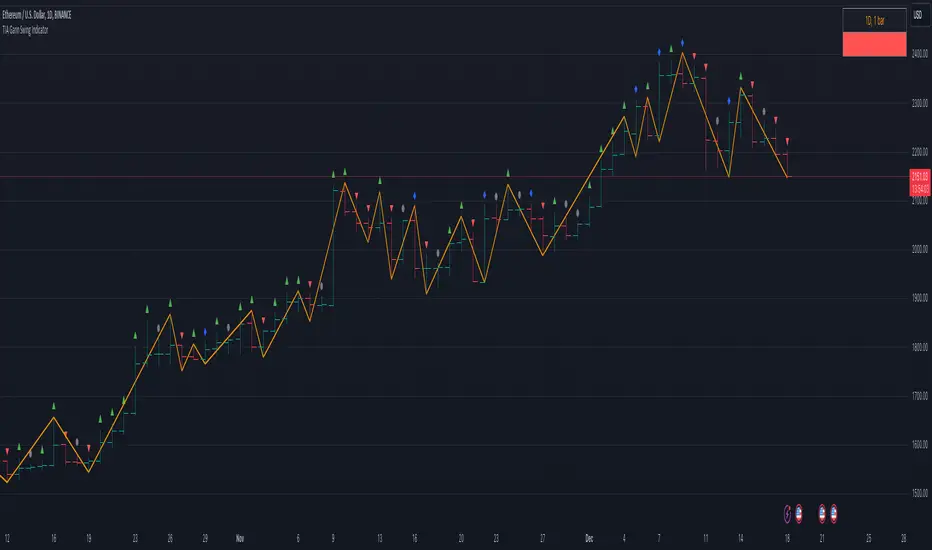
TIA Gann Swing IndicatorTIA Gann Swing Indicator
This indicator is a mechanical tool that tells the user exactly what the market trend is at any time, based on the teachings of Legendary trader, Mr. William D. Gann .
Gann called this tool the “Trendline Indicator,” but it has popularly become known as the “Swing Chart” by present-day traders.
In October 1909, Richard Wyckoff watched Gann for 25 market days (the markets traded on Saturdays back then), where Gann made 286 trades, both long and short. Two hundred sixty-four (264) of these trades were profits.
The Swing Chart was Gann’s primary trading tool helping him achieve these phenomenal trading results.
This indicator, now available to you in TradingView, automatically displays the swing chart and trend on any timeframe.
Selecting “Show Trend,” will light the background of the chart up, showing if the trend is “Up,” “Down,” or “Uncertain.”
The indicator is also fully customizable to display “Break Lines,” which indicate potential trend changes ahead of time.
Additional features include data about each bar and swing to give the user vital information, and the data points currently available include:
Bar Type
This indicator selection allows the user to identify precisely what each bar is, as per WD Gann’s Instructions.
Each of the 4 bar types includes:
Up bars, Down bars, Inside bars, Outside bars
Date
Displaying the date of swing tops and bottoms allows the user to stay on top of significant announcements and events in the economy. Often, market reversals occur right around critical economic events.
Time
This indicator selection allows the user to identify the time of the swing tops and swing bottoms. Designed for intra-day traders, this setting displays the exact time of tops and bottoms on any timeframe to help stay ahead of any important announcement.
Price
Price analysis is critical for every technical analyst, and displaying the price of swing tops and bottoms allows the trader or investor to stay on top of essential pivot points in the market. Identifying potential support and resistance levels keeps traders ahead of the herd.
Range
Identifying each swing’s price range gives the trader or investor critical information. Have you ever wondered if a market is gaining momentum or losing momentum? Knowing if price ranges are expanding or contracting is key, and this setting quickly displays what every swing range is doing.
Bar Count
What is the average number of bars up or down? Markets can only move in one direction for so many bars before a reversal. Simply displaying the number of bars between each swing gives the analyst valuable insights into overbought or oversold trends. Gann's famous “7-10 bar” rule identifies potential reversals, and this simple indicator setting can help any market participant stay ahead of the pack.
The TIA Gann Swing Indicator is an indicator that EVERY trader & investor should have at their fingertips. It is critical for long-term investors and short-term traders to know the trend of their market and vital information about the upswings and downswings. The TIA Gann Swing Indicator is the indicator to help.
See the Author's instructions below to get access to this package.
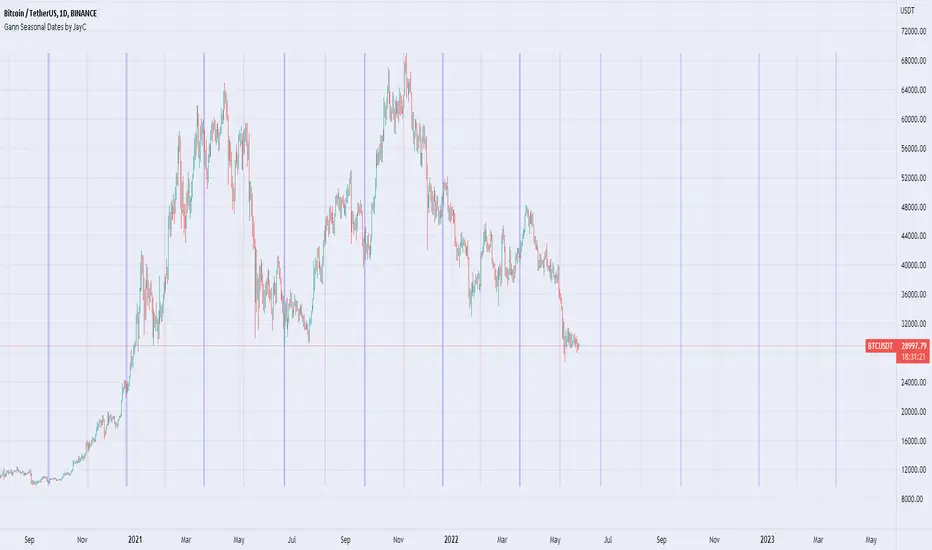
Gann Seasonal Dates by JayCThis script marks important seasonal dates with a vertical line that Gann used to watch for Trend changes.
March 21st
June 22nd
September 23rd
December 22nd
And 50% Levels - Minor seasonal dates.
February 4th
May 6th
August 8th
November 7th
In the settings you can change line colors and toggle the Offset. Offset is the way the script draws lines to show future dates, I offset by 365 so it will show incorrectly at some points in back testing.
Easy AspectsHi Traders,
Planetary Aspects divided into 2 parts, Hard (Square and Opposition) & Easy (Trine and Sextile) Aspects, the Conjunction is depending on the planets.
This Easy Aspects script, contains:
1. Trine is an angle of 120°, which is 1/3 of the 360° ecliptic
2. Sextile is an angle of 60°, which is 1/6 of the 360° ecliptic or 1/2 a trine (120°)
The objectives of this script are:
1. you can see the Hard Aspects schedule in certain periods, history and future.. (you can double check it in horoscopes.astro-seek.com )
2. this script allows you see based on specific aspect view, you can observe the correlation between the hard aspects and market reaction (is it turning or is it a swinghigh/ low?
Here are some examples;
TRINE
Sextile
Hard Aspects Hi Traders,
Planetary Aspects divided into 2 parts, Hard (Square and Opposition) & Easy (Trine and Sextile) Aspects, the Conjunction is depending on the planets.
This Hard Aspects script, contains:
1. Square is an angle of 90°, which is 1/4 of the 360° ecliptic or 1/2 an opposition (180°)
2. Opposition is an angle of 180°, which is 1/2 of the 360° ecliptic
3. Conjunction is an angle of approximately (~) 0–10°. Typically, an orb of ~10° is considered to be a Conjunction ( I include Opposition in this script).
The objectives of this script are:
1. you can see the Hard Aspects schedule in certain periods, history and future.. (you can double check it in horoscopes.astro-seek.com )
2. this script allows you see based on specific aspect view, you can observe the correlation between the hard aspects and market reaction (is it turning or is it a swinghigh/ low?
Here are some examples;
SQUARE:
OPPOSITION
CONJUNCTION

Planetary Angles█ OVERVIEW
This script is designed to display dates where a selected planet passes through a degree of your choice! You can select between planets from Mercury to Pluto on both Geocentric settings and Heliocentric settings.
The script also lets you play with styling of how these should be labeled or viewed on your chart!
█ Future Plans and upgrades to this script may include :
1. Integrate statistics and repeat functionality
2. More future dates plotting.
And more! Feel free to contact me with any feature that you would like to see in this script
█ How to use :
1. Open the settings.
2. Enable the Planetary Angles script
3. Select your desired planet
4. Pick your angle.
5. Select between Heliocentric / Geocentric
Then Press OK & give the script a few seconds and you should be set. You can add this script to your chart more than once!
This script is coded as an addon to the Gann ToolBox package/scripts.

Gann Square Range - majalad
s3.tradingview.com
Price and Time squaring is one of the main concepts that W.D. Gann introduced and talked about in his books. This script uses those techniques to Square a Range that you specify on the chart.
Using this script you can square the chart based on:
Price
Time
Both Price and Time
You can also choose to square based on the price, price squared or square root of the price with a lot of customization and coloring options. You have the overall control to change any part of the script including lines colors, style, thickness, fill colors and so on.
Please note that although the script tries to set the direction and the price per point automatically for you, sometimes for very fast or very slow instruments you will need to define the price per point for the instrument that you are dealing with.
How to use
Once you add the script, you will need the 2 points associated with the Range you want to square. The script will prompt you to select the first point on the chart then the second point.
The script will calculate the price per point and the trend direction for you automatically.
If needed, you can change the price per point and the direction from the settings.
You can also select to add multiple boxes for the same squared range
Please PM me for access or for any question.

Time TradesThese indicators are part of the Time Trades service.
This script includes 2 timing indicators:
* Cheat Code displays green and purple timing periods
* Gann Waves displays yellow and blue vertical bars
Both indicators are based on natural cycles, and are visible into the future.
Visibility of both indicators is controlled via the Settings menu.
Cheat Code:
* Displays green periods and purple periods.
* Prices seem to trend more within a green period, both up and down.
* Often there’s major pivots around the middle of a green period, and about 3/4 through.
* Prices seem to chop more within a purple period with lots of volatility and reversals.
* Thin light grey lines appear at regular intervals that tend to align with local pivots.
* Thick grey lines appear around the middle of the green period that tens to align with major pivots
* You can use this information to vary your trading strategy to better match the expected price behavior.
Gann Waves
* Displays yellow and purple vertical bands that tend to align with local pivots.
* You can match this up with the symbol you’re analyzing to see what patterns tend to happen during similar periods.
* Sometimes stocks will make local highs for 3-4 yellow periods in a row, and then make a lower high. This would indicate a potential change in trend.

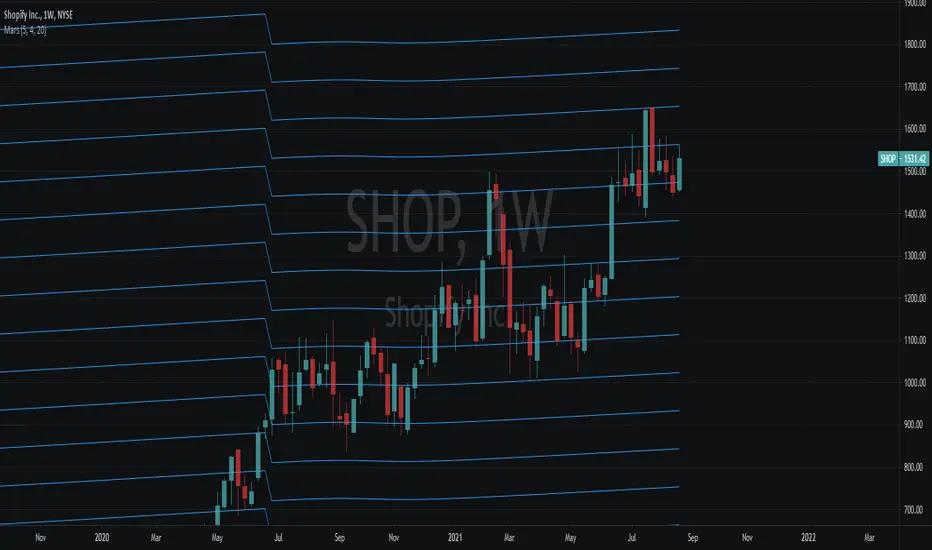
Noya Alpha - Mars Planetary LinesOne of W.D. Gann's most powerful planetary tools was the Gann Planetary Lines. These convert planetary angles to price in order to determine areas of support and resistance. Like many of W.D. Gann's other tools, these can be very very accurate with the right settings but requires user input and tuning to refine the lines to fit each individual asset's price action.
Inputs:
Radix : Default is 1. This represents the price/angle scale, adjust this in multiplies of 2 for best results. Negative and decimal values are supported and encouraged for use as well.
Angle Divisions (stdsplit) : The amount each major angle is split.
Number of Lines : Number of Plots to draw.
Featured are also crossovers for when the planet moves across each major area into a new constellation.
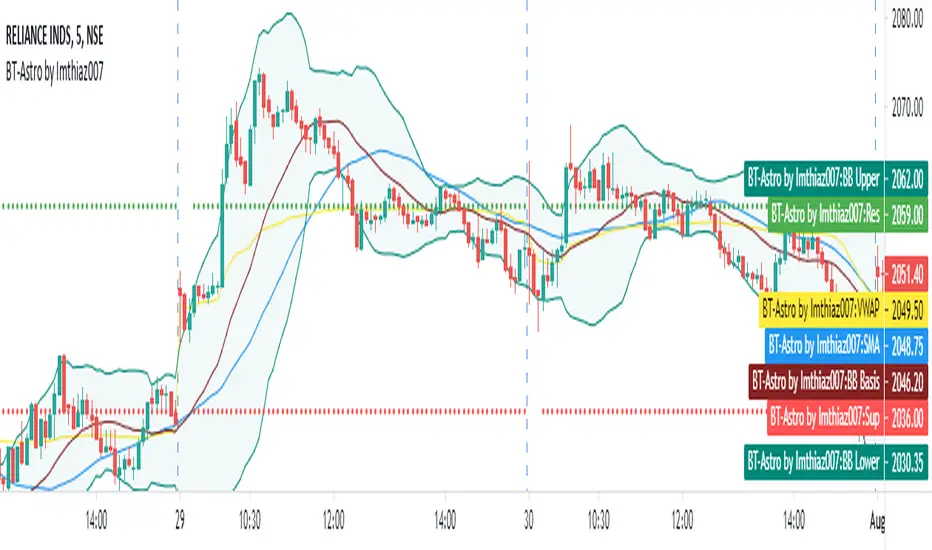
BT Astrology Indicator by Imthiaz007
BT-Astrology Indicator is fine tuned indicator to calculate and draw daly support and resistance based on Gann level for intraday trade or swing trade.
The original Idea is given by Mr. Alex from Badshai Trading; I am a Software Developer by profession so that I just coded it and add some signals for back testing.
I also add following Indicator for better view:
a) Simple Moving Average
b) VWAP
c) Bollinger Band
The Input section of the Indicator :
SMA :- Length 35 as per Mr. Alex suggestion
Minutes : Enter minutes in terms of number of minutes on which VWAP value will be taken for calculating the levels.
By default it will be 20 means VWAP value of 9:35 AM candle will be consider for drawing levels.
How it works ?
Buy : When resistance is broken with higher high formation and candle is above 35 SMA
Sell : When support is broken with lower low formation and candle is below 35 SMA
Hope you like it!!!