Metallic Retracement ToolI made a version of the Metallic Retracement script where instead of using automatic zig-zag detection, you get to place the points manually. When you add it to the chart, it prompts you to click on two points. These two points become your swing range, and the indicator calculates all the metallic retracement levels from there and plots them on your chart. You can drag the points around afterwards to adjust the range, or just add the indicator to the chart again to place a completely new set of points.
The mathematical foundation is identical to the original Metallic Retracement indicator. You're still working with metallic means, which are the sequence of constants that generalize the golden ratio through the equation x² = kx + 1. When k equals 1, you get the golden ratio. When k equals 2, you get silver. Bronze is 3, and so on forever. Each metallic number generates its own set of retracement ratios by raising alpha to various negative powers, where alpha equals (k + sqrt(k² + 4)) / 2. The script algorithmically calculates these levels instead of hardcoding them, which means you can pick any metallic number you want and instantly get its complete retracement sequence.
What's different here is the control. Automatic zig-zag detection is useful when you want the indicator to find swings for you, but sometimes you have a specific price range in mind that doesn't line up with what the zig-zag algorithm considers significant. Maybe you're analyzing a move that's still developing and hasn't triggered the zig-zag's reversal thresholds yet. Maybe you want to measure retracements from an arbitrary high to an arbitrary low that happened weeks apart with tons of noise in between. Manual placement lets you define exactly which two points matter for your analysis without fighting with sensitivity settings or waiting for confirmation.
The interactive placement system uses TradingView's built-in drawing tools, so clicking the two points feels natural and works the same way as drawing a trendline or fibonacci retracement. First click sets your starting point, second click sets your ending point, and the indicator immediately calculates the range and draws all the metallic levels extending from whichever point you chose as the origin. If you picked a swing low and then a swing high, you get retracement levels projecting upward. If you went from high to low, they project downward.
Moving the points after placement is as simple as grabbing one of them and dragging it to a new location. The retracement levels recalculate in real-time as you move the anchor points, which makes it easy to experiment with different range definitions and see how the levels shift. This is particularly useful when you're trying to figure out which swing points produce retracement levels that line up with other technical features like previous support or resistance zones. You can slide the points around until you find a configuration that makes sense for your analysis.
Adding the indicator to the chart multiple times lets you compare different metallic means on the same price range, or analyze multiple ranges simultaneously with different metallic numbers. You could have golden ratio retracements on one major swing and silver ratio retracements on a smaller correction within that swing. Since each instance of the indicator is independent, you can mix and match metallic numbers and ranges however you want without one interfering with the other.
The settings work the same way as the original script. You select which metallic number to use, control how many power ratios to display above and below the 1.0 level, and adjust how many complete retracement cycles you want drawn. The levels extend from your manually placed swing points just like they would from automatically detected pivots, showing you where price might react based on whichever metallic mean you've selected.
What this version emphasizes is that retracement analysis is subjective in terms of which swing points you consider significant. Automatic detection algorithms make assumptions about what constitutes a meaningful reversal, but those assumptions don't always match your interpretation of the price action. By giving you manual control over point placement, this tool lets you apply metallic retracement concepts to exactly the price ranges you care about, without requiring those ranges to fit someone else's definition of a valid swing. You define the context, the indicator provides the mathematical framework.
Fibs

Metallic Retracement LevelsThere's something that's always bothered me about how traders use Fibonacci retracements. Everyone treats the golden ratio like it's the only game in town, but mathematically speaking, it's completely arbitrary. The golden ratio is just the first member of an infinite family of metallic means, and there's no particular reason why 1.618 should be special for markets when we have the silver ratio at 2.414, the bronze ratio at 3.303, and literally every other metallic mean extending to infinity. We just picked one and decided it was magical.
The metallic means are a sequence of mathematical constants that generalize the golden ratio. They're defined by the equation x² = kx + 1, where k is any positive integer. When k equals 1, you get the golden ratio. When k equals 2, you get the silver ratio. When k equals 3, you get bronze, and so on forever. Each metallic mean generates its own set of ratios through successive powers, just like how the golden ratio gives you 0.618, 0.382, 0.236 and so forth. The silver ratio produces a completely different set of retracement levels, as does bronze, as does any arbitrary metallic number you want to choose.
This indicator calculates these metallic means using the standard alpha and beta formulas. For any metallic number k, alpha equals (k + sqrt(k² + 4)) / 2, and we generate retracement ratios by raising alpha to various negative powers. The script algorithmically generates these levels instead of hardcoding them, which is how it should have been done from the start. It's genuinely silly that most fib tools just hardcode the ratios when the math to generate them is straightforward. Even worse, traditional fib retracements use 0.5 as a level, which isn't even a fibonacci ratio. It's just thrown in there because it seems like it should be important.
The indicator works by first detecting swing points using the Sylvain Zig-Zag . The zig-zag identifies significant price swings by combining percentage change with ATR adjustments, filtering out noise and connecting major pivot points. This is what drives the retracement levels. Once a new swing is confirmed, the script calculates the range between the last two pivot points and generates metallic retracement levels from the most recent swing low or high.
You can adjust which metallic number to use (golden, silver, bronze, or any positive integer), control how many power ratios to display above and below the 1.0 level, and set how many complete retracement cycles you want drawn. The levels extend from the swing point and show you where price might react based on whichever metallic mean you've selected. The zig-zag settings let you tune the sensitivity of swing detection through ATR period, ATR multiplier, percentage reversal, and additional absolute or tick-based reversal values.
What this really demonstrates is that retracement analysis is more flexible than most traders realize. There's no mathematical law that says markets must respect the golden ratio over any other metallic mean. They're all valid mathematical constructs with the same kind of recursive properties. By making this tool, I wanted to highlight that using fibonacci retracements involves an arbitrary choice, and maybe that choice should be more deliberate or at least tested against alternatives. You can experiment with different metallic numbers and see which ones seem to work better for your particular market or timeframe, or just use this to understand that the standard fib levels everyone uses aren't as fundamental as they appear.

Premium Discount Range ProPremium Discount Range Pro
Short Description / Summary:
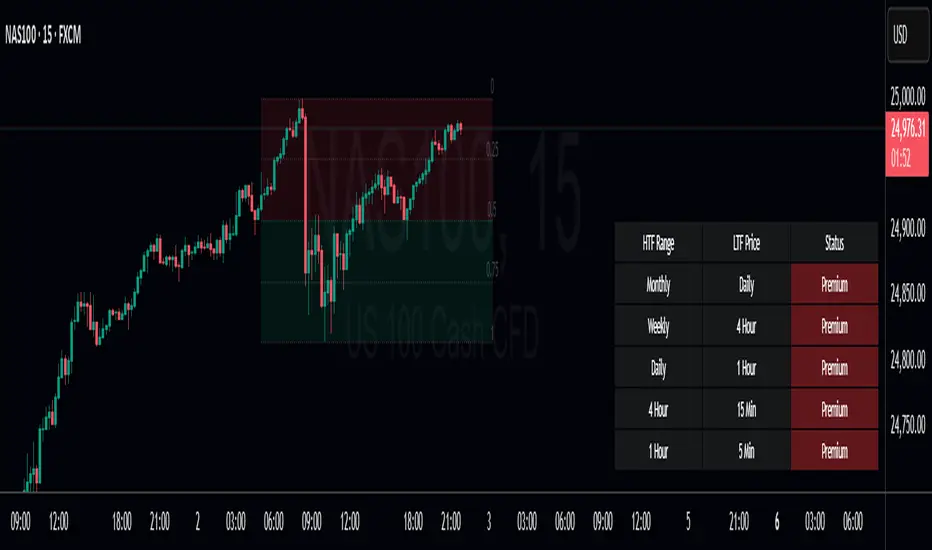
An advanced, all-in-one toolkit for traders who utilize Smart Money Concepts (SMC) and institutional price action analysis. The "Premium Discount Range Pro" automatically identifies the current higher timeframe (HTF) dealing range, visualizes the Premium, Discount, and Equilibrium zones, and provides a multi-timeframe dashboard to see where the current price stands across the market.
This indicator is built to streamline your analysis, helping you to quickly identify high-probability areas for entries by adhering to the core institutional principle: look for buys in a discount and sells in a premium.
Key Features:
Automatic HTF Range Detection: The indicator automatically detects the most recent significant swing high and swing low on your chosen Higher Timeframe (e.g., 4H, Daily) to define the current dealing range.
Premium & Discount Zone Visualization: Clear, color-coded boxes are drawn to represent the Premium (sell zone), Discount (buy zone), and the crucial Equilibrium (50%) level. These boxes extend into the future so you can anticipate future price action.
Customizable Fibonacci Levels: Plot key Fibonacci retracement levels within the defined range. You can customize which levels you want to see (e.g., 0.62, 0.79, etc.) to pinpoint specific points of interest.
Multi-Timeframe Confluence Table: A powerful, on-screen dashboard that shows you the status of the current price relative to the P&D zones on up to 5 different timeframes simultaneously. Instantly see if the price is in a Premium or Discount zone on the 15m, 1H, 4H, and Daily charts at a single glance.
Built-in Alerts: Never miss an opportunity. Set up alerts to be notified the moment the price enters the Premium or Discount zone on your chosen HTF, allowing you to prepare for potential trade setups.
Fully Customizable: Take full control over the indicator's appearance. Adjust pivot lookback periods, colors of the zones and Fibs, and select which timeframes appear in your dashboard to match your personal trading plan.
Disclaimer
This indicator is provided for educational and informational purposes only and should not be considered as financial or investment advice. Trading and investing in financial markets, including but not limited to stocks, forex, and cryptocurrencies, involves a substantial risk of loss and is not suitable for every investor.
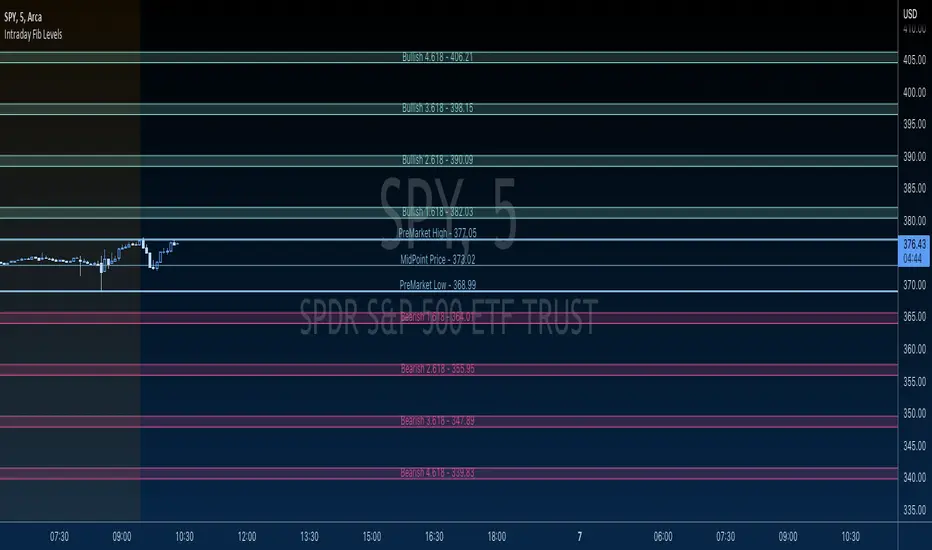
Intraday Fibs RetracementFibonacci (Fibs) levels are often used by traders as a way to find support and resistance, based on the Fibonacci sequence. These levels are widely used in technical analysis to identify potential reversal points in the price of an asset.
Fibs retracement draws lines at these Fibs level between a significant high and low point on a price chart.
What it shows:
This indicator will automatically draw Fibs Retracement Levels on your chart without any manual work.
It is designed to be used for day trading, especially in scenarios where a ticker gaps up/down large compared to the prior day close. (i.e. scenario where the difference of day's open and prior day close is large)
The drawing will happen on each trading day the moment trading hours open, and will NOT draw during pre-market and post-market.
User can see the line of each Fibs level, labelled with the Fib percentage and price value for the corresponding levels.
User will specify a start and end point of Fibs and based on the choice the indicator will automatically compute the other user defined Fibs levels and display on the chart.
How to use it:
The Fib levels drawn can be a potential support and resistance zone. Therefore in scenario where you already have a position and are approaching one of these levels it could be a point to close out some or all the position as you are approaching a resistance. On the other hand when price do approach these levels you could enter a position for a reversal trade. These are few ways to use the indicator but there are other ways that can be used, which can be found out by researching "Fibonacci (Fibs) Retracement".
In the example on the chart you can see a price bounce from the 0.7886 Fibs level on this particular day, where the price gapped up and was coming down after market hours opened.
Key settings:
1. Fibs Retracement Start and end Point: User selects where the Fibs levels should be drawn.
Available Options are:
Start Points:
Market Open
Market Open High (Dependent on the time frame you are on)
Pre-market High
Day's High
End Points:
Previous Day Close
Previous Day Low
Previous Day High
Pre-market Low (Current Day)
Day's Low
2. Custom Fib Levels: User can manually enter the Fib levels they want to see. (Max 9)
Default values are: 0,0.236,0.382,0.5,0.618,0.786,1,1.618,2.618.
3. Display settings: User can specify the line colour, thickness and style.
4. Label Setting: User can choose to turn on/off the labels for the each Fibs Level. Label will show the fib percentage and the corresponding price. User can also choose the location of the labels, defined by an offset from the current candle.
----------------------------------------------------------------------
If anything is not clear please let me know!

GIGANEVA V6.61 PublicThis enhanced Fibonacci script for TradingView is a powerful, all-in-one tool that calculates Fibonacci Levels, Fans, Time Pivots, and Golden Pivots on both logarithmic and linear scales. Its ability to compute time pivots via fan intersections and Range interactions, combined with user-friendly features like Bool Fib Right, sets it apart. The script maximizes TradingView’s plotting capabilities, making it a unique and versatile tool for technical analysis across various markets.
1. Overview of the Script
The script appears to be a custom technical analysis tool built for TradingView, improving upon an existing script from TradingView’s Community Scripts. It calculates and plots:
Fibonacci Levels: Standard retracement levels (e.g., 0.236, 0.382, 0.5, 0.618, etc.) based on a user-defined price range.
Fibonacci Fans: Trendlines drawn from a high or low point, radiating at Fibonacci ratios to project potential support/resistance zones.
Time Pivots: Points in time where significant price action is expected, determined by the intersection of Fibonacci Fans or their interaction with key price levels.
Golden Pivots: Specific time pivots calculated when the 0.5 Fibonacci Fan (on a logarithmic or linear scale) intersects with its counterpart.
The script supports both logarithmic and linear price scales, ensuring versatility across different charting preferences. It also includes a feature to extend Fibonacci Fans to the right, regardless of whether the user selects the top or bottom of the range first.
2. Key Components Explained
a) Fibonacci Levels and Fans from Top and Bottom of the "Range"
Fibonacci Levels: These are horizontal lines plotted at standard Fibonacci retracement ratios (e.g., 0.236, 0.382, 0.5, 0.618, etc.) based on a user-defined price range (the "Range"). The Range is typically the distance between a significant high (top) and low (bottom) on the chart.
Example: If the high is $100 and the low is $50, the 0.618 retracement level would be at $80.90 ($50 + 0.618 × $50).
Fibonacci Fans: These are diagonal lines drawn from either the top or bottom of the Range, radiating at Fibonacci ratios (e.g., 0.382, 0.5, 0.618). They project potential dynamic support or resistance zones as price evolves over time.
From Top: Fans drawn downward from the high of the Range.
From Bottom: Fans drawn upward from the low of the Range.
Log and Linear Scale:
Logarithmic Scale: Adjusts price intervals to account for percentage changes, which is useful for assets with large price ranges (e.g., cryptocurrencies or stocks with exponential growth). Fibonacci calculations on a log scale ensure ratios are proportional to percentage moves.
Linear Scale: Uses absolute price differences, suitable for assets with smaller, more stable price ranges.
The script’s ability to plot on both scales makes it adaptable to different markets and user preferences.
b) Time Pivots
Time pivots are points in time where significant price action (e.g., reversals, breakouts) is anticipated. The script calculates these in two ways:
Fans Crossing Each Other:
When two Fibonacci Fans (e.g., one from the top and one from the bottom) intersect, their crossing point represents a potential time pivot. This is because the intersection indicates a convergence of dynamic support/resistance zones, increasing the likelihood of a price reaction.
Example: A 0.618 fan from the top crosses a 0.382 fan from the bottom at a specific bar on the chart, marking that bar as a time pivot.
Fans Crossing Top and Bottom of the Range:
A fan line (e.g., 0.5 fan from the bottom) may intersect the top or bottom price level of the Range at a specific time. This intersection highlights a moment where the fan’s projected support/resistance aligns with a key price level, signaling a potential pivot.
Example: The 0.618 fan from the bottom reaches the top of the Range ($100) at bar 50, marking bar 50 as a time pivot.
c) Golden Pivots
Definition: Golden pivots are a special type of time pivot calculated when the 0.5 Fibonacci Fan on one scale (logarithmic or linear) intersects with the 0.5 fan on the opposite scale (or vice versa).
Significance: The 0.5 level is the midpoint of the Fibonacci sequence and often acts as a critical balance point in price action. When fans at this level cross, it suggests a high-probability moment for a price reversal or significant move.
Example: If the 0.5 fan on a logarithmic scale (drawn from the bottom) crosses the 0.5 fan on a linear scale (drawn from the top) at bar 100, this intersection is labeled a "Golden Pivot" due to its confluence of key Fibonacci levels.
d) Bool Fib Right
This is a user-configurable setting (a boolean input in the script) that extends Fibonacci Fans to the right side of the chart.
Functionality: When enabled, the fans project forward in time, regardless of whether the user selected the top or bottom of the Range first. This ensures consistency in visualization, as the direction of the Range selection (top-to-bottom or bottom-to-top) does not affect the fan’s extension.
Use Case: Traders can use this to project future support/resistance zones without worrying about how they defined the Range, improving usability.
3. Why Is This Code Unique?
Original calculation of Log levels were taken from zekicanozkanli code. Thank you for giving me great Foundation, later modified and applied to Fib fans. The script’s uniqueness stems from its comprehensive integration of Fibonacci-based tools and its optimization for TradingView’s plotting capabilities. Here’s a detailed breakdown:
All-in-One Fibonacci Tool:
Most Fibonacci scripts on TradingView focus on either retracement levels, extensions, or fans.
This script combines:
Fibonacci Levels: Static horizontal lines for retracement and extension.
Fibonacci Fans: Dynamic trendlines for projecting support/resistance.
Time Pivots: Temporal analysis based on fan intersections and Range interactions.
Golden Pivots: Specialized pivots based on 0.5 fan confluences.
By integrating these functions, the script provides a holistic Fibonacci analysis tool, reducing the need for multiple scripts.
Log and Linear Scale Support:
Many Fibonacci tools are designed for linear scales only, which can distort projections for assets with exponential price movements. By supporting both logarithmic and linear scales, the script caters to a wider range of markets (e.g., stocks, forex, crypto) and user preferences.
Time Pivot Calculations:
Calculating time pivots based on fan intersections and Range interactions is a novel feature. Most TradingView scripts focus on price-based Fibonacci levels, not temporal analysis. This adds a predictive element, helping traders anticipate when significant price action might occur.
Golden Pivot Innovation:
The concept of "Golden Pivots" (0.5 fan intersections across scales) is a unique addition. It leverages the symmetry of the 0.5 level and the differences between log and linear scales to identify high-probability pivot points.
Maximized Plot Capabilities:
TradingView imposes limits on the number of plots (lines, labels, etc.) a script can render. This script is coded to fully utilize these limits, ensuring that all Fibonacci levels, fans, pivots, and labels are plotted without exceeding TradingView’s constraints.
This optimization likely involves efficient use of arrays, loops, and conditional plotting to manage resources while delivering a rich visual output.
User-Friendly Features:
The Bool Fib Right option simplifies fan projection, making the tool intuitive even for users who may not consistently select the Range in the same order.
The script’s flexibility in handling top/bottom Range selection enhances usability.
4. Potential Use Cases
Trend Analysis: Traders can use Fibonacci Fans to identify dynamic support/resistance zones in trending markets.
Reversal Trading: Time pivots and Golden Pivots help pinpoint moments for potential price reversals.
Range Trading: Fibonacci Levels provide key price zones for trading within a defined range.
Cross-Market Application: Log/linear scale support makes the script suitable for stocks, forex, commodities, and cryptocurrencies.
The original code was from zekicanozkanli . Thank you for giving me great Foundation.

Daily Session Fibonacci LevelsPlots automatic Fibonacci retracement levels based on the current session high and low.
Levels for the prior and current session can be toggled on/off.
Optional: Toggle to show the Fibonacci Level labels.
Allows for customizable levels and colors; toggles for individual levels.

Candle Fibs [QuantVue]The Candles Fib indicator is designed to help traders find potential levels of support and resistance based on ATR and Fibs.
How the Indicator Works
Identification of Large Candles:
🔹The indicator begins by identifying "large candles" based on their size relative to the Average True Range (ATR).
🔹 ATR (Average True Range) : ATR is a technical analysis indicator that measures market volatility by averaging the true range over a specified period, default 10 periods. The true range is the greatest of the following:
The difference between the current high and current low.
The difference between the previous close and the current high.
The difference between the previous close and the current low.
🔹In this script, a candle is considered "large" if its true range (the difference between the high and low) is at least twice the ATR.
Calculation of Fibonacci Levels:
🔹Once a large candle is identified, the indicator calculates key Fibonacci retracement levels based on the size of the candle.
🔹 Fibonacci Retracement : Fibonacci retracement levels are horizontal lines that indicate where support and resistance are likely to occur. These levels are derived from the Fibonacci sequence, a series of numbers where each number is the sum of the two preceding ones, often found in nature and markets.
🔹The most commonly used Fibonacci retracement levels are 0.382, 0.50, 0.618, and 0.786. In this indicator, the 0.50 and 0.618 levels are used.
Dynamic Plotting and Management of Levels:
🔹The indicator plots these Fibonacci levels as horizontal lines on the chart automatically.
🔹These lines extend as new bars (candlesticks) are formed, allowing the trader to see how the market reacts to these levels in real-time.
Give this indicator a BOOST and COMMENT your thoughts below!
We hope you enjoy.
Cheers!

Linear and Logarithmic Fibonacci Levels and FansIntroduction
The Fibonacci Retracement tool is a go-to for traders looking to spot potential support and resistance levels. By measuring the distance between swing highs and lows, you can apply Fibonacci ratios like 0.236, 0.382, and 0.618 to predict key market levels.
Traditionally, these levels are set by dividing this distance into equal parts—known as Linear Levels. A more refined approach, Logarithmic Levels, divides the distance into proportionally equal segments. Plus, this indicator now includes Fibonacci fans, adding another layer of analysis by projecting potential price levels using trendlines based on Fibonacci ratios.
This tool makes it easier to identify both Linear and Logarithmic levels while also leveraging Fibonacci fans for a more complete market view.
Applications
Logarithmic Levels and Fibonacci fans are ideal for volatile markets. In crypto, they’re especially effective for BTCUSDT (check out the wick from January 23, 2024). They also help spot accumulation and distribution patterns in high-volume altcoins like FETUSDT . In traditional markets, they’re useful for tracking stocks like TSLA and NVDA with extreme price swings, as well as indices in inflation-affected markets like XU100 , or recession-hit currency pairs like JPYUSD .
How to Use
This indicator is intuitive and similar to TradingView’s Fibonacci Tool. Select your reference levels (Level 1 and Level 0), then tweak the settings to customize your analysis, including adding Fibonacci fans for extra insights.
Why It’s Different
Unlike TradingView’s tool, which forces you to switch to a logarithmic scale (messing with other indicators and trend lines), this indicator lets you view both Linear and Logarithmic levels—and Fibonacci fans—without changing your chart’s scale. The original Fibonacci Code was derived from zekicanozkanli, modified and upgraded to plot fib fans as well.

Intraday Fibonacci Levels [Gorb]Welcome to the Intraday Fibonacci Levels indicator, a dynamic and customizable tool designed for traders who incorporate Fibonacci retracements and extensions into their technical analysis. This indicator focuses on intraday price action, allowing you to select a specific candle from any trading session and visualize crucial Fibonacci levels derived from its high and low prices.
Features:
Candle Selection for Fibonacci Analysis: Select any candle based on its time to plot Fibonacci levels, giving you control over the period of analysis.
Customizable .236 and .618 Fibonacci Levels: Plot and customize the .236 and .618 Fibonacci retracement and extension levels. Adjust color and line style for each level to fit your chart preferences.
User-Friendly Interface: Easy-to-use input fields for selecting the candle time and configuring Fibonacci settings. Intuitive toggle options to display or hide specific Fibonacci levels.
Dynamic Updating: The indicator updates in real-time as new price data is received, ensuring you have the latest Fibonacci levels on your chart.
Usage Case:
This indicator is ideal for day traders and technical analysts who utilize Fibonacci tools to identify potential support and resistance levels, trend reversals, or continuation patterns. Whether you are analyzing a high-impact news event candle or a significant pivot point in the trading day, this indicator helps bring clarity to your Fibonacci-based trading strategy.
Guidelines for Usage:
Use the indicator settings to select the candle time and configure your desired Fibonacci levels. You can choose any time you want, in order to use premarket candles you need to enable electronic hours on your chart to have levels plot from pre/post.
These auto plotted levels can act as pivot points or points of support and resistance for traders to make informed trading decisions near these levels. Analyze the plotted Fibonacci levels in conjunction with other technical indicators or price action patterns for informed trading decisions.
Conclusion:
This indicator is a versatile and essential tool for traders who rely on Fibonacci analysis as part of their trading arsenal. By offering the flexibility to analyze specific candles and customize Fibonacci levels, this indicator empowers you to make more informed trading decisions. Its user-friendly design and real-time updating capabilities ensure that you have access to accurate and relevant Fibonacci data at any moment of the trading day.
RISK DISCLAIMER
All content, tools, scripts & education provided by Monstanzer or Gorb Algo are for informational & educational purposes only. Trading is risk and most lose their money, past performance does not guarantee future results.

Fibonacci Timing Pattern IIThe Fibonacci Timing Pattern II is a price-based counter that seeks to determine medium-term reversals in price action. It is based on the following set of conditions:
* For a bullish Fibonacci timing signal II: The current close must be lower than the close prices from one and two periods ago. Simultaneously, the close price from two periods ago must be lower than the close price from three periods ago, and the close price from three periods ago must be lower than the close price from five periods ago. The Fibonacci sequence continues until the close price from thirty four periods ago which must be above the close price from fifty five periods ago.
* For a bearish Fibonacci timing signal II: The current close must be higher than the close prices from one and two periods ago. Simultaneously, the close price from two periods ago must be higher than the close price from three periods ago, and the close price from three periods ago must be higher than the close price from five periods ago. The Fibonacci sequence continues until the close price from thirty four periods ago which must be lower the close price from fifty five periods ago.
The signals of the pattern are ideally used in a sideways market or used in tandem with the trend (bullish signals are taken in a bullish market and bearish signals are taken in a bearish market).

Auto Fibonacci Retracement // Atilla YurtsevenOverview:
This Pine Script™ is a specialized tool for traders, designed to automatically plot Fibonacci retracement levels over a user-defined date range in trading charts. It also indicates the extent of price retracement within these levels.
Key Features:
Date Range Customization: Users can specify the start and end dates to focus the analysis on a particular trading period.
Dynamic Fibonacci Levels: The script includes various Fibonacci ratios (0.0, 0.236, 0.382, 0.5, 0.618, 0.786, 1.0), with the flexibility to enable or disable individual levels.
Visual Customization: Each Fibonacci level can be customized for color and line style (solid, dotted, dashed). Labels for each level are also configurable.
Retracement Measurement: The script not only draws the Fibonacci levels but also measures and displays how much the price has retraced within these levels.
Extension and Additional Options: Users have options to extend the Fibonacci lines and additional features such as using close values, trend drawing, date range display, and more.
Technical Insights:
The script identifies high and low values within the selected time frame, assessing the market's trend direction.
Within the specified date range, this script effortlessly plots the Fibonacci levels automatically, bringing clarity and precision to your market analysis as it unfolds.
The tool's adaptability makes it suitable for various trading styles and chart preferences.
Intended Use:
This script is particularly valuable for technical analysts and traders who use Fibonacci retracements to identify potential support and resistance areas and understand the depth of market corrections or rallies.
Disclaimer:
This Pine Script™ is offered 'as is', without any guarantees or warranties. It is intended for informational purposes and should not be taken as investment advice. Atilla Yurtseven, the creator of this script, assumes no responsibility for any financial losses or gains that may result from its usage. Users should perform their own due diligence and consult with professional advisors before making any investment decisions.
Remember to follow and comment!
Trade smart, stay safe
Atilla Yurtseven

Order Blocks W/ Realtime Fibs [QuantVue]The "Order Blocks W/ Realtime Fibs" indicator is a comprehensive tool combining the concepts of order blocks with Fibonacci retracement. The combination can be a powerful tool for identifying entry and exit points, and potential target areas.
Order blocks indicate where major players have likely placed their orders, while Fibonacci levels provide a mathematical basis for potential support and resistance areas.
What is an Order Block?
An order block in trading refers to an area on the chart in which it is believed a substantial number of orders (buy or sell) collected over a short period. Typically, these are identified as a range of consecutive aggressive bullish or bearish bars (candles). They represent areas where significant market players have entered the market, creating a footprint of their activity.
The indicator is highly customizable allowing user to select the number of consecutive bars and minimum price movement required for an order block, along with other settings like requiring a new order block in the opposite direction before finding a new order block.
Fibonacci Retracements
Fibonacci retracements are popular among technical traders, based on the idea that markets often retrace a predictable portion of a move, after which they continue to move in the original direction.
Once an Order Block is detected the indicator will automatically draw Fibonacci levels and continue to update those levels in real time until the user selected retracement level has been hit or a new more relevant order block has been found.
The combination of order blocks and Fibonacci retracements in this indicator can be used as a method for spotting potential reversal zones.
Indicator features:
🔹Custom Order Block Parameters
🔹Mitigation Type
🔹Custom Colors
🔹Select Retracement Levels
🔹Alerts for Order Blocks & Retracements
Give this indicator a BOOST and COMMENT your thoughts!
We hope you enjoy.
Cheers!

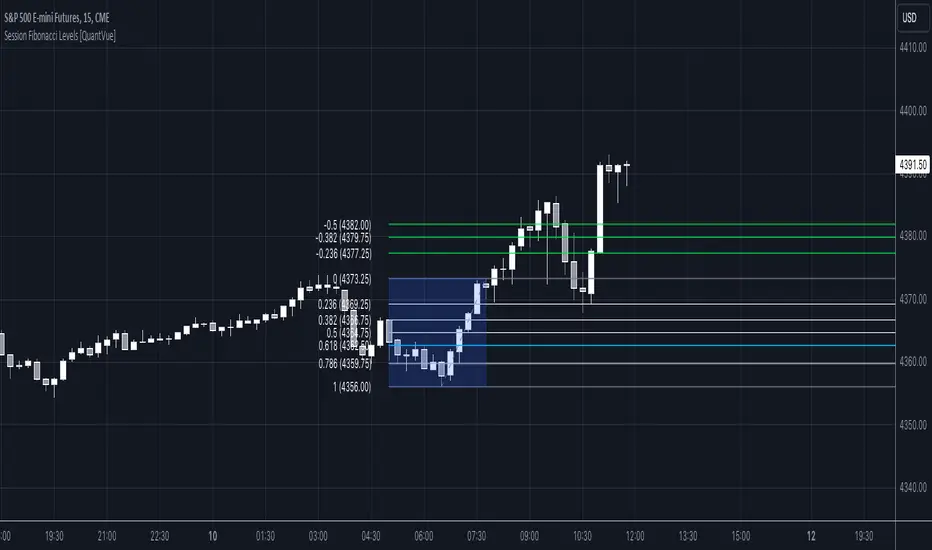
Session Fibonacci Levels [QuantVue]The "Session Fibonacci Levels" indicator is a powerful tool designed for traders who aim to use Fibonacci retracement and extension levels in their trading strategy.
The indicator combines Fibonacci levels with customized trading sessions, allowing traders to observe and utilize Fibonacci levels that are automatically calculated for each defined session.
This approach offers a dynamic and session-relevant perspective on potential support and resistance levels, which can be crucial for intraday trading strategies.
🔹The indicator calculates Fibonacci retracement and extension levels based on the high and low prices of a specified trading session, dynamically adjusting to the location of the high and low bar.
If the low of the session occurs before the high, the fib levels are measured from low to high.
If the low of the session occurs after the high, the fib levels are measured from high to low.
🔹Users can set their time zone and define trading sessions, allowing for flexibility and applicability across global markets. This is particularly beneficial for traders who focus on specific market hours like the London or New York sessions.
Important sessions:
New York (8:00am - 5:00pm EST)
London (3:00am - 12:00pm EST)
Asia (7:00pm - 4:00am EST)
Custom session (user defined session in indicator settings)
🔹The indicator dynamically updates Fibonacci levels as new highs and lows are made within the session, keeping the analysis current. Additionally, it provides alerts when prices hit key Fibonacci levels, aiding in timely decision-making.
How to Use:
Configure the time zone and session time
Once the session begins, the indicator will begin highlighting the session range
When the session ends, Fibonacci levels based on the high and low of the session will be drawn
Use these levels to identify potential support and resistance areas
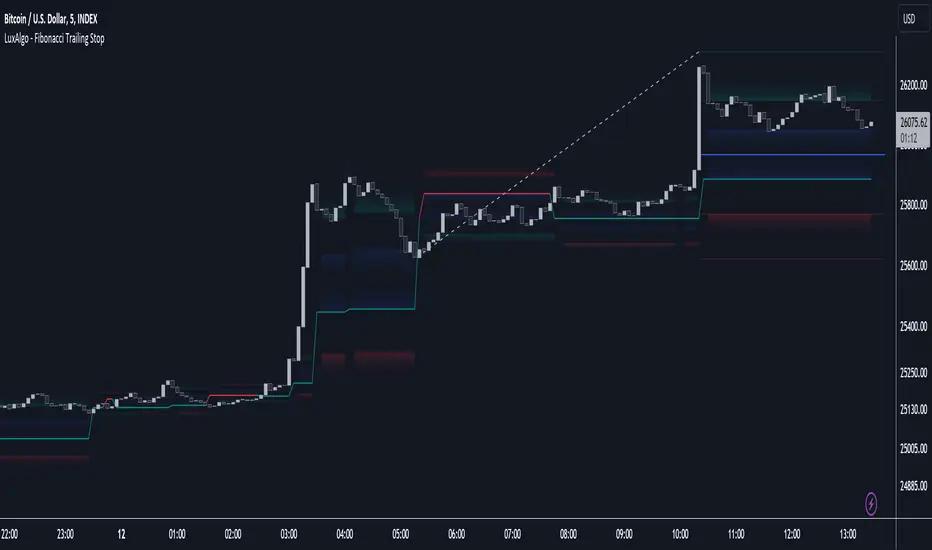
Fibonacci Trailing Stop [LuxAlgo]The Fibonacci Trailing Stop indicator creates a Trailing Stop, based on Fibonacci levels which are retrieved from the latest swing high & low . This provides a Trailing Stop-line .
🔶 USAGE
The Fibonacci Trailing Stop can indicate the current trend direction.
Shadows can also provide potential support/resistance areas.
Users can also display Fibonacci retracements.
🔶 CONCEPTS
🔹 Basic principles
There are 2 basic principles:
Every new swing will create or update a new Fibonacci pattern, potentially changing the Fibonacci Trailing Stop (FTS)
The Trend depends on whether the FTS is crossed/breached, the trigger is a chosen 'level/trigger'
(settings -> Fibonacci Trailing Stop -> Level/Trigger)
In an uptrend, these levels will be placed at the bottom half of the pattern.
In a downtrend, these levels will be placed at the top half of the pattern.
Once a trend is established, the Trailing Stop will only update in the direction of the trend:
Only higher when in an uptrend
Only lower when in a downtrend
If a Trailing Stop line is broken, the trend shifts to the other direction
The FTS line is accompanied by a secondary line (colour-filled), created by smaller swings (half of L/R, rounded to above)
EXAMPLES
• New bullish Trend/pattern
• Updating later on
• Bearish Trend -> breached -> New bullish Trend -> Trend is updated later on, and is breached at the end:
• Trend broken -> new Trend/direction:
• Bearish Trend -> breached -> New bullish Trend -> breached -> New bearish Trend (Here you see the latest cross of the bullish trend)
🔹 Shadows & latest Fibonacci
The indicator contains the option to show:
Latest Fibonacci
Shadows : previous Fibonacci Levels (will only appear after a 1 bar delay)
Shadows can be very useful to provide support/resistance areas, especially from large shadow-blocks .
When shadows are enabled, the color fill of Latest Fibonacci and FTS will be removed, this to provide less clutter:
🔶 SETTINGS
🔹 Swings
L: set left of pivothigh / pivotlow
R: set right of pivothigh / pivotlow
Swing labels: show labels of swings (updated in the same direction)
🔹 Fibonacci Trailing Stop
Level - Toggle - Custom value
• Choose pré-set levels [ -0.5, -0.382, -0.236 , 0, 0.236, 0.382, 0.5, 0.618 ]
• Choose custom level -> Toggle enabled and adjust the number at the right
Trigger: set trigger for breaching the FTS, close or wick (high in downtrend/low in uptrend)
🔹 Fibonacci
Latest Fibonacci: show Latest Fibonacci
Shadows: show Shadows
FVG w/ Fibs [QuantVue]The "FVG w/ Fibs" indicator is a trading tool designed to identify and visualize Fair Value Gaps (FVGs) while overlaying two Fibonacci retracement levels.
• Bullish FVG: Occurs when the low of the current bar is higher than the high of two bars ago, and the previous close is higher than the high of two bars ago.
• Bearish FVG: Occurs when the high of the current bar is lower than the low of two bars ago, and the previous close is lower than the low of two bars ago.
The indicator filters these gaps based on user-defined criteria such as the minimum percentage size of the gap.
Once identified, these FVGs are highlighted on the chart using customizable boxes and the 50% and 61.8% (default settings) Fibonacci retracement levels are calculated and drawn based on the size of the identified FVG.
• Dynamically updates and extends the boxes as the price evolves.
• Alerts / visual changes for FVGs that get filled.
• User option for fills by Wicks or Close
• User-customizable settings for box colors, styles, and Fibonacci level appearances
Give this indicator a BOOST and COMMENT your thoughts!
We hope you enjoy.
Cheers!

3 Fib EMAs To Scalp Them AllThe "3 Fib EMAs To Scalp Them All" was made in order to clear up when we should look for shorts, longs, or walk away. Also it can alert you when a trend starts, or when there is a possible reversal. I use it for scalping/day trading in 5m-1h timeframes.
1. EMAs: By default, the indicator uses Fibonacci numbers (21, 55, 233), but you can change them.
2. Color Changes: The color of the Micro EMA line changes depending on its relation to the Mid and Macro EMAs.
When Micro EMA < Mid < Macro EMA, it turns red, indicating a potential bearish trend - that's when you should look for shorts
When Micro EMA > Mid > Macro EMA, it turns green, indicating a potential bullish trend - that's when you should look for longs
A white Micro EMA is when you need to take some rest, enjoy your coffee, and avoid overtrading.
3. Signals: The indicator provides visual signals in the form of diamonds and crosses and corresponding alert signals.
A red diamond above the bar signals a potential beginning of a downtrend
A red cross above the bar signals the end of the downtrend and can be used as a signal for a possible reversal up/breakout.
A green diamond below the bar signals a potential beginning of a downtrend,
A green cross below the bar signals the end of the uptrend and can be used as a signal for a possible reversal down/breakout.
4. Alerts: For algo traders and people who prefer to stay away from the monitor... there are alerts for every signal.
Friendly note: Don't blindly follow the signals for your long and short entries. The signals only pop up when the EMA cross value gets a confirmation. A smart move would be to wait for a retracement to the EMA line and use momentum indicators like market cipher B to pinpoint those ideal entry points.

Auto Fib ZonesAuto Fib Zones is a extension of the ABC finder script that I released. It uses the pivot point system I developed in the ABC finder to identify major or significant trending moves in the market.
It will then draw the fibzones for the trend line. The fib zone will auto update for as long as the trend line continues (size will keep increasing).
The zones will continue to extend to the right along with price until it is tested. The start of the green teal zone is the 0.618 and fills to the 0.786 and the Blue zone is the 0.786 and fills to the trend start or 1 value of the fib.
You can adjust the Bars Back variable to require more or less candles to create/ validate a new trend. In the screen shot about it is set to 50 bars however I've seen good results on higher timeframes like 4h + with 15 bars as the setting.
This is basically ITC's Optimal Trade Entry concept at least that is what the original inspiration for modifying my base script was.
As always hope it helps. God bless

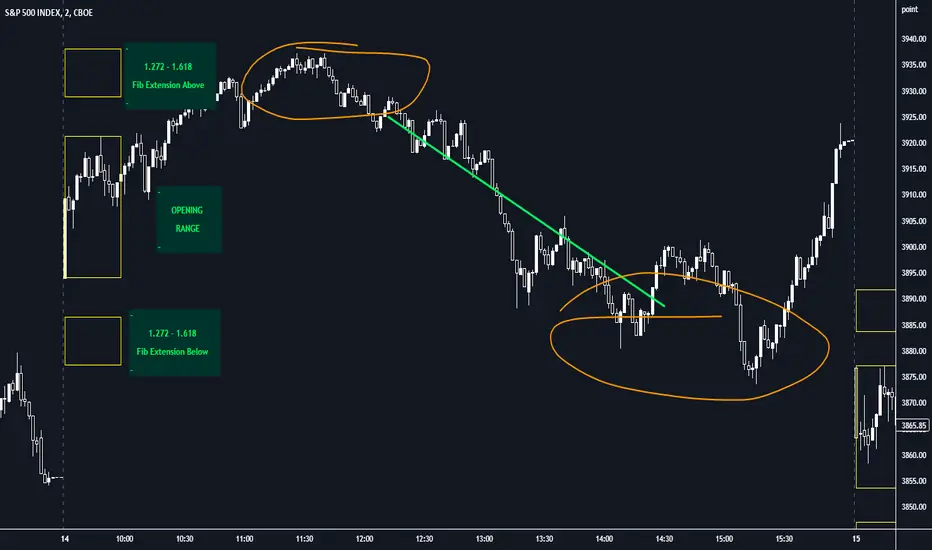
Opening Range with FibsThe indicator uses a time range and another instrument for time reference, so that it works in the time zone you care about. I have set the default to SPX500USD since it is in EST ( SPX , ES and many futures are on Chicago time and opening range gets confused). You can change the reference instrument in the settings.
You can also change the multipliers and use other values instead of 1.272 and 1.618 for Fib extensions.
TradingView has a limit as to how many objects an indicator can create so if you want to go back further for visual backtesting - use the replay tool - it will be able to draw up to the time you selected within its limits.
Let me know if you need anything else...
Happy Trading!
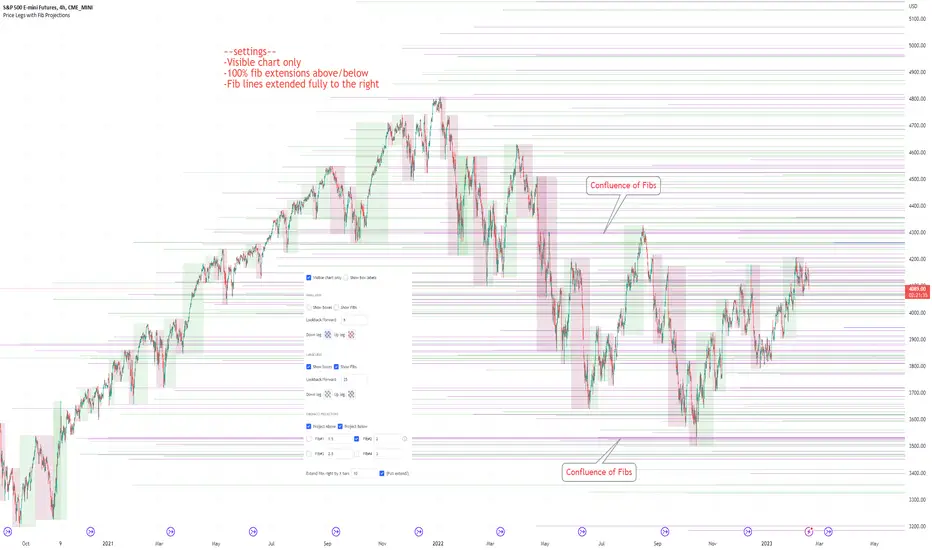
Price Legs & Fib Projections: Fibonacci Confluence-Plots price legs based on two user input lookback numbers. Smaller number for small legs, larger number for large legs.
-Plots Fib projections of these price legs, above and below; User can input four independent fib levels or standard deviation levels
## User Inputs ##
~Show visible chart only; Show price leg labels (time and price); show small legs (fibs and/or boxes); show large legs (fibs and/or boxes)
~Input 4 Fibonacci levels or measured move levels. Toggle each level on/off
~toggle on/off Fib levels ABOVE or fib levels BELOW
~extend Fib levels 'X' bars to the right, or toggle on/off 'Full Extend' to the right
## Tips & Notes ##
-use 'Full Extend' together with 'visible chart only' if searching for multiple confluence of Fib levels.
-can quickly get very cluttered, but the aim in writing this was to try to find area of confluence at a glance amongst a mess of levels, then hide the indicator and study/note that area.
-if lines don't print toward the left hand side of the chart you've likely reached the max line limit set by Tradingview.
-Fib level input of 1.0 represents zero % extension above the high or below the low of the leg; 2.0 represents 100% extension.
1hr S&P: Visible chart only; large legs only; 50%, 100%, 150%, 200% Fib extensions; Above only; lines extended fully to the right:
Usage notes; 15m S&P: Small & Large price legs; partial extend; all fib levels above/below:
Opening Range Breakout (and price targets)This Opening Range Breakout indicator stands apart from others for several reasons. Apart from displaying the opening range high and low on a chart, the script also plots customized potential price targets ( different from any other on TradingView! ) for breakouts and breakdowns in price action. These customized targets can be toggled on and off in the input section of the indicator's settings.
With regard to the indicator itself, it has two other key inputs, the "ORB total time (minutes)" and "ORB Timeframe". The first input sets the maximum number of minutes to be used in the calculation of the opening range, and the second input sets the specific time frame when the opening range is calculated. The script plots the opening range high and low on the chart as two separate lines with the high in blue and the low in white, and these lines dynamically change color of the high to green and the low to red if the current price is above or below the opening range, respectively.
The script starts by calculating whether or not the current bar falls within the specified time frame. It then sets the initial values of the opening range high and low, and continuously updates these values if the current bar's high or low is higher or lower than the previous values, respectively. The updated values are then plotted on the chart with the specified style and color.
Traders may use the ORB Indicator to trade breakouts and breakdowns of the opening range. If the price breaks above the opening range high, traders may look to enter long positions, and if the price breaks below the opening range low, traders may look to enter short positions. The customized price targets may be consulted for potential areas to take profit. The color change of the high and low lines can provide additional confirmation of a potential breakout or breakdown, adding to the strength of the trade setup. It is important to note that the ORB Indicator does not guarantee success, and traders should always consider other technical and fundamental factors before entering a trade.
Users can also create alerts for when price breaks above or below the opening range. This will provide up-to-date live alerts for traders who cannot be staring at their screens all day long.

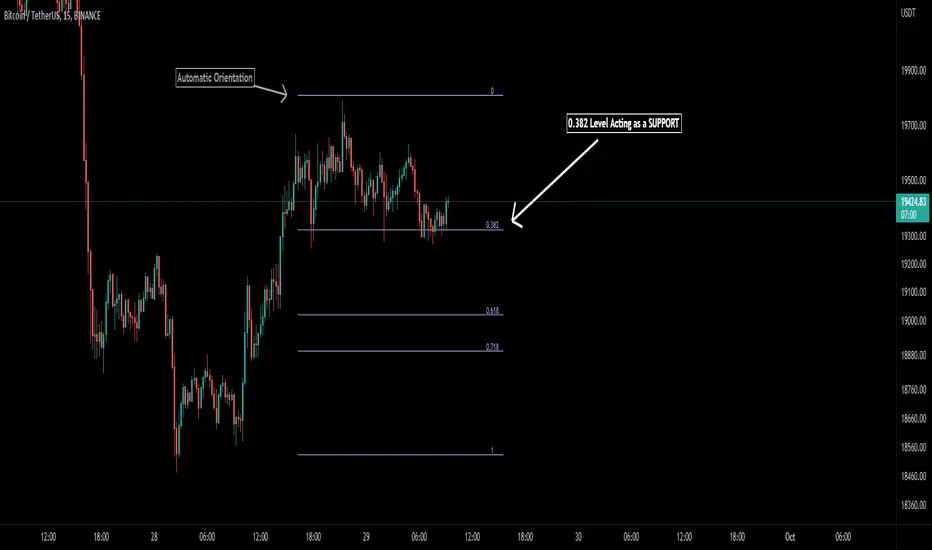
Auto Fibonacci [Misu]█ This indicator shows an automatic Fibonacci retracement levels.
This indicator is designed based on highs, lows, and trend interpretation to orientate the fibonacci retracement in the good direction.
Fibonacci analysis uses a logical sequence of numbers to predict trends and price action.
█ Usages:
The Fibonacci retracement is used to identify hidden support and resistance levels that an investor can use for entry, exit, and stop placement.
Depending on your usage, you can track breakouts above and below retracement levels to provide early entry points for major breakouts and breakdowns.
█ Features:
> Choose Fib levels
> Color Fib Levels all in one
> Color Fib Levels Individually
█ Parameters:
Deviation: A parameter used to calculate pivots.
Depth: A parameter used to calculate pivots.
UI Settings: Select Fibs levels and colors.
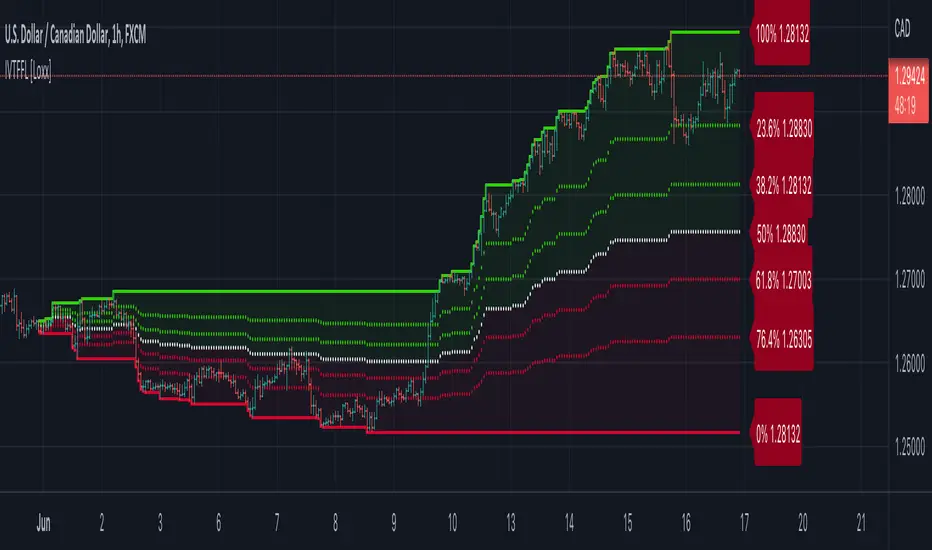
Intra-variety Timeframe Floating Fibonacci Levels [Loxx]Intra-variety Timeframe Floating Fibonacci Levels is an intraday, intraweek, and intramonth indicator to be used for scalping on lower timeframes. The indicator paints the developing fibonacci retracement levels as they change overtime over the selected intra-variety timeframe chosen. This indicator acts as another way to gauge support and resistance levels.
What Are Fibonacci Retracement Levels?
Fibonacci retracement levels—stemming from the Fibonacci sequence—are horizontal lines that indicate where support and resistance are likely to occur.
Each level is associated with a percentage. The percentage is how much of a prior move the price has retraced. The Fibonacci retracement levels are 23.6%, 38.2%, 61.8%, and 78.6%. While not officially a Fibonacci ratio, 50% is also used.
The indicator is useful because it can be drawn between any two significant price points, such as a high and a low. The indicator will then create the levels between those two points.
Suppose the price of a stock rises $10 and then drops $2.36. In that case, it has retraced 23.6%, which is a Fibonacci number. Fibonacci numbers are found throughout nature. Therefore, many traders believe that these numbers also have relevance in financial markets.
Fibonacci retracement levels were named after Italian mathemetician Leonardo Pisano Bigollo, who was famously known as Leonardo Fibonacci. However, Fibonacci did not create the Fibonacci sequence. Fibonacci, instead, introduced these numbers to western Europe after learning about them from Indian merchants. Fibonacci retracement levels were formulated in Ancient India between 450 and 200 BCE.
Details
-Change Fibonacci levels
-Select day, week, or month timeframe
GBTT Premarket Fib ZonesOverview:
This is a daily pre market fib tool. Basically, it looks at your premarket price action and generates a set of fibs. From there, it cross references bearish vs bullish fibs, creates a bear and bull zone to watch for during the day. Finally it draws associated fib levels in each direction are plotted/shaded to represent possible price levels for the day.
The lines will redraw/update every day at open, 930 est and then be there on the chart all day until the following open. These zones are meant to be a reference point for the current trading day only.
Intended use:
To provide educational content about the short term movement of an asset. Can be used on any time frame. But remember, it updates at 930 at open for each day and is only applicable to the current trading day.
Disclaimer:
NOT intended to be a sole source of Technical Analysis or anything more than an educational tool!