Edri Extreme Points Buy & SellEDRI EXTREME POINTS BUY & SELL INDICATOR
This Buy and Sell (non-repainting) indicator uses signals based on the combined CCI/Momentum and RSI indicators and optional regular divergence.
The idea of the indicator is to look for a potential reversal after the price reached extreme points (overbought or oversold) and signals an entry when the price shows signs of momentum for reversal.
Optionally, it considers finding a divergence while RSI is at the extreme levels to improve the predictability of a possible reversal.
Additionally, the indicator includes a simple Mean Reversion visual on the chart to assist users in identifying extreme price levels and potential reversal opportunities. It features upper and lower bands that can be optionally plotted, showing calculated values where price bounces at those extreme levels.
The purpose of these bands is to help traders avoid getting trapped in the middle of a trend and to guide them to buy low and sell high. (It's important to note that this is purely a visual aid and does not impact the generation of trade signals.)
By utilizing the Mean Reversion bands alongside the entry conditions, traders can gain insights into potential price reversals and make more informed decisions about when to enter or exit trades.
Buy and Sell Entry conditions:
• The indicator looks at the CCI/Momentum indicator to turn positive (if buy) or negative (if sell) after the RSI was overbought or oversold in the recent past.
• It also checks if there is a 3-period regular bullish divergence in the RSI (if buy), or regular bearish divergence (if sell) and consider these in the entry condition.
• If these conditions are met, this indicator suggests that it may be a good time to enter a trade.
In summary this is how this indicator works:
• The indicator takes input settings such as the choice between using CCI or Momentum as the entry signal source, length parameters for CCI/Momentum, RSI levels for overbought and oversold conditions, RSI length, and options to plot mean reversion bands on the chart.
• It calculates the CCI and Momentum and RSI values based on user-defined length..
• It checks for regular bullish and bearish divergences (3 periods) in the RSI if the option is enabled.
• The script plots shapes on the chart to indicate the buy and sell signals based on the entry conditions.
• If the mean reversion bands option is enabled, it calculates the mean reversion, standard deviation, upper band, and lower band values.
• It also plots the upper band, mean reversion line, and lower band on the chart if the mean reversion bands option is enabled.
• This indicator includes alert conditions to generate alerts for the buy and sell signals.
• On top of that, users can opt to use only one alert for both buy and sell signals. (This can save Trading view subscribers with limited alerts.)
Important! Please do not consider everything you read here as financial advice. Additionally, do not rely solely on indicators for making your trading decisions. It is important to note that no indicator or strategy is perfect. Therefore, it is always recommended to backtest everything and practice proper risk management.
I appreciate your feedback on this indicator. As I am new to script development, I am open to comments and suggestions to improve it. If you encounter any issues while using this indicator, please let me know in the comments section. If you find it helpful, I kindly ask for your support in boosting it. Thank you for your cooperation.
커모디티 채널 인덱스 (CCI)

TRADE WITH MACDThis indicator is used to identify the trend through the background color and by using the MACD indicator information and summarizing the moving average information and identifying the trend through the integration of information and then warning the fall and growth of the price of Bitcoin relative to the successful entry into any transaction by the trader. it helps
Some features of this indicator:
- The table draws the time frames in the desired time period quickly and accurately
- Identifying and inserting ascending and descending trends
- View the chart of five moving averages (9, 20, 50, 100, 200) at the same time
- Draw charts automatically or draw a chart with the desired interval length and desired start time
- Automatic updating of price data charts
- Changing the background color and warning in separate time frames from the current time frame as desired by the trader
Combi CCICombi CCI (CCCI): A Comprehensive Multi-Timeframe Indicator
Combi CCI (CCCI) is a powerful indicator that combines the Commodity Channel Index (CCI) across multiple timeframes. The purpose of CCCI is to provide a holistic view of the CCI, as it often happens that the CCI reaches its minimum or maximum value while the price continues to move in the same direction.
Seamless Integration of Timeframes for Enhanced Analysis
By incorporating CCI readings from different timeframes, CCCI eliminates the need for constantly switching between charts. You can keep a lower timeframe chart open while simultaneously benefiting from the insights provided by CCCI based on a higher timeframe.
Flexible Settings to Tailor the Indicator
CCCI offers customizable settings to suit your trading preferences. You can choose three timeframes of your choice and assign weights to each timeframe. If you prefer to work with only two timeframes, you have the option to assign a weight of 0 to the third timeframe.
Weighting Factor: Determining Importance
The assigned weight for each timeframe is crucial in determining its significance in the CCCI calculation. While the weight can be any non-negative number, it is the relative weights that matter the most. A higher weight value indicates a greater importance placed on that specific timeframe in the CCCI analysis.
Utilizing CCCI as an Effective Tool
While CCCI can be used as a regular CCI indicator, such as identifying buying opportunities in the oversold range or selling opportunities in the overbought range, it is essential to note that CCCI is not intended to be used as a standalone indicator. To make informed trading decisions, it is highly recommended to seek confluence with other indicators and analyze the overall market context.
Indicator analysis
Furthermore, the CCCI indicator includes built-in analysis on top of the indicator data. You can choose from SMA, EMA, BB, or you have an option to turn this feature off by selecting None. This provides an additional layer of information on top of the indicator data.
The indicator also includes automatic divergence detection. The data is correlated with the opened price chart, and bullish, bearish, both normal and hidden divergences are also visually displayed in the indicator area.

RSI-CCI Fusion StrategyRSI-CCI Fusion Strategy: Harnessing the Power of RSI and CCI
The "RSI-CCI Fusion Strategy" is a powerful trading approach that combines the strengths of the Relative Strength Index (RSI) and the Commodity Channel Index (CCI) to provide enhanced trading insights. This strategy is based on the popular "RSI & CCI Fusion + Alerts" indicator, which utilizes the RSI and CCI indicators from TradingView .
1. Overview of RSI and CCI:
The Relative Strength Index (RSI) is a widely used momentum oscillator that measures the speed and change of price movements. It helps traders identify overbought and oversold conditions in the market. On the other hand, the Commodity Channel Index (CCI) is a versatile indicator that identifies cyclical trends and provides insights into overbought and oversold levels.
2. The RSI-CCI Fusion Strategy:
The RSI-CCI Fusion Strategy harnesses the combined power of the RSI and CCI indicators to generate robust trading signals. By blending the RSI and CCI, this strategy captures both momentum and cyclical trend dynamics, offering a more comprehensive view of the market.
3. Utilizing the RSI-CCI Fusion Indicator + Alerts:
The "RSI & CCI Fusion + Alerts" indicator serves as the backbone of the RSI-CCI Fusion Strategy. It integrates the RSI and CCI indicators from TradingView, providing traders with a clear and actionable trading signal.
4. How it Works:
- The indicator calculates the RSI and CCI values, standardizes them using z-score, and combines them with a weighted fusion approach.
- The resulting RSI-CCI Fusion indicator is plotted on the chart, accompanied by dynamic upper and lower bands, which help identify potential overbought and oversold conditions.
- Traders can customize alerts based on their preferred thresholds and timeframes, enabling them to receive timely notifications for potential buy and sell signals.
5. Implementing the RSI-CCI Fusion Strategy:
Traders following the RSI-CCI Fusion Strategy can utilize the buy and sell signals generated by the RSI-CCI Fusion indicator. When the indicator crosses below the upper band, it may signal a potential selling opportunity. Conversely, when it crosses above the lower band, it may indicate a potential buying opportunity. Traders can also consider additional factors and technical analysis tools to validate the signals before making trading decisions.
Conclusion: The RSI-CCI Fusion Strategy provides traders with a robust approach to analyze the market and make well-informed trading decisions. By incorporating the RSI and CCI indicators through the "RSI & CCI Fusion + Alerts" indicator, traders can take advantage of the combined strengths of these indicators. However, it is important to remember that no strategy guarantees success, and traders should always practice risk management and conduct thorough analysis before executing trades using this strategy.
Disclaimer: Trading involves risks, and it is important to conduct your own research and consult with a financial advisor before making any investment decisions.
Note: The RSI-CCI Fusion Strategy serves as a general guide, and individual traders may have different preferences and trading styles.

RSI-CCI Fusion + AlertsThe "RSI-CCI Fusion" indicator combines the Relative Strength Index (RSI) and Commodity Channel Index (CCI) from TradingView.
RSI-CCI Fusion: Unlocking Synergies in Technical Analysis
Technical analysis plays a crucial role in understanding market dynamics and making informed trading decisions. I often rely on a combination of indicators to gain insights into price movements and identify potential trade opportunities. In the lines below, I will explore the "RSI-CCI Fusion" indicator, a powerful tool that combines the strengths of the Relative Strength Index (RSI) and the Commodity Channel Index (CCI) to provide enhanced trading insights.
1. Understanding the RSI and CCI Indicators
Before delving into the fusion of these indicators, let's briefly review their individual characteristics. The RSI is a widely used momentum oscillator that measures the speed and change of price movements. It oscillates between 0 and 100, with readings above 70 indicating overbought conditions and readings below 30 indicating oversold conditions.
On the other hand, the CCI is a versatile indicator designed to identify cyclical trends in prices. It measures the distance between the price and its statistical average, thereby providing valuable insights into overbought and oversold levels.
2. The Concept of RSI-CCI Fusion
The RSI-CCI Fusion indicator is born out of my desire to harness the collective power of the RSI and CCI. By combining these indicators, I can benefit from a more comprehensive trading signal that captures both momentum and cyclical trend dynamics.
The fusion process involves assigning weights to the RSI and CCI, creating a blended indicator that reflects their relative importance. The weighted combination ensures that both indicators contribute meaningfully to the final result.
To maintain consistency, the RSI and CCI values are standardized using the z-score technique. This normalization process brings the values to a common scale, making them directly comparable. Rescaling is then applied to bring the combined indicator back to its original scale, facilitating intuitive interpretation.
3. Interpreting the RSI-CCI Fusion Indicator
When plotting the RSI-CCI Fusion indicator on a chart, I gain valuable insights into market dynamics and potential trading opportunities. The indicator's plot typically includes dynamic upper and lower bands, which are calculated based on the indicator's standard deviation. These bands provide boundaries for evaluating overbought and oversold conditions.
When the RSI-CCI Fusion indicator crosses above the lower band, it suggests oversold conditions and potential buying opportunities. Conversely, when the indicator crosses below the upper band, it indicates overbought conditions and potential selling opportunities. I also pay attention to the baseline, which represents the neutral level and may signal potential trend reversals.
4. Utilizing Alerts for Trading Decisions
The RSI-CCI Fusion indicator can be further enhanced by incorporating alerts. These alerts notify me when the indicator generates buy or sell signals, enabling me to take prompt action. I can customize the alerts based on my preferred thresholds and timeframes.
However, it is crucial to remember that the RSI-CCI Fusion indicator should not be relied upon in isolation. To increase the robustness of my trading decisions, it is recommended to combine the indicator with other analysis techniques such as trend lines, support and resistance levels, or additional indicators. This convergence of analysis methodologies enhances the overall accuracy of my trade signals.
Conclusion: The RSI-CCI Fusion indicator represents a compelling approach to technical analysis by synergizing the strengths of the RSI and CCI. By combining momentum and cyclical trend dynamics, I gain a more comprehensive view of market conditions. The fusion of these indicators, accompanied by timely alerts, equips me with valuable insights and facilitates well-informed trading decisions.
As with any technical analysis tool, it is essential for me to backtest the RSI-CCI Fusion indicator to evaluate its performance across different market conditions and timeframes. Additionally, applying proper risk management strategies is crucial to ensure consistent and disciplined trading practices.

Ultimate Balance StrategyThe Ultimate Balance Oscillator Strategy harnesses the power of the Ultimate Balance Oscillator to deliver a comprehensive and disciplined approach to trading. By combining the insights of the Rate of Change (ROC), Relative Strength Index (RSI), Commodity Channel Index (CCI), Williams Percent Range, and Average Directional Index (ADX) from TradingView, this strategy offers traders a systematic way to navigate the markets with precision.
The core principle of this strategy lies in its ability to identify optimal entry and exit points based on the movement of the Ultimate Balance Oscillator. When the oscillator line crosses below the 0.75 level, a buy signal is generated, indicating a potential opportunity for a bullish trend reversal. Conversely, when the oscillator line crosses above the 0.25 level, it triggers an exit signal, suggesting a possible end to a bullish trend.
Key Features:
1. Objective Market Analysis: The Ultimate Balance Oscillator Strategy provides a disciplined and objective approach to market analysis. By relying on the quantified insights of multiple indicators, it helps traders cut through market noise and focus on key signals, improving decision-making and reducing emotional biases.
2. Enhanced Timing and Precision: This strategy's entry and exit signals are based on the specific thresholds of the Ultimate Balance Oscillator. By waiting for confirmation through the crossing of these levels, traders can potentially enter trades at opportune moments and exit with greater precision, maximizing profit potential and minimizing risk exposure.
3. Customizability and Adaptability: The strategy offers flexibility, allowing traders to customize the parameters to fit their preferred trading style and timeframes. Whether you're a short-term trader or a long-term investor, the Ultimate Balance Oscillator Strategy can be adjusted to suit your specific needs, making it adaptable to various market conditions.
4. Real-time Alerts: Stay informed and never miss a potential trade opportunity with the strategy's built-in alert system. Set personalized alerts for buy and exit signals to receive timely notifications, ensuring you're always aware of the latest developments in the market.
5. Backtesting and Optimization: Before applying the strategy to live trading, it's recommended to conduct thorough backtesting and optimization. By testing the strategy's performance over historical data and fine-tuning the parameters, you can gain insights into its strengths and weaknesses, enabling you to make informed adjustments and increase its effectiveness.
Trading involves risk. Use the Ultimate Balance Oscillator Strategy at your own discretion. Past performance is not indicative of future results.

Ultimate Balance OscillatorIntroducing the Ultimate Balance Oscillator: A Powerful Trading Indicator
Built upon the renowned Rate of Change (ROC), Relative Strength Index (RSI), Commodity Channel Index (CCI), Williams Percent Range, and Average Directional Index (ADX) from TradingView, this indicator equips traders with an unparalleled understanding of market dynamics.
What sets the Ultimate Balance Oscillator apart is its meticulous approach to weighting. Each component is assigned a weight that reflects its individual significance, while carefully mitigating the influence of highly correlated signals. This strategic weighting methodology ensures an unbiased and comprehensive representation of market sentiment, eliminating dominance by any single indicator.
Key Features and Benefits:
1. Comprehensive Market Analysis: The Ultimate Balance Oscillator provides a comprehensive view of market conditions, enabling traders to discern price trends, evaluate momentum shifts, identify overbought or oversold levels, and gauge the strength of prevailing trends. This holistic perspective empowers traders to make well-informed decisions based on a thorough understanding of the market.
2. Enhanced Signal Accuracy: With its refined weighting approach, the Ultimate Balance Oscillator filters out noise and emphasizes the most relevant information. This results in heightened signal accuracy, providing traders with a distinct advantage in identifying optimal entry and exit points. Say goodbye to unreliable signals and welcome a more precise and dependable trading experience.
3. Adaptability to Various Trading Scenarios: The Ultimate Balance Oscillator transcends the constraints of specific markets or timeframes. It seamlessly adapts to diverse trading scenarios, accommodating both short-term trades and long-term investments. Traders can customize this indicator to suit their preferred trading style and effortlessly navigate ever-changing market conditions.
4. Simplicity and Ease of Use: The Ultimate Balance Oscillator simplifies trading analysis by providing a single line on the chart. Its straightforward interpretation and seamless integration into trading strategies make decision-making effortless. By observing bullish or bearish crossovers with the moving average, recognizing overbought or oversold levels, and tracking the overall trend of the oscillator, traders can make well-informed decisions with confidence.
5. Real-time Alerts: Stay ahead of the game with the Ultimate Balance Oscillator's customizable alert system. Traders can set up personalized alerts for bullish or bearish crossovers, breaches of overbought or oversold thresholds, or any specific events that align with their trading strategy. Real-time notifications enable timely action, ensuring traders never miss lucrative trading opportunities.
The Ultimate Balance Oscillator is a robust trading companion, empowering traders to make shrewd and calculated decisions. Embrace its power and elevate your trading endeavors to new heights of precision and success. Discover the potential of the Ultimate Balance Oscillator and unlock a world of trading possibilities.

ADW - Volatility MapThe ADW - Volatility Map script is a tool for traders to measure and visualize the volatility of a specific asset. It uses both the Average True Range (ATR) and True Range (TR) values in combination with the Commodity Channel Index (CCI) to provide a comprehensive map of the market's volatility.
Average True Range (ATR) : ATR is a measure of market volatility. It measures the average of true price ranges over a time period. In this script, we use it to calculate the ATR-CCI which gives us a more precise measure of volatility.
True Range (TR) : TR is the greatest distance the price moved during a period. It is used in this script to calculate the TR-CCI, adding another level of detail to our volatility measurement.
Commodity Channel Index (CCI) : CCI is a versatile indicator that can be used to identify a new trend or warn of extreme conditions. We use it to scale and compare the ATR and TR values, hence providing a relative measure of volatility.
The script interprets the CCI values and provides four different conditions for both ATR and TR:
Is Low (CCI < 0)
Is High (CCI > 0)
Is Extremely Low (CCI <= -100)
Is Extremely High (CCI >= 100)
The interpretation of these conditions is displayed on the chart using colour highlighting. When the ATR or TR are low, high, extremely low, or extremely high, the script fills the chart accordingly.
In addition, the script has an option `awaitBarConfirmation` set at the beginning. If this is true, the script will only display indicators for fully formed bars, ensuring that the indicators you see are based on confirmed information.
Note: The colours for different conditions can be customized at the beginning of the script, allowing you to personalize the visual output to match your preferences.
This script is designed to provide a visually clear and immediate understanding of the market's volatility. Use it to enhance your decision-making process and adapt your trading strategy to the current market conditions.

GKD-C CCI Adaptive Smoother [Loxx]Giga Kaleidoscope GKD-C CCI Adaptive Smoother is a Confirmation module included in Loxx's "Giga Kaleidoscope Modularized Trading System".
█ GKD-C CCI Adaptive Smoother
Commodity Channel Index: History, Calculation, and Advantages
The Commodity Channel Index (CCI) is a versatile technical analysis indicator widely used by traders and analysts to identify potential trends, reversals, and trading opportunities in various financial markets. Developed by Donald Lambert in 1980, the CCI was initially designed to analyze the cyclical behavior of commodities. However, its applications have expanded over time to include stocks, currencies, and other financial instruments. The following provides an overview of the CCI's history, explain its calculation, and discuss its advantages compared to other indicators.
History
Donald Lambert, a commodities trader and technical analyst, created the Commodity Channel Index in response to the unique challenges posed by the cyclical nature of the commodities markets. Lambert aimed to develop an indicator that could help traders identify potential turning points in the market, allowing them to capitalize on price trends and reversals. The CCI quickly gained popularity among traders and analysts due to its ability to adapt to various market conditions and provide valuable insights into price movements.
Calculation
The CCI is calculated through the following steps:
1. Determine the typical price for each period: The typical price is calculated as the average of the high, low, and closing prices for each period.
Typical Price = (High + Low + Close) / 3
2. Calculate the moving average of the typical price: The moving average is computed over a specified period, typically 14 or 20 days.
3. Calculate the mean deviation: For each period, subtract the moving average from the typical price, and take the absolute value of the result. Then, compute the average of these absolute values over the specified period.
4. Calculate the CCI: Divide the difference between the typical price and its moving average by the product of the mean deviation and a constant, typically 0.015.
CCI = (Typical Price - Moving Average) / (0.015 * Mean Deviation)
Why CCI is Used and Its Advantages over Other Indicators
The CCI offers several advantages over other technical indicators, making it a popular choice among traders and analysts:
1. Versatility: Although initially developed for commodities, the CCI has proven to be effective in analyzing a wide range of financial instruments, including stocks, currencies, and indices. Its adaptability to different markets and timeframes makes it a valuable tool for various trading strategies.
2. Identification of overbought and oversold conditions: The CCI measures the strength of the price movement relative to its historical average. When the CCI reaches extreme values, it can signal overbought or oversold conditions, indicating potential trend reversals or price corrections.
3. Confirmation of price trends: The CCI can help traders confirm the presence of a price trend by identifying periods of strong momentum. A rising CCI indicates increasing positive momentum, while a falling CCI suggests increasing negative momentum.
4. Divergence analysis: Traders can use the CCI to identify divergences between the indicator and price action. For example, if the price reaches a new high, but the CCI fails to reach a corresponding high, it can signal a weakening trend and potential reversal.
5. Independent of price scale: Unlike some other technical indicators, the CCI is not affected by the price scale of the asset being analyzed. This characteristic allows traders to apply the CCI consistently across various instruments and markets.
The Commodity Channel Index is a powerful and versatile technical analysis tool that has stood the test of time. Developed to address the unique challenges of the commodities markets, the CCI has evolved into an essential tool for traders and analysts in various financial markets. Its ability to identify trends, reversals, and trading opportunities, as well as its versatility and adaptability, sets it apart from other technical indicators. By incorporating the CCI into their analytical toolkit, traders can gain valuable insights into market conditions, enabling them to make more informed decisions and improve their overall trading performance.
As financial markets continue to evolve and grow more complex, the importance of reliable and versatile technical analysis tools like the CCI cannot be overstated. In an environment characterized by rapidly changing market conditions, the ability to quickly identify trends, reversals, and potential trading opportunities is crucial for success. The CCI's adaptability to different markets, timeframes, and instruments makes it an indispensable resource for traders seeking to navigate the increasingly dynamic financial landscape.
Additionally, the CCI can be effectively combined with other technical analysis tools, such as moving averages, trend lines, and candlestick patterns, to create a more comprehensive and robust trading strategy. By using the CCI in conjunction with these complementary techniques, traders can develop a more nuanced understanding of market behavior and enhance their ability to identify high-probability trading opportunities.
In conclusion, the Commodity Channel Index is a valuable and versatile tool in the world of technical analysis. Its ability to adapt to various market conditions and provide insights into price trends, reversals, and trading opportunities make it an essential resource for traders and analysts alike. As the financial markets continue to evolve, the CCI's proven track record and adaptability ensure that it will remain a cornerstone of technical analysis for years to come.
What is the Smoother Moving Average?
The smoother function is a custom algorithm designed to smooth the price data of a financial asset using a moving average technique. It takes the price (src) and the period of the rolling window sample (len) to reduce noise in the data and reveal underlying trends.
smoother(float src, int len)=>
wrk = src, wrk2 = src, wrk4 = src
wrk0 = 0., wrk1 = 0., wrk3 = 0.
alpha = 0.45 * (len - 1.0) / (0.45 * (len - 1.0) + 2.0)
wrk0 := src + alpha * (nz(wrk ) - src)
wrk1 := (src - wrk) * (1 - alpha) + alpha * nz(wrk1 )
wrk2 := wrk0 + wrk1
wrk3 := (wrk2 - nz(wrk4 )) * math.pow(1.0 - alpha, 2) + math.pow(alpha, 2) * nz(wrk3 )
wrk4 := wrk3 + nz(wrk4 )
wrk4
Here's a detailed breakdown of the code, explaining each step and its purpose:
1. wrk, wrk2, and wrk4: These variables are assigned the value of src, which represents the source price of the asset. This step initializes the variables with the current price data, serving as a starting point for the smoothing calculations.
wrk0, wrk1, and wrk3: These variables are initialized to 0. They will be used as temporary variables to hold intermediate results during the calculations.
Calculation of the alpha parameter:
2. The alpha parameter is calculated using the formula: 0.45 * (len - 1.0) / (0.45 * (len - 1.0) + 2.0). The purpose of this calculation is to determine the smoothing factor that will be used in the subsequent calculations. This factor will influence the balance between responsiveness to recent price changes and smoothness of the resulting moving average. A higher value of alpha will result in a more responsive moving average, while a lower value will produce a smoother curve.
Calculation of wrk0:
3. wrk0 is updated with the expression: src + alpha * (nz(wrk ) - src). This step calculates the first component of the moving average, which is based on the current price (src) and the previous value of wrk (if it exists, otherwise 0 is used). This calculation applies the alpha parameter to weight the contribution of the previous wrk value, effectively making the moving average more responsive to recent price changes.
Calculation of wrk1:
4. wrk1 is updated with the expression: (src - wrk) * (1 - alpha) + alpha * nz(wrk1 ). This step calculates the second component of the moving average, which is based on the difference between the current price (src) and the current value of wrk. The alpha parameter is used to weight the contribution of the previous wrk1 value, allowing the moving average to be even more responsive to recent price changes.
Calculation of wrk2:
5. wrk2 is updated with the expression: wrk0 + wrk1. This step combines the first and second components of the moving average (wrk0 and wrk1) to produce a preliminary smoothed value.
Calculation of wrk3:
6. wrk3 is updated with the expression: (wrk2 - nz(wrk4 )) * math.pow(1.0 - alpha, 2) + math.pow(alpha, 2) * nz(wrk3 ). This step refines the preliminary smoothed value (wrk2) by accounting for the differences between the current smoothed value and the previous smoothed values (wrk4 and wrk3 ). The alpha parameter is used to weight the contributions of the previous smoothed values, providing a balance between smoothness and responsiveness.
Calculation of wrk4:
7. Calculation of wrk4:
wrk4 is updated with the expression: wrk3 + nz(wrk4 ). This step combines the refined smoothed value (wrk3) with the previous smoothed value (wrk4 , or 0 if it doesn't exist) to produce the final smoothed value. The purpose of this step is to ensure that the resulting moving average incorporates information from past values, making it smoother and more representative of the underlying trend.
8. Return wrk4:
The function returns the final smoothed value wrk4. This value represents the Smoother Moving Average for the given data point in the price series.
In summary, the smoother function calculates a custom moving average by using a series of steps to weight and combine recent price data with past smoothed values. The resulting moving average is more responsive to recent price changes while still maintaining a smooth curve, which helps reveal underlying trends and reduce noise in the data. The alpha parameter plays a key role in balancing the responsiveness and smoothness of the moving average, allowing users to customize the behavior of the algorithm based on their specific needs and preferences.
What is the CCI Adaptive Smoother?
The Commodity Channel Index (CCI) Adaptive Smoother is an innovative technical analysis tool that combines the benefits of the CCI indicator with a Smoother Moving Average. By adapting the CCI calculation based on the current market volatility, this method offers a more responsive and flexible approach to identifying potential trends and trading signals in financial markets.
The CCI is a momentum-based oscillator designed to determine whether an asset is overbought or oversold. It measures the difference between the typical price of an asset and its moving average, divided by the mean absolute deviation of the typical price. The traditional CCI calculation relies on a fixed period, which may not be suitable for all market conditions, as volatility can change over time.
The introduction of the Smoother Moving Average to the CCI calculation addresses this limitation. The Smoother Moving Average is a custom smoothing algorithm that combines elements of exponential moving averages with additional calculations to fine-tune the smoothing effect based on a given parameter. This algorithm assigns more importance to recent data points, making it more sensitive to recent changes in the data.
The CCI Adaptive Smoother dynamically adjusts the period of the Smoother Moving Average based on the current market volatility. This is accomplished by calculating the standard deviation of the close prices over a specified period and then computing the simple moving average of the standard deviation. By comparing the average standard deviation with the current standard deviation, the adaptive period for the Smoother Moving Average can be determined.
This adaptive approach allows the CCI Adaptive Smoother to be more responsive to changing market conditions. In periods of high volatility, the adaptive period will be shorter, resulting in a more responsive moving average. Conversely, in periods of low volatility, the adaptive period will be longer, producing a smoother moving average. This flexibility enables the CCI Adaptive Smoother to better identify trends and potential trading signals in a variety of market environments.
Furthermore, the CCI Adaptive Smoother is a prime example of the evolution of technical analysis methodologies. As markets continue to become more complex and dynamic, it is crucial for analysts and traders to adapt and improve their techniques to stay competitive. The incorporation of adaptive algorithms, like the Smoother Moving Average, demonstrates the potential for blending traditional indicators with cutting-edge methods to create more powerful and versatile tools for market analysis.
The versatility of the CCI Adaptive Smoother makes it suitable for various trading strategies, including trend-following, mean-reversion, and breakout systems. By providing a more precise measurement of overbought and oversold conditions, the CCI Adaptive Smoother can help traders identify potential entry and exit points with greater accuracy. Additionally, its responsiveness to changing market conditions allows for more timely adjustments in trading positions, reducing the risk of holding onto losing trades.
While the CCI Adaptive Smoother is a valuable tool, it is essential to remember that no single indicator can provide a complete picture of the market. As seasoned analysts and traders, we must always consider a holistic approach, incorporating multiple indicators and techniques to confirm signals and validate our trading decisions. By combining the CCI Adaptive Smoother with other technical analysis tools, such as trend lines, support and resistance levels, and candlestick patterns, traders can develop a more comprehensive understanding of the market and make more informed decisions.
The development of the CCI Adaptive Smoother also highlights the increasing importance of computational power and advanced algorithms in the field of technical analysis. As financial markets become more interconnected and influenced by various factors, including macroeconomic events, geopolitical developments, and technological innovations, the need for sophisticated tools to analyze and interpret complex data sets becomes even more critical.
Machine learning and artificial intelligence (AI) are becoming increasingly relevant in the world of trading and investing. These technologies have the potential to revolutionize how technical analysis is performed, by automating the discovery of patterns, relationships, and trends in the data. By leveraging machine learning algorithms and AI-driven techniques, traders can uncover hidden insights, improve decision-making processes, and optimize trading strategies.
The CCI Adaptive Smoother is just one example of how advanced algorithms can enhance traditional technical indicators. As the adoption of machine learning and AI continues to grow in the financial sector, we can expect to see the emergence of even more sophisticated and powerful analysis tools. These innovations will undoubtedly lead to a new era of technical analysis, where the ability to quickly adapt to changing market conditions and extract meaningful insights from complex data becomes increasingly critical for success.
In conclusion, the CCI Adaptive Smoother is an essential step forward in the evolution of technical analysis. It demonstrates the potential for combining traditional indicators with advanced algorithms to create more responsive and versatile tools for market analysis. As technology continues to advance and reshape the financial landscape, it is crucial for traders and analysts to stay informed and embrace innovation. By integrating cutting-edge tools like the CCI Adaptive Smoother into their arsenal, traders can gain a competitive edge and enhance their ability to navigate the increasingly complex world of financial markets.
Additional Features
This indicator allows you to select from 33 source types. They are as follows:
Close
Open
High
Low
Median
Typical
Weighted
Average
Average Median Body
Trend Biased
Trend Biased (Extreme)
HA Close
HA Open
HA High
HA Low
HA Median
HA Typical
HA Weighted
HA Average
HA Average Median Body
HA Trend Biased
HA Trend Biased (Extreme)
HAB Close
HAB Open
HAB High
HAB Low
HAB Median
HAB Typical
HAB Weighted
HAB Average
HAB Average Median Body
HAB Trend Biased
HAB Trend Biased (Extreme)
What are Heiken Ashi "better" candles?
Heiken Ashi "better" candles are a modified version of the standard Heiken Ashi candles, which are a popular charting technique used in technical analysis. Heiken Ashi candles help traders identify trends and potential reversal points by smoothing out price data and reducing market noise. The "better formula" was proposed by Sebastian Schmidt in an article published by BNP Paribas in Warrants & Zertifikate, a German magazine, in August 2004. The aim of this formula is to further improve the smoothing of the Heiken Ashi chart and enhance its effectiveness in identifying trends and reversals.
Standard Heiken Ashi candles are calculated using the following formulas:
Heiken Ashi Close = (Open + High + Low + Close) / 4
Heiken Ashi Open = (Previous Heiken Ashi Open + Previous Heiken Ashi Close) / 2
Heiken Ashi High = Max (High, Heiken Ashi Open, Heiken Ashi Close)
Heiken Ashi Low = Min (Low, Heiken Ashi Open, Heiken Ashi Close)
The "better formula" modifies the standard Heiken Ashi calculation by incorporating additional smoothing, which can help reduce noise and make it easier to identify trends and reversals. The modified formulas for Heiken Ashi "better" candles are as follows:
Better Heiken Ashi Close = (Open + High + Low + Close) / 4
Better Heiken Ashi Open = (Previous Better Heiken Ashi Open + Previous Better Heiken Ashi Close) / 2
Better Heiken Ashi High = Max (High, Better Heiken Ashi Open, Better Heiken Ashi Close)
Better Heiken Ashi Low = Min (Low, Better Heiken Ashi Open, Better Heiken Ashi Close)
Smoothing Factor = 2 / (N + 1), where N is the chosen period for smoothing
Smoothed Better Heiken Ashi Open = (Better Heiken Ashi Open * Smoothing Factor) + (Previous Smoothed Better Heiken Ashi Open * (1 - Smoothing Factor))
Smoothed Better Heiken Ashi Close = (Better Heiken Ashi Close * Smoothing Factor) + (Previous Smoothed Better Heiken Ashi Close * (1 - Smoothing Factor))
The smoothed Better Heiken Ashi Open and Close values are then used to calculate the smoothed Better Heiken Ashi High and Low values, resulting in "better" candles that provide a clearer representation of the market trend and potential reversal points.
It's important to note that, like any other technical analysis tool, Heiken Ashi "better" candles are not foolproof and should be used in conjunction with other indicators and analysis techniques to make well-informed trading decisions.
Heiken Ashi "better" candles, as mentioned previously, provide a clearer representation of market trends and potential reversal points by reducing noise and smoothing out price data. When using these candles in conjunction with other technical analysis tools and indicators, traders can gain valuable insights into market behavior and make more informed decisions.
To effectively use Heiken Ashi "better" candles in your trading strategy, consider the following tips:
Trend Identification: Heiken Ashi "better" candles can help you identify the prevailing trend in the market. When the majority of the candles are green (or another color, depending on your chart settings) and there are no or few lower wicks, it may indicate a strong uptrend. Conversely, when the majority of the candles are red (or another color) and there are no or few upper wicks, it may signal a strong downtrend.
Trend Reversals: Look for potential trend reversals when a change in the color of the candles occurs, especially when accompanied by longer wicks. For example, if a green candle with a long lower wick is followed by a red candle, it could indicate a bearish reversal. Similarly, a red candle with a long upper wick followed by a green candle may suggest a bullish reversal.
Support and Resistance: You can use Heiken Ashi "better" candles to identify potential support and resistance levels. When the candles are consistently moving in one direction and then suddenly change color with longer wicks, it could indicate the presence of a support or resistance level.
Stop-Loss and Take-Profit: Using Heiken Ashi "better" candles can help you manage risk by determining optimal stop-loss and take-profit levels. For instance, you can place your stop-loss below the low of the most recent green candle in an uptrend or above the high of the most recent red candle in a downtrend.
Confirming Signals: Heiken Ashi "better" candles should be used in conjunction with other technical indicators, such as moving averages, oscillators, or chart patterns, to confirm signals and improve the accuracy of your analysis.
In this implementation, you have the choice of AMA, KAMA, or T3 smoothing. These are as follows:
Kaufman Adaptive Moving Average (KAMA)
The Kaufman Adaptive Moving Average (KAMA) is a type of adaptive moving average used in technical analysis to smooth out price fluctuations and identify trends. The KAMA adjusts its smoothing factor based on the market's volatility, making it more responsive in volatile markets and smoother in calm markets. The KAMA is calculated using three different efficiency ratios that determine the appropriate smoothing factor for the current market conditions. These ratios are based on the noise level of the market, the speed at which the market is moving, and the length of the moving average. The KAMA is a popular choice among traders who prefer to use adaptive indicators to identify trends and potential reversals.
Adaptive Moving Average
The Adaptive Moving Average (AMA) is a type of moving average that adjusts its sensitivity to price movements based on market conditions. It uses a ratio between the current price and the highest and lowest prices over a certain lookback period to determine its level of smoothing. The AMA can help reduce lag and increase responsiveness to changes in trend direction, making it useful for traders who want to follow trends while avoiding false signals. The AMA is calculated by multiplying a smoothing constant with the difference between the current price and the previous AMA value, then adding the result to the previous AMA value.
T3
The T3 moving average is a type of technical indicator used in financial analysis to identify trends in price movements. It is similar to the Exponential Moving Average (EMA) and the Double Exponential Moving Average (DEMA), but uses a different smoothing algorithm.
The T3 moving average is calculated using a series of exponential moving averages that are designed to filter out noise and smooth the data. The resulting smoothed data is then weighted with a non-linear function to produce a final output that is more responsive to changes in trend direction.
The T3 moving average can be customized by adjusting the length of the moving average, as well as the weighting function used to smooth the data. It is commonly used in conjunction with other technical indicators as part of a larger trading strategy.
█ Giga Kaleidoscope Modularized Trading System
Core components of an NNFX algorithmic trading strategy
The NNFX algorithm is built on the principles of trend, momentum, and volatility. There are six core components in the NNFX trading algorithm:
1. Volatility - price volatility; e.g., Average True Range, True Range Double, Close-to-Close, etc.
2. Baseline - a moving average to identify price trend
3. Confirmation 1 - a technical indicator used to identify trends
4. Confirmation 2 - a technical indicator used to identify trends
5. Continuation - a technical indicator used to identify trends
6. Volatility/Volume - a technical indicator used to identify volatility/volume breakouts/breakdown
7. Exit - a technical indicator used to determine when a trend is exhausted
What is Volatility in the NNFX trading system?
In the NNFX (No Nonsense Forex) trading system, ATR (Average True Range) is typically used to measure the volatility of an asset. It is used as a part of the system to help determine the appropriate stop loss and take profit levels for a trade. ATR is calculated by taking the average of the true range values over a specified period.
True range is calculated as the maximum of the following values:
-Current high minus the current low
-Absolute value of the current high minus the previous close
-Absolute value of the current low minus the previous close
ATR is a dynamic indicator that changes with changes in volatility. As volatility increases, the value of ATR increases, and as volatility decreases, the value of ATR decreases. By using ATR in NNFX system, traders can adjust their stop loss and take profit levels according to the volatility of the asset being traded. This helps to ensure that the trade is given enough room to move, while also minimizing potential losses.
Other types of volatility include True Range Double (TRD), Close-to-Close, and Garman-Klass
What is a Baseline indicator?
The baseline is essentially a moving average, and is used to determine the overall direction of the market.
The baseline in the NNFX system is used to filter out trades that are not in line with the long-term trend of the market. The baseline is plotted on the chart along with other indicators, such as the Moving Average (MA), the Relative Strength Index (RSI), and the Average True Range (ATR).
Trades are only taken when the price is in the same direction as the baseline. For example, if the baseline is sloping upwards, only long trades are taken, and if the baseline is sloping downwards, only short trades are taken. This approach helps to ensure that trades are in line with the overall trend of the market, and reduces the risk of entering trades that are likely to fail.
By using a baseline in the NNFX system, traders can have a clear reference point for determining the overall trend of the market, and can make more informed trading decisions. The baseline helps to filter out noise and false signals, and ensures that trades are taken in the direction of the long-term trend.
What is a Confirmation indicator?
Confirmation indicators are technical indicators that are used to confirm the signals generated by primary indicators. Primary indicators are the core indicators used in the NNFX system, such as the Average True Range (ATR), the Moving Average (MA), and the Relative Strength Index (RSI).
The purpose of the confirmation indicators is to reduce false signals and improve the accuracy of the trading system. They are designed to confirm the signals generated by the primary indicators by providing additional information about the strength and direction of the trend.
Some examples of confirmation indicators that may be used in the NNFX system include the Bollinger Bands, the MACD (Moving Average Convergence Divergence), and the MACD Oscillator. These indicators can provide information about the volatility, momentum, and trend strength of the market, and can be used to confirm the signals generated by the primary indicators.
In the NNFX system, confirmation indicators are used in combination with primary indicators and other filters to create a trading system that is robust and reliable. By using multiple indicators to confirm trading signals, the system aims to reduce the risk of false signals and improve the overall profitability of the trades.
What is a Continuation indicator?
In the NNFX (No Nonsense Forex) trading system, a continuation indicator is a technical indicator that is used to confirm a current trend and predict that the trend is likely to continue in the same direction. A continuation indicator is typically used in conjunction with other indicators in the system, such as a baseline indicator, to provide a comprehensive trading strategy.
What is a Volatility/Volume indicator?
Volume indicators, such as the On Balance Volume (OBV), the Chaikin Money Flow (CMF), or the Volume Price Trend (VPT), are used to measure the amount of buying and selling activity in a market. They are based on the trading volume of the market, and can provide information about the strength of the trend. In the NNFX system, volume indicators are used to confirm trading signals generated by the Moving Average and the Relative Strength Index. Volatility indicators include Average Direction Index, Waddah Attar, and Volatility Ratio. In the NNFX trading system, volatility is a proxy for volume and vice versa.
By using volume indicators as confirmation tools, the NNFX trading system aims to reduce the risk of false signals and improve the overall profitability of trades. These indicators can provide additional information about the market that is not captured by the primary indicators, and can help traders to make more informed trading decisions. In addition, volume indicators can be used to identify potential changes in market trends and to confirm the strength of price movements.
What is an Exit indicator?
The exit indicator is used in conjunction with other indicators in the system, such as the Moving Average (MA), the Relative Strength Index (RSI), and the Average True Range (ATR), to provide a comprehensive trading strategy.
The exit indicator in the NNFX system can be any technical indicator that is deemed effective at identifying optimal exit points. Examples of exit indicators that are commonly used include the Parabolic SAR, the Average Directional Index (ADX), and the Chandelier Exit.
The purpose of the exit indicator is to identify when a trend is likely to reverse or when the market conditions have changed, signaling the need to exit a trade. By using an exit indicator, traders can manage their risk and prevent significant losses.
In the NNFX system, the exit indicator is used in conjunction with a stop loss and a take profit order to maximize profits and minimize losses. The stop loss order is used to limit the amount of loss that can be incurred if the trade goes against the trader, while the take profit order is used to lock in profits when the trade is moving in the trader's favor.
Overall, the use of an exit indicator in the NNFX trading system is an important component of a comprehensive trading strategy. It allows traders to manage their risk effectively and improve the profitability of their trades by exiting at the right time.
How does Loxx's GKD (Giga Kaleidoscope Modularized Trading System) implement the NNFX algorithm outlined above?
Loxx's GKD v1.0 system has five types of modules (indicators/strategies). These modules are:
1. GKD-BT - Backtesting module (Volatility, Number 1 in the NNFX algorithm)
2. GKD-B - Baseline module (Baseline and Volatility/Volume, Numbers 1 and 2 in the NNFX algorithm)
3. GKD-C - Confirmation 1/2 and Continuation module (Confirmation 1/2 and Continuation, Numbers 3, 4, and 5 in the NNFX algorithm)
4. GKD-V - Volatility/Volume module (Confirmation 1/2, Number 6 in the NNFX algorithm)
5. GKD-E - Exit module (Exit, Number 7 in the NNFX algorithm)
(additional module types will added in future releases)
Each module interacts with every module by passing data between modules. Data is passed between each module as described below:
GKD-B => GKD-V => GKD-C(1) => GKD-C(2) => GKD-C(Continuation) => GKD-E => GKD-BT
That is, the Baseline indicator passes its data to Volatility/Volume. The Volatility/Volume indicator passes its values to the Confirmation 1 indicator. The Confirmation 1 indicator passes its values to the Confirmation 2 indicator. The Confirmation 2 indicator passes its values to the Continuation indicator. The Continuation indicator passes its values to the Exit indicator, and finally, the Exit indicator passes its values to the Backtest strategy.
This chaining of indicators requires that each module conform to Loxx's GKD protocol, therefore allowing for the testing of every possible combination of technical indicators that make up the six components of the NNFX algorithm.
What does the application of the GKD trading system look like?
Example trading system:
Backtest: Strategy with 1-3 take profits, trailing stop loss, multiple types of PnL volatility, and 2 backtesting styles
Baseline: Hull Moving Average
Volatility/Volume: Hurst Exponent
Confirmation 1: CCI Adaptive Smoother as shown on the chart above
Confirmation 2: Williams Percent Range
Continuation: CCI Adaptive Smoother
Exit: Rex Oscillator
Each GKD indicator is denoted with a module identifier of either: GKD-BT, GKD-B, GKD-C, GKD-V, or GKD-E. This allows traders to understand to which module each indicator belongs and where each indicator fits into the GKD protocol chain.
Giga Kaleidoscope Modularized Trading System Signals (based on the NNFX algorithm)
Standard Entry
1. GKD-C Confirmation 1 Signal
2. GKD-B Baseline agrees
3. Price is within a range of 0.2x Volatility and 1.0x Volatility of the Goldie Locks Mean
4. GKD-C Confirmation 2 agrees
5. GKD-V Volatility/Volume agrees
Baseline Entry
1. GKD-B Baseline signal
2. GKD-C Confirmation 1 agrees
3. Price is within a range of 0.2x Volatility and 1.0x Volatility of the Goldie Locks Mean
4. GKD-C Confirmation 2 agrees
5. GKD-V Volatility/Volume agrees
6. GKD-C Confirmation 1 signal was less than 7 candles prior
Volatility/Volume Entry
1. GKD-V Volatility/Volume signal
2. GKD-C Confirmation 1 agrees
3. Price is within a range of 0.2x Volatility and 1.0x Volatility of the Goldie Locks Mean
4. GKD-C Confirmation 2 agrees
5. GKD-B Baseline agrees
6. GKD-C Confirmation 1 signal was less than 7 candles prior
Continuation Entry
1. Standard Entry, Baseline Entry, or Pullback; entry triggered previously
2. GKD-B Baseline hasn't crossed since entry signal trigger
3. GKD-C Confirmation Continuation Indicator signals
4. GKD-C Confirmation 1 agrees
5. GKD-B Baseline agrees
6. GKD-C Confirmation 2 agrees
1-Candle Rule Standard Entry
1. GKD-C Confirmation 1 signal
2. GKD-B Baseline agrees
3. Price is within a range of 0.2x Volatility and 1.0x Volatility of the Goldie Locks Mean
Next Candle:
1. Price retraced (Long: close < close or Short: close > close )
2. GKD-B Baseline agrees
3. GKD-C Confirmation 1 agrees
4. GKD-C Confirmation 2 agrees
5. GKD-V Volatility/Volume agrees
1-Candle Rule Baseline Entry
1. GKD-B Baseline signal
2. GKD-C Confirmation 1 agrees
3. Price is within a range of 0.2x Volatility and 1.0x Volatility of the Goldie Locks Mean
4. GKD-C Confirmation 1 signal was less than 7 candles prior
Next Candle:
1. Price retraced (Long: close < close or Short: close > close )
2. GKD-B Baseline agrees
3. GKD-C Confirmation 1 agrees
4. GKD-C Confirmation 2 agrees
5. GKD-V Volatility/Volume Agrees
1-Candle Rule Volatility/Volume Entry
1. GKD-V Volatility/Volume signal
2. GKD-C Confirmation 1 agrees
3. Price is within a range of 0.2x Volatility and 1.0x Volatility of the Goldie Locks Mean
4. GKD-C Confirmation 1 signal was less than 7 candles prior
Next Candle:
1. Price retraced (Long: close < close or Short: close > close)
2. GKD-B Volatility/Volume agrees
3. GKD-C Confirmation 1 agrees
4. GKD-C Confirmation 2 agrees
5. GKD-B Baseline agrees
PullBack Entry
1. GKD-B Baseline signal
2. GKD-C Confirmation 1 agrees
3. Price is beyond 1.0x Volatility of Baseline
Next Candle:
1. Price is within a range of 0.2x Volatility and 1.0x Volatility of the Goldie Locks Mean
2. GKD-C Confirmation 1 agrees
3. GKD-C Confirmation 2 agrees
4. GKD-V Volatility/Volume Agrees
]█ Setting up the GKD
The GKD system involves chaining indicators together. These are the steps to set this up.
Use a GKD-C indicator alone on a chart
1. Inside the GKD-C indicator, change the "Confirmation Type" setting to "Solo Confirmation Simple"
Use a GKD-V indicator alone on a chart
**nothing, it's already useable on the chart without any settings changes
Use a GKD-B indicator alone on a chart
**nothing, it's already useable on the chart without any settings changes
Baseline (Baseline, Backtest)
1. Import the GKD-B Baseline into the GKD-BT Backtest: "Input into Volatility/Volume or Backtest (Baseline testing)"
2. Inside the GKD-BT Backtest, change the setting "Backtest Special" to "Baseline"
Volatility/Volume (Volatility/Volume, Backte st)
1. Inside the GKD-V indicator, change the "Testing Type" setting to "Solo"
2. Inside the GKD-V indicator, change the "Signal Type" setting to "Crossing" (neither traditional nor both can be backtested)
3. Import the GKD-V indicator into the GKD-BT Backtest: "Input into C1 or Backtest"
4. Inside the GKD-BT Backtest, change the setting "Backtest Special" to "Volatility/Volume"
5. Inside the GKD-BT Backtest, a) change the setting "Backtest Type" to "Trading" if using a directional GKD-V indicator; or, b) change the setting "Backtest Type" to "Full" if using a directional or non-directional GKD-V indicator (non-directional GKD-V can only test Longs and Shorts separately)
6. If "Backtest Type" is set to "Full": Inside the GKD-BT Backtest, change the setting "Backtest Side" to "Long" or "Short
7. If "Backtest Type" is set to "Full": To allow the system to open multiple orders at one time so you test all Longs or Shorts, open the GKD-BT Backtest, click the tab "Properties" and then insert a value of something like 10 orders into the "Pyramiding" settings. This will allow 10 orders to be opened at one time which should be enough to catch all possible Longs or Shorts.
Solo Confirmation Simple (Confirmation, Backtest)
1. Inside the GKD-C indicator, change the "Confirmation Type" setting to "Solo Confirmation Simple"
1. Import the GKD-C indicator into the GKD-BT Backtest: "Input into Backtest"
2. Inside the GKD-BT Backtest, change the setting "Backtest Special" to "Solo Confirmation Simple"
Solo Confirmation Complex without Exits (Baseline, Volatility/Volume, Confirmation, Backtest)
1. Inside the GKD-V indicator, change the "Testing Type" setting to "Chained"
2. Import the GKD-B Baseline into the GKD-V indicator: "Input into Volatility/Volume or Backtest (Baseline testing)"
3. Inside the GKD-C indicator, change the "Confirmation Type" setting to "Solo Confirmation Complex"
4. Import the GKD-V indicator into the GKD-C indicator: "Input into C1 or Backtest"
5. Inside the GKD-BT Backtest, change the setting "Backtest Special" to "GKD Full wo/ Exits"
6. Import the GKD-C into the GKD-BT Backtest: "Input into Exit or Backtest"
Solo Confirmation Complex with Exits (Baseline, Volatility/Volume, Confirmation, Exit, Backtest)
1. Inside the GKD-V indicator, change the "Testing Type" setting to "Chained"
2. Import the GKD-B Baseline into the GKD-V indicator: "Input into Volatility/Volume or Backtest (Baseline testing)"
3. Inside the GKD-C indicator, change the "Confirmation Type" setting to "Solo Confirmation Complex"
4. Import the GKD-V indicator into the GKD-C indicator: "Input into C1 or Backtest"
5. Import the GKD-C indicator into the GKD-E indicator: "Input into Exit"
6. Inside the GKD-BT Backtest, change the setting "Backtest Special" to "GKD Full w/ Exits"
7. Import the GKD-E into the GKD-BT Backtest: "Input into Backtest"
Full GKD without Exits (Baseline, Volatility/Volume, Confirmation 1, Confirmation 2, Continuation, Backtest)
1. Inside the GKD-V indicator, change the "Testing Type" setting to "Chained"
2. Import the GKD-B Baseline into the GKD-V indicator: "Input into Volatility/Volume or Backtest (Baseline testing)"
3. Inside the GKD-C 1 indicator, change the "Confirmation Type" setting to "Confirmation 1"
4. Import the GKD-V indicator into the GKD-C 1 indicator: "Input into C1 or Backtest"
5. Inside the GKD-C 2 indicator, change the "Confirmation Type" setting to "Confirmation 2"
6. Import the GKD-C 1 indicator into the GKD-C 2 indicator: "Input into C2"
7. Inside the GKD-C Continuation indicator, change the "Confirmation Type" setting to "Continuation"
8. Inside the GKD-BT Backtest, change the setting "Backtest Special" to "GKD Full wo/ Exits"
9. Import the GKD-E into the GKD-BT Backtest: "Input into Exit or Backtest"
Full GKD with Exits (Baseline, Volatility/Volume, Confirmation 1, Confirmation 2, Continuation, Exit, Backtest)
1. Inside the GKD-V indicator, change the "Testing Type" setting to "Chained"
2. Import the GKD-B Baseline into the GKD-V indicator: "Input into Volatility/Volume or Backtest (Baseline testing)"
3. Inside the GKD-C 1 indicator, change the "Confirmation Type" setting to "Confirmation 1"
4. Import the GKD-V indicator into the GKD-C 1 indicator: "Input into C1 or Backtest"
5. Inside the GKD-C 2 indicator, change the "Confirmation Type" setting to "Confirmation 2"
6. Import the GKD-C 1 indicator into the GKD-C 2 indicator: "Input into C2"
7. Inside the GKD-C Continuation indicator, change the "Confirmation Type" setting to "Continuation"
8. Import the GKD-C Continuation indicator into the GKD-E indicator: "Input into Exit"
9. Inside the GKD-BT Backtest, change the setting "Backtest Special" to "GKD Full w/ Exits"
10. Import the GKD-E into the GKD-BT Backtest: "Input into Backtest"
Baseline + Volatility/Volume (Baseline, Volatility/Volume, Backtest)
1. Inside the GKD-V indicator, change the "Testing Type" setting to "Baseline + Volatility/Volume"
2. Inside the GKD-V indicator, make sure the "Signal Type" setting is set to "Traditional"
3. Import the GKD-B Baseline into the GKD-V indicator: "Input into Volatility/Volume or Backtest (Baseline testing)"
4. Inside the GKD-BT Backtest, change the setting "Backtest Special" to "Baseline + Volatility/Volume"
5. Import the GKD-V into the GKD-BT Backtest: "Input into C1 or Backtest"
6. Inside the GKD-BT Backtest, change the setting "Backtest Type" to "Full". For this backtest, you must test Longs and Shorts separately
7. To allow the system to open multiple orders at one time so you can test all Longs or Shorts, open the GKD-BT Backtest, click the tab "Properties" and then insert a value of something like 10 orders into the "Pyramiding" settings. This will allow 10 orders to be opened at one time which should be enough to catch all possible Longs or Shorts.
Requirements
Inputs
Confirmation 1: GKD-V Volatility / Volume indicator
Confirmation 2: GKD-C Confirmation indicator
Continuation: GKD-C Confirmation indicator
Solo Confirmation Simple: GKD-B Baseline
Solo Confirmation Complex: GKD-V Volatility / Volume indicator
Solo Confirmation Super Complex: GKD-V Volatility / Volume indicator
Stacked 1: None
Stacked 2+: GKD-C, GKD-V, or GKD-B Stacked 1
Outputs
Confirmation 1: GKD-C Confirmation 2 indicator
Confirmation 2: GKD-C Continuation indicator
Continuation: GKD-E Exit indicator
Solo Confirmation Simple: GKD-BT Backtest
Solo Confirmation Complex: GKD-BT Backtest or GKD-E Exit indicator
Solo Confirmation Super Complex: GKD-C Continuation indicator
Stacked 1: GKD-C, GKD-V, or GKD-B Stacked 2+
Stacked 2+: GKD-C, GKD-V, or GKD-B Stacked 2+ or GKD-BT Backtest
Additional features will be added in future releases.

GKD-C Stepped Moving Average of CCI [Loxx]Giga Kaleidoscope GKD-C Stepped Moving Average of CCI is a Confirmation module included in Loxx's "Giga Kaleidoscope Modularized Trading System".
█ Giga Kaleidoscope Modularized Trading System
What is Loxx's "Giga Kaleidoscope Modularized Trading System"?
The Giga Kaleidoscope Modularized Trading System is a trading system built on the philosophy of the NNFX (No Nonsense Forex) algorithmic trading.
What is the NNFX algorithmic trading strategy?
The NNFX (No-Nonsense Forex) trading system is a comprehensive approach to Forex trading that is designed to simplify the process and remove the confusion and complexity that often surrounds trading. The system was developed by a Forex trader who goes by the pseudonym "VP" and has gained a significant following in the Forex community.
The NNFX trading system is based on a set of rules and guidelines that help traders make objective and informed decisions. These rules cover all aspects of trading, including market analysis, trade entry, stop loss placement, and trade management.
Here are the main components of the NNFX trading system:
1. Trading Philosophy: The NNFX trading system is based on the idea that successful trading requires a comprehensive understanding of the market, objective analysis, and strict risk management. The system aims to remove subjective elements from trading and focuses on objective rules and guidelines.
2. Technical Analysis: The NNFX trading system relies heavily on technical analysis and uses a range of indicators to identify high-probability trading opportunities. The system uses a combination of trend-following and mean-reverting strategies to identify trades.
3. Market Structure: The NNFX trading system emphasizes the importance of understanding the market structure, including price action, support and resistance levels, and market cycles. The system uses a range of tools to identify the market structure, including trend lines, channels, and moving averages.
4. Trade Entry: The NNFX trading system has strict rules for trade entry. The system uses a combination of technical indicators to identify high-probability trades, and traders must meet specific criteria to enter a trade.
5. Stop Loss Placement: The NNFX trading system places a significant emphasis on risk management and requires traders to place a stop loss order on every trade. The system uses a combination of technical analysis and market structure to determine the appropriate stop loss level.
6. Trade Management: The NNFX trading system has specific rules for managing open trades. The system aims to minimize risk and maximize profit by using a combination of trailing stops, take profit levels, and position sizing.
Overall, the NNFX trading system is designed to be a straightforward and easy-to-follow approach to Forex trading that can be applied by traders of all skill levels.
Core components of an NNFX algorithmic trading strategy
The NNFX algorithm is built on the principles of trend, momentum, and volatility. There are six core components in the NNFX trading algorithm:
1. Volatility - price volatility; e.g., Average True Range, True Range Double, Close-to-Close, etc.
2. Baseline - a moving average to identify price trend
3. Confirmation 1 - a technical indicator used to identify trends
4. Confirmation 2 - a technical indicator used to identify trends
5. Continuation - a technical indicator used to identify trends
6. Volatility/Volume - a technical indicator used to identify volatility/volume breakouts/breakdown
7. Exit - a technical indicator used to determine when a trend is exhausted
What is Volatility in the NNFX trading system?
In the NNFX (No Nonsense Forex) trading system, ATR (Average True Range) is typically used to measure the volatility of an asset. It is used as a part of the system to help determine the appropriate stop loss and take profit levels for a trade. ATR is calculated by taking the average of the true range values over a specified period.
True range is calculated as the maximum of the following values:
-Current high minus the current low
-Absolute value of the current high minus the previous close
-Absolute value of the current low minus the previous close
ATR is a dynamic indicator that changes with changes in volatility. As volatility increases, the value of ATR increases, and as volatility decreases, the value of ATR decreases. By using ATR in NNFX system, traders can adjust their stop loss and take profit levels according to the volatility of the asset being traded. This helps to ensure that the trade is given enough room to move, while also minimizing potential losses.
Other types of volatility include True Range Double (TRD), Close-to-Close, and Garman-Klass
What is a Baseline indicator?
The baseline is essentially a moving average, and is used to determine the overall direction of the market.
The baseline in the NNFX system is used to filter out trades that are not in line with the long-term trend of the market. The baseline is plotted on the chart along with other indicators, such as the Moving Average (MA), the Relative Strength Index (RSI), and the Average True Range (ATR).
Trades are only taken when the price is in the same direction as the baseline. For example, if the baseline is sloping upwards, only long trades are taken, and if the baseline is sloping downwards, only short trades are taken. This approach helps to ensure that trades are in line with the overall trend of the market, and reduces the risk of entering trades that are likely to fail.
By using a baseline in the NNFX system, traders can have a clear reference point for determining the overall trend of the market, and can make more informed trading decisions. The baseline helps to filter out noise and false signals, and ensures that trades are taken in the direction of the long-term trend.
What is a Confirmation indicator?
Confirmation indicators are technical indicators that are used to confirm the signals generated by primary indicators. Primary indicators are the core indicators used in the NNFX system, such as the Average True Range (ATR), the Moving Average (MA), and the Relative Strength Index (RSI).
The purpose of the confirmation indicators is to reduce false signals and improve the accuracy of the trading system. They are designed to confirm the signals generated by the primary indicators by providing additional information about the strength and direction of the trend.
Some examples of confirmation indicators that may be used in the NNFX system include the Bollinger Bands, the MACD (Moving Average Convergence Divergence), and the MACD Oscillator. These indicators can provide information about the volatility, momentum, and trend strength of the market, and can be used to confirm the signals generated by the primary indicators.
In the NNFX system, confirmation indicators are used in combination with primary indicators and other filters to create a trading system that is robust and reliable. By using multiple indicators to confirm trading signals, the system aims to reduce the risk of false signals and improve the overall profitability of the trades.
What is a Continuation indicator?
In the NNFX (No Nonsense Forex) trading system, a continuation indicator is a technical indicator that is used to confirm a current trend and predict that the trend is likely to continue in the same direction. A continuation indicator is typically used in conjunction with other indicators in the system, such as a baseline indicator, to provide a comprehensive trading strategy.
What is a Volatility/Volume indicator?
Volume indicators, such as the On Balance Volume (OBV), the Chaikin Money Flow (CMF), or the Volume Price Trend (VPT), are used to measure the amount of buying and selling activity in a market. They are based on the trading volume of the market, and can provide information about the strength of the trend. In the NNFX system, volume indicators are used to confirm trading signals generated by the Moving Average and the Relative Strength Index. Volatility indicators include Average Direction Index, Waddah Attar, and Volatility Ratio. In the NNFX trading system, volatility is a proxy for volume and vice versa.
By using volume indicators as confirmation tools, the NNFX trading system aims to reduce the risk of false signals and improve the overall profitability of trades. These indicators can provide additional information about the market that is not captured by the primary indicators, and can help traders to make more informed trading decisions. In addition, volume indicators can be used to identify potential changes in market trends and to confirm the strength of price movements.
What is an Exit indicator?
The exit indicator is used in conjunction with other indicators in the system, such as the Moving Average (MA), the Relative Strength Index (RSI), and the Average True Range (ATR), to provide a comprehensive trading strategy.
The exit indicator in the NNFX system can be any technical indicator that is deemed effective at identifying optimal exit points. Examples of exit indicators that are commonly used include the Parabolic SAR, the Average Directional Index (ADX), and the Chandelier Exit.
The purpose of the exit indicator is to identify when a trend is likely to reverse or when the market conditions have changed, signaling the need to exit a trade. By using an exit indicator, traders can manage their risk and prevent significant losses.
In the NNFX system, the exit indicator is used in conjunction with a stop loss and a take profit order to maximize profits and minimize losses. The stop loss order is used to limit the amount of loss that can be incurred if the trade goes against the trader, while the take profit order is used to lock in profits when the trade is moving in the trader's favor.
Overall, the use of an exit indicator in the NNFX trading system is an important component of a comprehensive trading strategy. It allows traders to manage their risk effectively and improve the profitability of their trades by exiting at the right time.
How does Loxx's GKD (Giga Kaleidoscope Modularized Trading System) implement the NNFX algorithm outlined above?
Loxx's GKD v1.0 system has five types of modules (indicators/strategies). These modules are:
1. GKD-BT - Backtesting module (Volatility, Number 1 in the NNFX algorithm)
2. GKD-B - Baseline module (Baseline and Volatility/Volume, Numbers 1 and 2 in the NNFX algorithm)
3. GKD-C - Confirmation 1/2 and Continuation module (Confirmation 1/2 and Continuation, Numbers 3, 4, and 5 in the NNFX algorithm)
4. GKD-V - Volatility/Volume module (Confirmation 1/2, Number 6 in the NNFX algorithm)
5. GKD-E - Exit module (Exit, Number 7 in the NNFX algorithm)
(additional module types will added in future releases)
Each module interacts with every module by passing data between modules. Data is passed between each module as described below:
GKD-B => GKD-V => GKD-C(1) => GKD-C(2) => GKD-C(Continuation) => GKD-E => GKD-BT
That is, the Baseline indicator passes its data to Volatility/Volume. The Volatility/Volume indicator passes its values to the Confirmation 1 indicator. The Confirmation 1 indicator passes its values to the Confirmation 2 indicator. The Confirmation 2 indicator passes its values to the Continuation indicator. The Continuation indicator passes its values to the Exit indicator, and finally, the Exit indicator passes its values to the Backtest strategy.
This chaining of indicators requires that each module conform to Loxx's GKD protocol, therefore allowing for the testing of every possible combination of technical indicators that make up the six components of the NNFX algorithm.
What does the application of the GKD trading system look like?
Example trading system:
Backtest: Strategy with 1-3 take profits, trailing stop loss, multiple types of PnL volatility, and 2 backtesting styles
Baseline: Hull Moving Average
Volatility/Volume: Hurst Exponent
Confirmation 1: Stepped Moving Average of CCI as shown on the chart above
Confirmation 2: Williams Percent Range
Continuation: Fisher Transform
Exit: Rex Oscillator
Each GKD indicator is denoted with a module identifier of either: GKD-BT, GKD-B, GKD-C, GKD-V, or GKD-E. This allows traders to understand to which module each indicator belongs and where each indicator fits into the GKD protocol chain.
Giga Kaleidoscope Modularized Trading System Signals (based on the NNFX algorithm)
Standard Entry
1. GKD-C Confirmation 1 Signal
2. GKD-B Baseline agrees
3. Price is within a range of 0.2x Volatility and 1.0x Volatility of the Goldie Locks Mean
4. GKD-C Confirmation 2 agrees
5. GKD-V Volatility/Volume agrees
Baseline Entry
1. GKD-B Baseline signal
2. GKD-C Confirmation 1 agrees
3. Price is within a range of 0.2x Volatility and 1.0x Volatility of the Goldie Locks Mean
4. GKD-C Confirmation 2 agrees
5. GKD-V Volatility/Volume agrees
6. GKD-C Confirmation 1 signal was less than 7 candles prior
Volatility/Volume Entry
1. GKD-V Volatility/Volume signal
2. GKD-C Confirmation 1 agrees
3. Price is within a range of 0.2x Volatility and 1.0x Volatility of the Goldie Locks Mean
4. GKD-C Confirmation 2 agrees
5. GKD-B Baseline agrees
6. GKD-C Confirmation 1 signal was less than 7 candles prior
Continuation Entry
1. Standard Entry, Baseline Entry, or Pullback; entry triggered previously
2. GKD-B Baseline hasn't crossed since entry signal trigger
3. GKD-C Confirmation Continuation Indicator signals
4. GKD-C Confirmation 1 agrees
5. GKD-B Baseline agrees
6. GKD-C Confirmation 2 agrees
1-Candle Rule Standard Entry
1. GKD-C Confirmation 1 signal
2. GKD-B Baseline agrees
3. Price is within a range of 0.2x Volatility and 1.0x Volatility of the Goldie Locks Mean
Next Candle:
1. Price retraced (Long: close < close or Short: close > close )
2. GKD-B Baseline agrees
3. GKD-C Confirmation 1 agrees
4. GKD-C Confirmation 2 agrees
5. GKD-V Volatility/Volume agrees
1-Candle Rule Baseline Entry
1. GKD-B Baseline signal
2. GKD-C Confirmation 1 agrees
3. Price is within a range of 0.2x Volatility and 1.0x Volatility of the Goldie Locks Mean
4. GKD-C Confirmation 1 signal was less than 7 candles prior
Next Candle:
1. Price retraced (Long: close < close or Short: close > close )
2. GKD-B Baseline agrees
3. GKD-C Confirmation 1 agrees
4. GKD-C Confirmation 2 agrees
5. GKD-V Volatility/Volume Agrees
1-Candle Rule Volatility/Volume Entry
1. GKD-V Volatility/Volume signal
2. GKD-C Confirmation 1 agrees
3. Price is within a range of 0.2x Volatility and 1.0x Volatility of the Goldie Locks Mean
4. GKD-C Confirmation 1 signal was less than 7 candles prior
Next Candle:
1. Price retraced (Long: close < close or Short: close > close)
2. GKD-B Volatility/Volume agrees
3. GKD-C Confirmation 1 agrees
4. GKD-C Confirmation 2 agrees
5. GKD-B Baseline agrees
PullBack Entry
1. GKD-B Baseline signal
2. GKD-C Confirmation 1 agrees
3. Price is beyond 1.0x Volatility of Baseline
Next Candle:
1. Price is within a range of 0.2x Volatility and 1.0x Volatility of the Goldie Locks Mean
2. GKD-C Confirmation 1 agrees
3. GKD-C Confirmation 2 agrees
4. GKD-V Volatility/Volume Agrees
]█ Setting up the GKD
The GKD system involves chaining indicators together. These are the steps to set this up.
Use a GKD-C indicator alone on a chart
1. Inside the GKD-C indicator, change the "Confirmation Type" setting to "Solo Confirmation Simple"
Use a GKD-V indicator alone on a chart
**nothing, it's already useable on the chart without any settings changes
Use a GKD-B indicator alone on a chart
**nothing, it's already useable on the chart without any settings changes
Baseline (Baseline, Backtest)
1. Import the GKD-B Baseline into the GKD-BT Backtest: "Input into Volatility/Volume or Backtest (Baseline testing)"
2. Inside the GKD-BT Backtest, change the setting "Backtest Special" to "Baseline"
Volatility/Volume (Volatility/Volume, Backte st)
1. Inside the GKD-V indicator, change the "Testing Type" setting to "Solo"
2. Inside the GKD-V indicator, change the "Signal Type" setting to "Crossing" (neither traditional nor both can be backtested)
3. Import the GKD-V indicator into the GKD-BT Backtest: "Input into C1 or Backtest"
4. Inside the GKD-BT Backtest, change the setting "Backtest Special" to "Volatility/Volume"
5. Inside the GKD-BT Backtest, a) change the setting "Backtest Type" to "Trading" if using a directional GKD-V indicator; or, b) change the setting "Backtest Type" to "Full" if using a directional or non-directional GKD-V indicator (non-directional GKD-V can only test Longs and Shorts separately)
6. If "Backtest Type" is set to "Full": Inside the GKD-BT Backtest, change the setting "Backtest Side" to "Long" or "Short
7. If "Backtest Type" is set to "Full": To allow the system to open multiple orders at one time so you test all Longs or Shorts, open the GKD-BT Backtest, click the tab "Properties" and then insert a value of something like 10 orders into the "Pyramiding" settings. This will allow 10 orders to be opened at one time which should be enough to catch all possible Longs or Shorts.
Solo Confirmation Simple (Confirmation, Backtest)
1. Inside the GKD-C indicator, change the "Confirmation Type" setting to "Solo Confirmation Simple"
1. Import the GKD-C indicator into the GKD-BT Backtest: "Input into Backtest"
2. Inside the GKD-BT Backtest, change the setting "Backtest Special" to "Solo Confirmation Simple"
Solo Confirmation Complex without Exits (Baseline, Volatility/Volume, Confirmation, Backtest)
1. Inside the GKD-V indicator, change the "Testing Type" setting to "Chained"
2. Import the GKD-B Baseline into the GKD-V indicator: "Input into Volatility/Volume or Backtest (Baseline testing)"
3. Inside the GKD-C indicator, change the "Confirmation Type" setting to "Solo Confirmation Complex"
4. Import the GKD-V indicator into the GKD-C indicator: "Input into C1 or Backtest"
5. Inside the GKD-BT Backtest, change the setting "Backtest Special" to "GKD Full wo/ Exits"
6. Import the GKD-C into the GKD-BT Backtest: "Input into Exit"
Solo Confirmation Complex with Exits (Baseline, Volatility/Volume, Confirmation, Exit, Backtest)
1. Inside the GKD-V indicator, change the "Testing Type" setting to "Chained"
2. Import the GKD-B Baseline into the GKD-V indicator: "Input into Volatility/Volume or Backtest (Baseline testing)"
3. Inside the GKD-C indicator, change the "Confirmation Type" setting to "Solo Confirmation Complex"
4. Import the GKD-V indicator into the GKD-C indicator: "Input into C1 or Backtest"
5. Import the GKD-C indicator into the GKD-E indicator: "Input into Exit"
6. Inside the GKD-BT Backtest, change the setting "Backtest Special" to "GKD Full w/ Exits"
7. Import the GKD-E into the GKD-BT Backtest: "Input into Backtest"
Full GKD without Exits (Baseline, Volatility/Volume, Confirmation 1, Confirmation 2, Continuation, Backtest)
1. Inside the GKD-V indicator, change the "Testing Type" setting to "Chained"
2. Import the GKD-B Baseline into the GKD-V indicator: "Input into Volatility/Volume or Backtest (Baseline testing)"
3. Inside the GKD-C 1 indicator, change the "Confirmation Type" setting to "Confirmation 1"
4. Import the GKD-V indicator into the GKD-C 1 indicator: "Input into C1 or Backtest"
5. Inside the GKD-C 2 indicator, change the "Confirmation Type" setting to "Confirmation 2"
6. Import the GKD-C 1 indicator into the GKD-C 2 indicator: "Input into C2"
7. Inside the GKD-C Continuation indicator, change the "Confirmation Type" setting to "Continuation"
8. Inside the GKD-BT Backtest, change the setting "Backtest Special" to "GKD Full wo/ Exits"
9. Import the GKD-E into the GKD-BT Backtest: "Input into Exit"
Full GKD with Exits (Baseline, Volatility/Volume, Confirmation 1, Confirmation 2, Continuation, Exit, Backtest)
1. Inside the GKD-V indicator, change the "Testing Type" setting to "Chained"
2. Import the GKD-B Baseline into the GKD-V indicator: "Input into Volatility/Volume or Backtest (Baseline testing)"
3. Inside the GKD-C 1 indicator, change the "Confirmation Type" setting to "Confirmation 1"
4. Import the GKD-V indicator into the GKD-C 1 indicator: "Input into C1 or Backtest"
5. Inside the GKD-C 2 indicator, change the "Confirmation Type" setting to "Confirmation 2"
6. Import the GKD-C 1 indicator into the GKD-C 2 indicator: "Input into C2"
7. Inside the GKD-C Continuation indicator, change the "Confirmation Type" setting to "Continuation"
8. Import the GKD-C Continuation indicator into the GKD-E indicator: "Input into Exit"
9. Inside the GKD-BT Backtest, change the setting "Backtest Special" to "GKD Full w/ Exits"
10. Import the GKD-E into the GKD-BT Backtest: "Input into Backtest"
Baseline + Volatility/Volume (Baseline, Volatility/Volume, Backtest)
1. Inside the GKD-V indicator, change the "Testing Type" setting to "Baseline + Volatility/Volume"
2. Inside the GKD-V indicator, make sure the "Signal Type" setting is set to "Traditional"
3. Import the GKD-B Baseline into the GKD-V indicator: "Input into Volatility/Volume or Backtest (Baseline testing)"
4. Inside the GKD-BT Backtest, change the setting "Backtest Special" to "Baseline + Volatility/Volume"
5. Import the GKD-V into the GKD-BT Backtest: "Input into C1 or Backtest"
6. Inside the GKD-BT Backtest, change the setting "Backtest Type" to "Full". For this backtest, you must test Longs and Shorts separately
7. To allow the system to open multiple orders at one time so you can test all Longs or Shorts, open the GKD-BT Backtest, click the tab "Properties" and then insert a value of something like 10 orders into the "Pyramiding" settings. This will allow 10 orders to be opened at one time which should be enough to catch all possible Longs or Shorts.
█ GKD-C Stepped Moving Average of CCI
What is Stepped Moving Average?
The Step MA function is a custom implementation of a step-moving average that uses the high and low prices of a security, along with the current price, to calculate the maximum and minimum step-moving average values. It then determines the current trend based on the relationship between the current price and the maximum and minimum values, and calculates the step-moving average for that trend. The calculated step-moving average is returned as the output of the function.
What is CCI?
CCI, or Commodity Channel Index, is a momentum-based technical analysis indicator developed by Donald Lambert in 1980. Initially created for the commodity markets, CCI has since been widely adopted for use in various financial markets, including stocks, forex, and indices.
The CCI measures the difference between the current price and its historical average relative to the average price fluctuations over a specific period. It helps traders identify potential overbought and oversold conditions and possible trend reversals.
The CCI is calculated as follows:
Calculate the Typical Price (TP) for each period: TP = (High + Low + Close) / 3
Calculate the Simple Moving Average (SMA) of the Typical Price over the chosen period (usually 14 or 20 periods).
Calculate the Mean Deviation (MD) by finding the average of the absolute difference between the Typical Price and its SMA for each period.
Calculate the CCI: CCI = (Typical Price - SMA) / (0.015 * Mean Deviation)
The constant 0.015 is a scaling factor that brings the CCI values within a standardized range, typically -100 to +100. Some traders might use different scaling factors depending on their preferences.
When using the CCI, traders consider the following:
Values above +100 typically indicate overbought conditions, suggesting a potential price decline.
Values below -100 typically indicate oversold conditions, suggesting a potential price increase.
CCI crossing above or below the zero line can signal a change in the direction of the market trend.
It is important to note that the CCI is a versatile indicator and can be used in combination with other technical analysis tools to improve the accuracy of trading signals.
What is the Stepped Moving Average of CCI?
This indicator runs the CCI through Stepped Moving Average algorithm to derive a smoother CCI.
Requirements
Inputs
Confirmation 1: GKD-V Volatility / Volume indicator
Confirmation 2: GKD-C Confirmation indicator
Continuation: GKD-C Confirmation indicator
Solo Confirmation Simple: GKD-B Baseline
Solo Confirmation Complex: GKD-V Volatility / Volume indicator
Solo Confirmation Super Complex: GKD-V Volatility / Volume indicator
Stacked 1: None
Stacked 2+: GKD-C, GKD-V, or GKD-B Stacked 1
Outputs
Confirmation 1: GKD-C Confirmation 2 indicator
Confirmation 2: GKD-C Continuation indicator
Continuation: GKD-E Exit indicator
Solo Confirmation Simple: GKD-BT Backtest
Solo Confirmation Complex: GKD-BT Backtest or GKD-E Exit indicator
Solo Confirmation Super Complex: GKD-C Continuation indicator
Stacked 1: GKD-C, GKD-V, or GKD-B Stacked 2+
Stacked 2+: GKD-C, GKD-V, or GKD-B Stacked 2+ or GKD-BT Backtest
Additional features will be added in future releases.

GKD-C Genesis Matrix [Loxx]Giga Kaleidoscope GKD-C Genesis Matrix is a Confirmation module included in Loxx's "Giga Kaleidoscope Modularized Trading System".
█ Giga Kaleidoscope Modularized Trading System
What is Loxx's "Giga Kaleidoscope Modularized Trading System"?
The Giga Kaleidoscope Modularized Trading System is a trading system built on the philosophy of the NNFX (No Nonsense Forex) algorithmic trading.
What is the NNFX algorithmic trading strategy?
The NNFX (No-Nonsense Forex) trading system is a comprehensive approach to Forex trading that is designed to simplify the process and remove the confusion and complexity that often surrounds trading. The system was developed by a Forex trader who goes by the pseudonym "VP" and has gained a significant following in the Forex community.
The NNFX trading system is based on a set of rules and guidelines that help traders make objective and informed decisions. These rules cover all aspects of trading, including market analysis, trade entry, stop loss placement, and trade management.
Here are the main components of the NNFX trading system:
1. Trading Philosophy: The NNFX trading system is based on the idea that successful trading requires a comprehensive understanding of the market, objective analysis, and strict risk management. The system aims to remove subjective elements from trading and focuses on objective rules and guidelines.
2. Technical Analysis: The NNFX trading system relies heavily on technical analysis and uses a range of indicators to identify high-probability trading opportunities. The system uses a combination of trend-following and mean-reverting strategies to identify trades.
3. Market Structure: The NNFX trading system emphasizes the importance of understanding the market structure, including price action, support and resistance levels, and market cycles. The system uses a range of tools to identify the market structure, including trend lines, channels, and moving averages.
4. Trade Entry: The NNFX trading system has strict rules for trade entry. The system uses a combination of technical indicators to identify high-probability trades, and traders must meet specific criteria to enter a trade.
5. Stop Loss Placement: The NNFX trading system places a significant emphasis on risk management and requires traders to place a stop loss order on every trade. The system uses a combination of technical analysis and market structure to determine the appropriate stop loss level.
6. Trade Management: The NNFX trading system has specific rules for managing open trades. The system aims to minimize risk and maximize profit by using a combination of trailing stops, take profit levels, and position sizing.
Overall, the NNFX trading system is designed to be a straightforward and easy-to-follow approach to Forex trading that can be applied by traders of all skill levels.
Core components of an NNFX algorithmic trading strategy
The NNFX algorithm is built on the principles of trend, momentum, and volatility. There are six core components in the NNFX trading algorithm:
1. Volatility - price volatility; e.g., Average True Range, True Range Double, Close-to-Close, etc.
2. Baseline - a moving average to identify price trend
3. Confirmation 1 - a technical indicator used to identify trends
4. Confirmation 2 - a technical indicator used to identify trends
5. Continuation - a technical indicator used to identify trends
6. Volatility/Volume - a technical indicator used to identify volatility/volume breakouts/breakdown
7. Exit - a technical indicator used to determine when a trend is exhausted
What is Volatility in the NNFX trading system?
In the NNFX (No Nonsense Forex) trading system, ATR (Average True Range) is typically used to measure the volatility of an asset. It is used as a part of the system to help determine the appropriate stop loss and take profit levels for a trade. ATR is calculated by taking the average of the true range values over a specified period.
True range is calculated as the maximum of the following values:
-Current high minus the current low
-Absolute value of the current high minus the previous close
-Absolute value of the current low minus the previous close
ATR is a dynamic indicator that changes with changes in volatility. As volatility increases, the value of ATR increases, and as volatility decreases, the value of ATR decreases. By using ATR in NNFX system, traders can adjust their stop loss and take profit levels according to the volatility of the asset being traded. This helps to ensure that the trade is given enough room to move, while also minimizing potential losses.
Other types of volatility include True Range Double (TRD), Close-to-Close, and Garman-Klass
What is a Baseline indicator?
The baseline is essentially a moving average, and is used to determine the overall direction of the market.
The baseline in the NNFX system is used to filter out trades that are not in line with the long-term trend of the market. The baseline is plotted on the chart along with other indicators, such as the Moving Average (MA), the Relative Strength Index (RSI), and the Average True Range (ATR).
Trades are only taken when the price is in the same direction as the baseline. For example, if the baseline is sloping upwards, only long trades are taken, and if the baseline is sloping downwards, only short trades are taken. This approach helps to ensure that trades are in line with the overall trend of the market, and reduces the risk of entering trades that are likely to fail.
By using a baseline in the NNFX system, traders can have a clear reference point for determining the overall trend of the market, and can make more informed trading decisions. The baseline helps to filter out noise and false signals, and ensures that trades are taken in the direction of the long-term trend.
What is a Confirmation indicator?
Confirmation indicators are technical indicators that are used to confirm the signals generated by primary indicators. Primary indicators are the core indicators used in the NNFX system, such as the Average True Range (ATR), the Moving Average (MA), and the Relative Strength Index (RSI).
The purpose of the confirmation indicators is to reduce false signals and improve the accuracy of the trading system. They are designed to confirm the signals generated by the primary indicators by providing additional information about the strength and direction of the trend.
Some examples of confirmation indicators that may be used in the NNFX system include the Bollinger Bands, the MACD (Moving Average Convergence Divergence), and the MACD Oscillator. These indicators can provide information about the volatility, momentum, and trend strength of the market, and can be used to confirm the signals generated by the primary indicators.
In the NNFX system, confirmation indicators are used in combination with primary indicators and other filters to create a trading system that is robust and reliable. By using multiple indicators to confirm trading signals, the system aims to reduce the risk of false signals and improve the overall profitability of the trades.
What is a Continuation indicator?
In the NNFX (No Nonsense Forex) trading system, a continuation indicator is a technical indicator that is used to confirm a current trend and predict that the trend is likely to continue in the same direction. A continuation indicator is typically used in conjunction with other indicators in the system, such as a baseline indicator, to provide a comprehensive trading strategy.
What is a Volatility/Volume indicator?
Volume indicators, such as the On Balance Volume (OBV), the Chaikin Money Flow (CMF), or the Volume Price Trend (VPT), are used to measure the amount of buying and selling activity in a market. They are based on the trading volume of the market, and can provide information about the strength of the trend. In the NNFX system, volume indicators are used to confirm trading signals generated by the Moving Average and the Relative Strength Index. Volatility indicators include Average Direction Index, Waddah Attar, and Volatility Ratio. In the NNFX trading system, volatility is a proxy for volume and vice versa.
By using volume indicators as confirmation tools, the NNFX trading system aims to reduce the risk of false signals and improve the overall profitability of trades. These indicators can provide additional information about the market that is not captured by the primary indicators, and can help traders to make more informed trading decisions. In addition, volume indicators can be used to identify potential changes in market trends and to confirm the strength of price movements.
What is an Exit indicator?
The exit indicator is used in conjunction with other indicators in the system, such as the Moving Average (MA), the Relative Strength Index (RSI), and the Average True Range (ATR), to provide a comprehensive trading strategy.
The exit indicator in the NNFX system can be any technical indicator that is deemed effective at identifying optimal exit points. Examples of exit indicators that are commonly used include the Parabolic SAR, the Average Directional Index (ADX), and the Chandelier Exit.
The purpose of the exit indicator is to identify when a trend is likely to reverse or when the market conditions have changed, signaling the need to exit a trade. By using an exit indicator, traders can manage their risk and prevent significant losses.
In the NNFX system, the exit indicator is used in conjunction with a stop loss and a take profit order to maximize profits and minimize losses. The stop loss order is used to limit the amount of loss that can be incurred if the trade goes against the trader, while the take profit order is used to lock in profits when the trade is moving in the trader's favor.
Overall, the use of an exit indicator in the NNFX trading system is an important component of a comprehensive trading strategy. It allows traders to manage their risk effectively and improve the profitability of their trades by exiting at the right time.
How does Loxx's GKD (Giga Kaleidoscope Modularized Trading System) implement the NNFX algorithm outlined above?
Loxx's GKD v1.0 system has five types of modules (indicators/strategies). These modules are:
1. GKD-BT - Backtesting module (Volatility, Number 1 in the NNFX algorithm)
2. GKD-B - Baseline module (Baseline and Volatility/Volume, Numbers 1 and 2 in the NNFX algorithm)
3. GKD-C - Confirmation 1/2 and Continuation module (Confirmation 1/2 and Continuation, Numbers 3, 4, and 5 in the NNFX algorithm)
4. GKD-V - Volatility/Volume module (Confirmation 1/2, Number 6 in the NNFX algorithm)
5. GKD-E - Exit module (Exit, Number 7 in the NNFX algorithm)
(additional module types will added in future releases)
Each module interacts with every module by passing data between modules. Data is passed between each module as described below:
GKD-B => GKD-V => GKD-C(1) => GKD-C(2) => GKD-C(Continuation) => GKD-E => GKD-BT
That is, the Baseline indicator passes its data to Volatility/Volume. The Volatility/Volume indicator passes its values to the Confirmation 1 indicator. The Confirmation 1 indicator passes its values to the Confirmation 2 indicator. The Confirmation 2 indicator passes its values to the Continuation indicator. The Continuation indicator passes its values to the Exit indicator, and finally, the Exit indicator passes its values to the Backtest strategy.
This chaining of indicators requires that each module conform to Loxx's GKD protocol, therefore allowing for the testing of every possible combination of technical indicators that make up the six components of the NNFX algorithm.
What does the application of the GKD trading system look like?
Example trading system:
Backtest: Strategy with 1-3 take profits, trailing stop loss, multiple types of PnL volatility, and 2 backtesting styles
Baseline: Hull Moving Average
Volatility/Volume: Hurst Exponent
Confirmation 1: Genesis Matrix as shown on the chart above
Confirmation 2: Williams Percent Range
Continuation: Fisher Transform
Exit: Rex Oscillator
Each GKD indicator is denoted with a module identifier of either: GKD-BT, GKD-B, GKD-C, GKD-V, or GKD-E. This allows traders to understand to which module each indicator belongs and where each indicator fits into the GKD protocol chain.
Giga Kaleidoscope Modularized Trading System Signals (based on the NNFX algorithm)
Standard Entry
1. GKD-C Confirmation 1 Signal
2. GKD-B Baseline agrees
3. Price is within a range of 0.2x Volatility and 1.0x Volatility of the Goldie Locks Mean
4. GKD-C Confirmation 2 agrees
5. GKD-V Volatility/Volume agrees
Baseline Entry
1. GKD-B Baseline signal
2. GKD-C Confirmation 1 agrees
3. Price is within a range of 0.2x Volatility and 1.0x Volatility of the Goldie Locks Mean
4. GKD-C Confirmation 2 agrees
5. GKD-V Volatility/Volume agrees
6. GKD-C Confirmation 1 signal was less than 7 candles prior
Continuation Entry
1. Standard Entry, Baseline Entry, or Pullback; entry triggered previously
2. GKD-B Baseline hasn't crossed since entry signal trigger
3. GKD-C Confirmation Continuation Indicator signals
4. GKD-C Confirmation 1 agrees
5. GKD-B Baseline agrees
6. GKD-C Confirmation 2 agrees
1-Candle Rule Standard Entry
1. GKD-C Confirmation 1 signal
2. GKD-B Baseline agrees
3. Price is within a range of 0.2x Volatility and 1.0x Volatility of the Goldie Locks Mean
Next Candle:
1. Price retraced (Long: close < close or Short: close > close )
2. GKD-B Baseline agrees
3. GKD-C Confirmation 1 agrees
4. GKD-C Confirmation 2 agrees
5. GKD-V Volatility/Volume agrees
1-Candle Rule Baseline Entry
1. GKD-B Baseline signal
2. GKD-C Confirmation 1 agrees
3. Price is within a range of 0.2x Volatility and 1.0x Volatility of the Goldie Locks Mean
4. GKD-C Confirmation 1 signal was less than 7 candles prior
Next Candle:
1. Price retraced (Long: close < close or Short: close > close )
2. GKD-B Baseline agrees
3. GKD-C Confirmation 1 agrees
4. GKD-C Confirmation 2 agrees
5. GKD-V Volatility/Volume Agrees
PullBack Entry
1. GKD-B Baseline signal
2. GKD-C Confirmation 1 agrees
3. Price is beyond 1.0x Volatility of Baseline
Next Candle:
1. Price is within a range of 0.2x Volatility and 1.0x Volatility of the Goldie Locks Mean
3. GKD-C Confirmation 1 agrees
4. GKD-C Confirmation 2 agrees
5. GKD-V Volatility/Volume Agrees
█ GKD-C Genesis Matrix
What is T3?
The T3 moving average is an indicator of an indicator since it includes several EMAs of another EMA . Unlike any other moving average, it adds the so-called volume factor, a value between 0 and 1. Like the SMA , traders typically use this indicator to spot trends and trend reversals.
What is CCI?
The Commodity Channel Index ( CCI ) measures the current price level relative to an average price level over a given period of time. CCI is relatively high when prices are far above their average. CCI is relatively low when prices are far below their average. Using this method, CCI can be used to identify overbought and oversold levels.
Genesis matrix uses Jurik-Smoothed CCI w/ MA Deviation--a spin on regular CCI .Usually CCI is calculated as using average ( Simple Moving Average ) and mean deviation. In this version, average is replaced with well known JMA (Jurik Moving Average) instead for the smoothing phase and the deviation is replaced with variety moving average deviation. The result in this one is responsive and fast (as expected) and also it is smoother than the original CCI (as expected).
What is SSL?
Known as the SSL , the Semaphore Signal Level channel chart alert is an indicator that combines moving averages to provide you with a clear visual signal of price movement dynamics. In short, it's designed to show you when a price trend is forming. For our purposes here, SSL has been modified to allow for different moving average selection and different closing price look back periods.
What is William Blau Ergodic Tick Volume?
This is one of the techniques described by William Blau in his book "Momentum, Direction and Divergence" (1995). If you like to learn more, we advise you to read this book. His book focuses on three key aspects of trading: momentum, direction and divergence. Blau, who was an electrical engineer before becoming a trader, thoroughly examines the relationship between price and momentum in step-by-step examples. From this grounding, he then looks at the deficiencies in other oscillators and introduces some innovative techniques, including a fresh twist on Stochastics. On directional issues, he analyzes the intricacies of ADX and offers a unique approach to help define trending and non-trending periods.
William Blau's definition of TVI ergodicity is that the indictor is ergodic when periods are set to 32, 5, 1, and the signal is set to 5. Other combinations are not ergodic, according to Blau.
What is Genesis Matrix?
Genesis Matrix combines all 4 indicators into one signal, long or short
Requirements
Inputs
Confirmation 1 and Solo Confirmation: GKD-V Volatility / Volume indicator
Confirmation 2: GKD-C Confirmation indicator
Outputs
Confirmation 2 and Solo Confirmation Complex: GKD-E Exit indicator
Confirmation 1: GKD-C Confirmation indicator
Continuation: GKD-E Exit indicator
Solo Confirmation Simple: GKD-BT Backtest strategy
Additional features will be added in future releases.

GKD-C Super 6x [Loxx]Giga Kaleidoscope GKD-C Super 6x: RSI, MACD, Stochastic, Loxxer, CCI, & Velocity is a Confirmation module included in Loxx's "Giga Kaleidoscope Modularized Trading System".
█ Giga Kaleidoscope Modularized Trading System
What is Loxx's "Giga Kaleidoscope Modularized Trading System"?
The Giga Kaleidoscope Modularized Trading System is a trading system built on the philosophy of the NNFX (No Nonsense Forex) algorithmic trading.
What is the NNFX algorithmic trading strategy?
The NNFX (No-Nonsense Forex) trading system is a comprehensive approach to Forex trading that is designed to simplify the process and remove the confusion and complexity that often surrounds trading. The system was developed by a Forex trader who goes by the pseudonym "VP" and has gained a significant following in the Forex community.
The NNFX trading system is based on a set of rules and guidelines that help traders make objective and informed decisions. These rules cover all aspects of trading, including market analysis, trade entry, stop loss placement, and trade management.
Here are the main components of the NNFX trading system:
1. Trading Philosophy: The NNFX trading system is based on the idea that successful trading requires a comprehensive understanding of the market, objective analysis, and strict risk management. The system aims to remove subjective elements from trading and focuses on objective rules and guidelines.
2. Technical Analysis: The NNFX trading system relies heavily on technical analysis and uses a range of indicators to identify high-probability trading opportunities. The system uses a combination of trend-following and mean-reverting strategies to identify trades.
3. Market Structure: The NNFX trading system emphasizes the importance of understanding the market structure, including price action, support and resistance levels, and market cycles. The system uses a range of tools to identify the market structure, including trend lines, channels, and moving averages.
4. Trade Entry: The NNFX trading system has strict rules for trade entry. The system uses a combination of technical indicators to identify high-probability trades, and traders must meet specific criteria to enter a trade.
5. Stop Loss Placement: The NNFX trading system places a significant emphasis on risk management and requires traders to place a stop loss order on every trade. The system uses a combination of technical analysis and market structure to determine the appropriate stop loss level.
6. Trade Management: The NNFX trading system has specific rules for managing open trades. The system aims to minimize risk and maximize profit by using a combination of trailing stops, take profit levels, and position sizing.
Overall, the NNFX trading system is designed to be a straightforward and easy-to-follow approach to Forex trading that can be applied by traders of all skill levels.
Core components of an NNFX algorithmic trading strategy
The NNFX algorithm is built on the principles of trend, momentum, and volatility. There are six core components in the NNFX trading algorithm:
1. Volatility - price volatility; e.g., Average True Range, True Range Double, Close-to-Close, etc.
2. Baseline - a moving average to identify price trend
3. Confirmation 1 - a technical indicator used to identify trends
4. Confirmation 2 - a technical indicator used to identify trends
5. Continuation - a technical indicator used to identify trends
6. Volatility/Volume - a technical indicator used to identify volatility/volume breakouts/breakdown
7. Exit - a technical indicator used to determine when a trend is exhausted
What is Volatility in the NNFX trading system?
In the NNFX (No Nonsense Forex) trading system, ATR (Average True Range) is typically used to measure the volatility of an asset. It is used as a part of the system to help determine the appropriate stop loss and take profit levels for a trade. ATR is calculated by taking the average of the true range values over a specified period.
True range is calculated as the maximum of the following values:
-Current high minus the current low
-Absolute value of the current high minus the previous close
-Absolute value of the current low minus the previous close
ATR is a dynamic indicator that changes with changes in volatility. As volatility increases, the value of ATR increases, and as volatility decreases, the value of ATR decreases. By using ATR in NNFX system, traders can adjust their stop loss and take profit levels according to the volatility of the asset being traded. This helps to ensure that the trade is given enough room to move, while also minimizing potential losses.
Other types of volatility include True Range Double (TRD), Close-to-Close, and Garman-Klass
What is a Baseline indicator?
The baseline is essentially a moving average, and is used to determine the overall direction of the market.
The baseline in the NNFX system is used to filter out trades that are not in line with the long-term trend of the market. The baseline is plotted on the chart along with other indicators, such as the Moving Average (MA), the Relative Strength Index (RSI), and the Average True Range (ATR).
Trades are only taken when the price is in the same direction as the baseline. For example, if the baseline is sloping upwards, only long trades are taken, and if the baseline is sloping downwards, only short trades are taken. This approach helps to ensure that trades are in line with the overall trend of the market, and reduces the risk of entering trades that are likely to fail.
By using a baseline in the NNFX system, traders can have a clear reference point for determining the overall trend of the market, and can make more informed trading decisions. The baseline helps to filter out noise and false signals, and ensures that trades are taken in the direction of the long-term trend.
What is a Confirmation indicator?
Confirmation indicators are technical indicators that are used to confirm the signals generated by primary indicators. Primary indicators are the core indicators used in the NNFX system, such as the Average True Range (ATR), the Moving Average (MA), and the Relative Strength Index (RSI).
The purpose of the confirmation indicators is to reduce false signals and improve the accuracy of the trading system. They are designed to confirm the signals generated by the primary indicators by providing additional information about the strength and direction of the trend.
Some examples of confirmation indicators that may be used in the NNFX system include the Bollinger Bands, the MACD (Moving Average Convergence Divergence), and the MACD Oscillator. These indicators can provide information about the volatility, momentum, and trend strength of the market, and can be used to confirm the signals generated by the primary indicators.
In the NNFX system, confirmation indicators are used in combination with primary indicators and other filters to create a trading system that is robust and reliable. By using multiple indicators to confirm trading signals, the system aims to reduce the risk of false signals and improve the overall profitability of the trades.
What is a Continuation indicator?
In the NNFX (No Nonsense Forex) trading system, a continuation indicator is a technical indicator that is used to confirm a current trend and predict that the trend is likely to continue in the same direction. A continuation indicator is typically used in conjunction with other indicators in the system, such as a baseline indicator, to provide a comprehensive trading strategy.
What is a Volatility/Volume indicator?
Volume indicators, such as the On Balance Volume (OBV), the Chaikin Money Flow (CMF), or the Volume Price Trend (VPT), are used to measure the amount of buying and selling activity in a market. They are based on the trading volume of the market, and can provide information about the strength of the trend. In the NNFX system, volume indicators are used to confirm trading signals generated by the Moving Average and the Relative Strength Index. Volatility indicators include Average Direction Index, Waddah Attar, and Volatility Ratio. In the NNFX trading system, volatility is a proxy for volume and vice versa.
By using volume indicators as confirmation tools, the NNFX trading system aims to reduce the risk of false signals and improve the overall profitability of trades. These indicators can provide additional information about the market that is not captured by the primary indicators, and can help traders to make more informed trading decisions. In addition, volume indicators can be used to identify potential changes in market trends and to confirm the strength of price movements.
What is an Exit indicator?
The exit indicator is used in conjunction with other indicators in the system, such as the Moving Average (MA), the Relative Strength Index (RSI), and the Average True Range (ATR), to provide a comprehensive trading strategy.
The exit indicator in the NNFX system can be any technical indicator that is deemed effective at identifying optimal exit points. Examples of exit indicators that are commonly used include the Parabolic SAR, the Average Directional Index (ADX), and the Chandelier Exit.
The purpose of the exit indicator is to identify when a trend is likely to reverse or when the market conditions have changed, signaling the need to exit a trade. By using an exit indicator, traders can manage their risk and prevent significant losses.
In the NNFX system, the exit indicator is used in conjunction with a stop loss and a take profit order to maximize profits and minimize losses. The stop loss order is used to limit the amount of loss that can be incurred if the trade goes against the trader, while the take profit order is used to lock in profits when the trade is moving in the trader's favor.
Overall, the use of an exit indicator in the NNFX trading system is an important component of a comprehensive trading strategy. It allows traders to manage their risk effectively and improve the profitability of their trades by exiting at the right time.
How does Loxx's GKD (Giga Kaleidoscope Modularized Trading System) implement the NNFX algorithm outlined above?
Loxx's GKD v1.0 system has five types of modules (indicators/strategies). These modules are:
1. GKD-BT - Backtesting module (Volatility, Number 1 in the NNFX algorithm)
2. GKD-B - Baseline module (Baseline and Volatility/Volume, Numbers 1 and 2 in the NNFX algorithm)
3. GKD-C - Confirmation 1/2 and Continuation module (Confirmation 1/2 and Continuation, Numbers 3, 4, and 5 in the NNFX algorithm)
4. GKD-V - Volatility/Volume module (Confirmation 1/2, Number 6 in the NNFX algorithm)
5. GKD-E - Exit module (Exit, Number 7 in the NNFX algorithm)
(additional module types will added in future releases)
Each module interacts with every module by passing data between modules. Data is passed between each module as described below:
GKD-B => GKD-V => GKD-C(1) => GKD-C(2) => GKD-C(Continuation) => GKD-E => GKD-BT
That is, the Baseline indicator passes its data to Volatility/Volume. The Volatility/Volume indicator passes its values to the Confirmation 1 indicator. The Confirmation 1 indicator passes its values to the Confirmation 2 indicator. The Confirmation 2 indicator passes its values to the Continuation indicator. The Continuation indicator passes its values to the Exit indicator, and finally, the Exit indicator passes its values to the Backtest strategy.
This chaining of indicators requires that each module conform to Loxx's GKD protocol, therefore allowing for the testing of every possible combination of technical indicators that make up the six components of the NNFX algorithm.
What does the application of the GKD trading system look like?
Example trading system:
Backtest: Strategy with 1-3 take profits, trailing stop loss, multiple types of PnL volatility, and 2 backtesting styles
Baseline: Hull Moving Average
Volatility/Volume: Hurst Exponent
Confirmation 1: Super 6x: RSI, MACD, Stochastic, Loxxer, CCI, & Velocity as shown on the chart above
Confirmation 2: Williams Percent Range
Continuation: Fisher Transform
Exit: Rex Oscillator
Each GKD indicator is denoted with a module identifier of either: GKD-BT, GKD-B, GKD-C, GKD-V, or GKD-E. This allows traders to understand to which module each indicator belongs and where each indicator fits into the GKD protocol chain.
Giga Kaleidoscope Modularized Trading System Signals (based on the NNFX algorithm)
Standard Entry
1. GKD-C Confirmation 1 Signal
2. GKD-B Baseline agrees
3. Price is within a range of 0.2x Volatility and 1.0x Volatility of the Goldie Locks Mean
4. GKD-C Confirmation 2 agrees
5. GKD-V Volatility/Volume agrees
Baseline Entry
1. GKD-B Baseline signal
2. GKD-C Confirmation 1 agrees
3. Price is within a range of 0.2x Volatility and 1.0x Volatility of the Goldie Locks Mean
4. GKD-C Confirmation 2 agrees
5. GKD-V Volatility/Volume agrees
6. GKD-C Confirmation 1 signal was less than 7 candles prior
Continuation Entry
1. Standard Entry, Baseline Entry, or Pullback; entry triggered previously
2. GKD-B Baseline hasn't crossed since entry signal trigger
3. GKD-C Confirmation Continuation Indicator signals
4. GKD-C Confirmation 1 agrees
5. GKD-B Baseline agrees
6. GKD-C Confirmation 2 agrees
1-Candle Rule Standard Entry
1. GKD-C Confirmation 1 signal
2. GKD-B Baseline agrees
3. Price is within a range of 0.2x Volatility and 1.0x Volatility of the Goldie Locks Mean
Next Candle:
1. Price retraced (Long: close < close or Short: close > close )
2. GKD-B Baseline agrees
3. GKD-C Confirmation 1 agrees
4. GKD-C Confirmation 2 agrees
5. GKD-V Volatility/Volume agrees
1-Candle Rule Baseline Entry
1. GKD-B Baseline signal
2. GKD-C Confirmation 1 agrees
3. Price is within a range of 0.2x Volatility and 1.0x Volatility of the Goldie Locks Mean
4. GKD-C Confirmation 1 signal was less than 7 candles prior
Next Candle:
1. Price retraced (Long: close < close or Short: close > close )
2. GKD-B Baseline agrees
3. GKD-C Confirmation 1 agrees
4. GKD-C Confirmation 2 agrees
5. GKD-V Volatility/Volume Agrees
PullBack Entry
1. GKD-B Baseline signal
2. GKD-C Confirmation 1 agrees
3. Price is beyond 1.0x Volatility of Baseline
Next Candle:
1. Price is within a range of 0.2x Volatility and 1.0x Volatility of the Goldie Locks Mean
3. GKD-C Confirmation 1 agrees
4. GKD-C Confirmation 2 agrees
5. GKD-V Volatility/Volume Agrees
█ GKD-C Super 6x: RSI, MACD, Stochastic, Loxxer, CCI, & Velocity
What is MACD?
MACD stands for Moving Average Convergence Divergence. It is a technical indicator used in financial analysis to track the trend and momentum of a security or market index. The MACD indicator consists of two lines, a faster-moving average called the MACD line, and a slower-moving average called the signal line.
The MACD line is calculated by subtracting the 26-period exponential moving average (EMA) from the 12-period EMA. The signal line is a 9-period EMA of the MACD line. The MACD line oscillates above and below the zero line, which represents the equilibrium point between the bullish and bearish forces.
Traders use the MACD indicator to identify changes in trend and momentum. When the MACD line crosses above the signal line, it is considered a bullish signal, indicating that the momentum is shifting towards the upside. Conversely, when the MACD line crosses below the signal line, it is considered a bearish signal, indicating that the momentum is shifting towards the downside.
The MACD indicator can also be used to identify divergences between the MACD line and the price action. A bullish divergence occurs when the price is making lower lows, but the MACD line is making higher lows. This could indicate that the downward momentum is weakening, and a potential trend reversal could be imminent. A bearish divergence occurs when the price is making higher highs, but the MACD line is making lower highs, indicating that the upward momentum is weakening, and a potential trend reversal could be imminent.
Overall, the MACD indicator is a versatile tool that can be used in conjunction with other technical indicators and chart patterns to make informed trading decisions.
What is CCI?
The Commodity Channel Index ( CCI ) is a technical analysis indicator that was developed by Donald Lambert in 1980. It's primarily used to identify overbought and oversold conditions in the market, as well as trend direction and potential price reversals.
The CCI is calculated by taking the difference between the typical price (the average of the high, low, and close prices) and a moving average of the typical price over a certain period of time. This difference is then divided by a factor based on the average deviation of the typical price from the moving average.
The formula for the CCI is:
CCI = (Typical Price - 20-period SMA of Typical Price) / (0.015 x Mean Deviation)
Where:
Typical Price = (High + Low + Close) / 3
SMA = Simple Moving Average
Mean Deviation = Average of the absolute value of the difference between the Typical Price and the SMA over the last 20 periods.
The CCI is usually displayed as a line chart that oscillates around a centerline of zero. Readings above zero indicate that the typical price is above the moving average, while readings below zero indicate that the typical price is below the moving average.
Traders typically use the CCI to identify overbought and oversold conditions in the market. When the CCI rises above a certain level (e.g., +100), it's considered overbought, indicating that the price may be due for a correction or reversal. When the CCI falls below a certain level (e.g., -100), it's considered oversold, indicating that the price may be due for a bounce or reversal.
The CCI can also be used to identify potential trend reversals. When the CCI crosses above or below the zero line, it can signal a potential change in trend. For example, if the CCI crosses above the zero line, it could indicate that a bullish trend is emerging, while a cross below the zero line could indicate that a bearish trend is emerging.
Overall, the Commodity Channel Index is a useful technical analysis tool for identifying overbought and oversold conditions, as well as potential trend reversals in the market. However, like all technical indicators, it should be used in conjunction with other forms of analysis and risk management techniques to make informed trading decisions.
What is RSI?
The RSI, or Relative Strength Index, is a popular technical analysis tool used to measure the strength of a security's price action and identify potential trend reversals. It was developed by J. Welles Wilder and is based on the concept that price action tends to follow a momentum pattern.
The RSI is calculated based on the average gain and loss of a security's price over a specified period, usually 14 periods. It oscillates between 0 and 100 and is represented as a single line on a chart.
The RSI is calculated as follows:
RS = Average Gain / Average Loss
RSI = 100 - (100 / (1 + RS))
Where the Average Gain is the sum of all gains divided by the number of periods, and the Average Loss is the sum of all losses divided by the number of periods.
The RSI is used to identify overbought and oversold conditions in a security or market index. When the RSI rises above 70, it is considered overbought, indicating that the security may be overvalued and due for a price correction. Conversely, when the RSI falls below 30, it is considered oversold, indicating that the security may be undervalued and due for a price rebound.
Traders can also use the RSI to identify potential trend reversals. When the RSI forms a divergent pattern with the price action, it could indicate that the security is losing momentum and may be reversing to the upside or downside.
Overall, the RSI is a useful tool for traders to identify potential buy and sell signals, as well as to confirm trends and reversals. However, it should not be used in isolation, and traders should consider using other technical indicators and fundamental analysis to make informed trading decisions.
What is Stochastic?
The stochastic oscillator is a momentum indicator used in technical analysis to measure the current closing price of a security or market index relative to its price range over a specified period. The indicator consists of two lines, the %K line and the %D line, which oscillate between 0 and 100.
The %K line is calculated as follows:
%K = 100 x (Closing Price - Lowest Low) / (Highest High - Lowest Low)
Where:
Closing Price is the most recent closing price of the security.
Lowest Low is the lowest low of the security over a specified period (usually 14 periods).
Highest High is the highest high of the security over the same specified period.
The %D line is a 3-period simple moving average of the %K line. The %D line is slower than the %K line and is used to smooth out the volatility of the %K line.
The stochastic oscillator is used to identify overbought and oversold conditions in a security or market index. When the %K line rises above 80, it is considered overbought, indicating that the security may be overvalued and due for a price correction. Conversely, when the %K line falls below 20, it is considered oversold, indicating that the security may be undervalued and due for a price rebound.
Traders can also use the stochastic oscillator to identify bullish and bearish divergences between the %K line and the price action. A bullish divergence occurs when the %K line is making higher lows while the price action is making lower lows, indicating that the momentum is shifting towards the upside. A bearish divergence occurs when the %K line is making lower highs while the price action is making higher highs, indicating that the momentum is shifting towards the downside.
Overall, the stochastic oscillator is a useful tool for traders to identify potential buy and sell signals, as well as to confirm trends and reversals. However, it should not be used in isolation, and traders should consider using other technical indicators and fundamental analysis to make informed trading decisions.
What is Loxxer?
The Loxxer Index is a technical indicator used in financial analysis to identify potential trend reversals and overbought/oversold conditions in a security or market index. It was developed by Loxx and is also known as the Loxx Indicator.
The Loxxer Index is calculated based on the high, low, and closing prices of a security over a specified period. It measures the demand for the security by comparing the current high and low prices with the previous high and low prices. The indicator oscillates between 0 and 1 and is represented as a single line on a chart.
The Loxxer Index is calculated as follows:
LoxxMax = Current High - Previous High
LoxxMin = Previous Low - Current Low
If LoxxMax is greater than LoxxMin, then the Loxxer Index is calculated as follows:
Loxxer = LoxxMax / (LoxxMax + Current Close - Previous Close)
If LoxxMax is less than or equal to LoxxMin, then the Loxxer Index is calculated as follows:
Loxxer = 0
The Loxxer Index is used to identify overbought and oversold conditions in a security or market index. When the Loxxer Index rises above 0.7, it is considered overbought, indicating that the security may be overvalued and due for a price correction. Conversely, when the Loxxer Index falls below 0.3, it is considered oversold, indicating that the security may be undervalued and due for a price rebound.
Traders can also use the Loxxer Index to identify potential trend reversals. When the Loxxer Index forms a higher low while the price action forms a lower low, it could indicate that the security is losing momentum and may be reversing to the upside. Conversely, when the Loxxer Index forms a lower high while the price action forms a higher high, it could indicate that the security is losing momentum and may be reversing to the downside.
Overall, the Loxxer Index is a useful tool for traders to identify potential buy and sell signals, as well as to confirm trends and reversals. However, it should not be used in isolation, and traders should consider using other technical indicators and fundamental analysis to make informed trading decisions.
What is Velocity?
The Velocity Indicator is a technical analysis tool used to measure the speed and momentum of price movements in a security or market index. It is a type of oscillator that is used to identify potential trend reversals and overbought/oversold conditions.
The Velocity Indicator is calculated based on the difference between the current price and the price from a specified number of periods ago. It measures the rate of change of the price movement over time and is represented as a single line on a chart.
The Velocity Indicator is calculated as follows:
Velocity = (Current Price - Price from N periods ago) / Price from N periods ago x 100
Where N is the number of periods used in the calculation.
The Velocity Indicator is used to identify overbought and oversold conditions in a security or market index. When the Velocity Indicator rises above 1, it is considered overbought, indicating that the security may be overvalued and due for a price correction. Conversely, when the Velocity Indicator falls below -1, it is considered oversold, indicating that the security may be undervalued and due for a price rebound.
Traders can also use the Velocity Indicator to identify potential trend reversals. When the Velocity Indicator crosses above its moving average, it could indicate that the security is gaining momentum and may be reversing to the upside. Conversely, when the Velocity Indicator crosses below its moving average, it could indicate that the security is losing momentum and may be reversing to the downside.
Overall, the Velocity Indicator is a useful tool for traders to identify potential buy and sell signals, as well as to confirm trends and reversals. However, it should not be used in isolation, and traders should consider using other technical indicators and fundamental analysis to make informed trading decisions.
What is Super 6x: RSI, MACD, Stochastic, Loxxer, CCI, & Velocity?
Super 6x combines all 6 indicators into one signal, long or short
Requirements
Inputs
Confirmation 1 and Solo Confirmation: GKD-V Volatility / Volume indicator
Confirmation 2: GKD-C Confirmation indicator
Outputs
Confirmation 2 and Solo Confirmation Complex: GKD-E Exit indicator
Confirmation 1: GKD-C Confirmation indicator
Continuation: GKD-E Exit indicator
Solo Confirmation Simple: GKD-BT Backtest strategy
Additional features will be added in future releases.

GKD-C Digital Kahler CCI [Loxx]Giga Kaleidoscope GKD-C Digital Kahler CCI is a Confirmation module included in Loxx's "Giga Kaleidoscope Modularized Trading System".
█ Giga Kaleidoscope Modularized Trading System
What is Loxx's "Giga Kaleidoscope Modularized Trading System"?
The Giga Kaleidoscope Modularized Trading System is a trading system built on the philosophy of the NNFX (No Nonsense Forex) algorithmic trading.
What is the NNFX algorithmic trading strategy?
The NNFX (No-Nonsense Forex) trading system is a comprehensive approach to Forex trading that is designed to simplify the process and remove the confusion and complexity that often surrounds trading. The system was developed by a Forex trader who goes by the pseudonym "VP" and has gained a significant following in the Forex community.
The NNFX trading system is based on a set of rules and guidelines that help traders make objective and informed decisions. These rules cover all aspects of trading, including market analysis, trade entry, stop loss placement, and trade management.
Here are the main components of the NNFX trading system:
1. Trading Philosophy: The NNFX trading system is based on the idea that successful trading requires a comprehensive understanding of the market, objective analysis, and strict risk management. The system aims to remove subjective elements from trading and focuses on objective rules and guidelines.
2. Technical Analysis: The NNFX trading system relies heavily on technical analysis and uses a range of indicators to identify high-probability trading opportunities. The system uses a combination of trend-following and mean-reverting strategies to identify trades.
3. Market Structure: The NNFX trading system emphasizes the importance of understanding the market structure, including price action, support and resistance levels, and market cycles. The system uses a range of tools to identify the market structure, including trend lines, channels, and moving averages.
4. Trade Entry: The NNFX trading system has strict rules for trade entry. The system uses a combination of technical indicators to identify high-probability trades, and traders must meet specific criteria to enter a trade.
5. Stop Loss Placement: The NNFX trading system places a significant emphasis on risk management and requires traders to place a stop loss order on every trade. The system uses a combination of technical analysis and market structure to determine the appropriate stop loss level.
6. Trade Management: The NNFX trading system has specific rules for managing open trades. The system aims to minimize risk and maximize profit by using a combination of trailing stops, take profit levels, and position sizing.
Overall, the NNFX trading system is designed to be a straightforward and easy-to-follow approach to Forex trading that can be applied by traders of all skill levels.
Core components of an NNFX algorithmic trading strategy
The NNFX algorithm is built on the principles of trend, momentum, and volatility. There are six core components in the NNFX trading algorithm:
1. Volatility - price volatility; e.g., Average True Range, True Range Double, Close-to-Close, etc.
2. Baseline - a moving average to identify price trend
3. Confirmation 1 - a technical indicator used to identify trends
4. Confirmation 2 - a technical indicator used to identify trends
5. Continuation - a technical indicator used to identify trends
6. Volatility/Volume - a technical indicator used to identify volatility/volume breakouts/breakdown
7. Exit - a technical indicator used to determine when a trend is exhausted
What is Volatility in the NNFX trading system?
In the NNFX (No Nonsense Forex) trading system, ATR (Average True Range) is typically used to measure the volatility of an asset. It is used as a part of the system to help determine the appropriate stop loss and take profit levels for a trade. ATR is calculated by taking the average of the true range values over a specified period.
True range is calculated as the maximum of the following values:
-Current high minus the current low
-Absolute value of the current high minus the previous close
-Absolute value of the current low minus the previous close
ATR is a dynamic indicator that changes with changes in volatility. As volatility increases, the value of ATR increases, and as volatility decreases, the value of ATR decreases. By using ATR in NNFX system, traders can adjust their stop loss and take profit levels according to the volatility of the asset being traded. This helps to ensure that the trade is given enough room to move, while also minimizing potential losses.
Other types of volatility include True Range Double (TRD), Close-to-Close, and Garman-Klass
What is a Baseline indicator?
The baseline is essentially a moving average, and is used to determine the overall direction of the market.
The baseline in the NNFX system is used to filter out trades that are not in line with the long-term trend of the market. The baseline is plotted on the chart along with other indicators, such as the Moving Average (MA), the Relative Strength Index (RSI), and the Average True Range (ATR).
Trades are only taken when the price is in the same direction as the baseline. For example, if the baseline is sloping upwards, only long trades are taken, and if the baseline is sloping downwards, only short trades are taken. This approach helps to ensure that trades are in line with the overall trend of the market, and reduces the risk of entering trades that are likely to fail.
By using a baseline in the NNFX system, traders can have a clear reference point for determining the overall trend of the market, and can make more informed trading decisions. The baseline helps to filter out noise and false signals, and ensures that trades are taken in the direction of the long-term trend.
What is a Confirmation indicator?
Confirmation indicators are technical indicators that are used to confirm the signals generated by primary indicators. Primary indicators are the core indicators used in the NNFX system, such as the Average True Range (ATR), the Moving Average (MA), and the Relative Strength Index (RSI).
The purpose of the confirmation indicators is to reduce false signals and improve the accuracy of the trading system. They are designed to confirm the signals generated by the primary indicators by providing additional information about the strength and direction of the trend.
Some examples of confirmation indicators that may be used in the NNFX system include the Bollinger Bands, the MACD (Moving Average Convergence Divergence), and the CCI Oscillator. These indicators can provide information about the volatility, momentum, and trend strength of the market, and can be used to confirm the signals generated by the primary indicators.
In the NNFX system, confirmation indicators are used in combination with primary indicators and other filters to create a trading system that is robust and reliable. By using multiple indicators to confirm trading signals, the system aims to reduce the risk of false signals and improve the overall profitability of the trades.
What is a Continuation indicator?
In the NNFX (No Nonsense Forex) trading system, a continuation indicator is a technical indicator that is used to confirm a current trend and predict that the trend is likely to continue in the same direction. A continuation indicator is typically used in conjunction with other indicators in the system, such as a baseline indicator, to provide a comprehensive trading strategy.
What is a Volatility/Volume indicator?
Volume indicators, such as the On Balance Volume (OBV), the Chaikin Money Flow (CMF), or the Volume Price Trend (VPT), are used to measure the amount of buying and selling activity in a market. They are based on the trading volume of the market, and can provide information about the strength of the trend. In the NNFX system, volume indicators are used to confirm trading signals generated by the Moving Average and the Relative Strength Index. Volatility indicators include Average Direction Index, Waddah Attar, and Volatility Ratio. In the NNFX trading system, volatility is a proxy for volume and vice versa.
By using volume indicators as confirmation tools, the NNFX trading system aims to reduce the risk of false signals and improve the overall profitability of trades. These indicators can provide additional information about the market that is not captured by the primary indicators, and can help traders to make more informed trading decisions. In addition, volume indicators can be used to identify potential changes in market trends and to confirm the strength of price movements.
What is an Exit indicator?
The exit indicator is used in conjunction with other indicators in the system, such as the Moving Average (MA), the Relative Strength Index (RSI), and the Average True Range (ATR), to provide a comprehensive trading strategy.
The exit indicator in the NNFX system can be any technical indicator that is deemed effective at identifying optimal exit points. Examples of exit indicators that are commonly used include the Parabolic SAR, the Average Directional Index (ADX), and the Chandelier Exit.
The purpose of the exit indicator is to identify when a trend is likely to reverse or when the market conditions have changed, signaling the need to exit a trade. By using an exit indicator, traders can manage their risk and prevent significant losses.
In the NNFX system, the exit indicator is used in conjunction with a stop loss and a take profit order to maximize profits and minimize losses. The stop loss order is used to limit the amount of loss that can be incurred if the trade goes against the trader, while the take profit order is used to lock in profits when the trade is moving in the trader's favor.
Overall, the use of an exit indicator in the NNFX trading system is an important component of a comprehensive trading strategy. It allows traders to manage their risk effectively and improve the profitability of their trades by exiting at the right time.
How does Loxx's GKD (Giga Kaleidoscope Modularized Trading System) implement the NNFX algorithm outlined above?
Loxx's GKD v1.0 system has five types of modules (indicators/strategies). These modules are:
1. GKD-BT - Backtesting module (Volatility, Number 1 in the NNFX algorithm)
2. GKD-B - Baseline module (Baseline and Volatility/Volume, Numbers 1 and 2 in the NNFX algorithm)
3. GKD-C - Confirmation 1/2 and Continuation module (Confirmation 1/2 and Continuation, Numbers 3, 4, and 5 in the NNFX algorithm)
4. GKD-V - Volatility/Volume module (Confirmation 1/2, Number 6 in the NNFX algorithm)
5. GKD-E - Exit module (Exit, Number 7 in the NNFX algorithm)
(additional module types will added in future releases)
Each module interacts with every module by passing data between modules. Data is passed between each module as described below:
GKD-B => GKD-V => GKD-C(1) => GKD-C(2) => GKD-C(Continuation) => GKD-E => GKD-BT
That is, the Baseline indicator passes its data to Volatility/Volume. The Volatility/Volume indicator passes its values to the Confirmation 1 indicator. The Confirmation 1 indicator passes its values to the Confirmation 2 indicator. The Confirmation 2 indicator passes its values to the Continuation indicator. The Continuation indicator passes its values to the Exit indicator, and finally, the Exit indicator passes its values to the Backtest strategy.
This chaining of indicators requires that each module conform to Loxx's GKD protocol, therefore allowing for the testing of every possible combination of technical indicators that make up the six components of the NNFX algorithm.
What does the application of the GKD trading system look like?
Example trading system:
Backtest: Strategy with 1-3 take profits, trailing stop loss, multiple types of PnL volatility, and 2 backtesting styles
Baseline: Hull Moving Average
Volatility/Volume: Hurst Exponent
Confirmation 1: Digital Kahler CCI as shown on the chart above
Confirmation 2: Williams Percent Range
Continuation: Fisher Transform
Exit: Rex Oscillator
Each GKD indicator is denoted with a module identifier of either: GKD-BT, GKD-B, GKD-C, GKD-V, or GKD-E. This allows traders to understand to which module each indicator belongs and where each indicator fits into the GKD protocol chain.
Giga Kaleidoscope Modularized Trading System Signals (based on the NNFX algorithm)
Standard Entry
1. GKD-C Confirmation 1 Signal
2. GKD-B Baseline agrees
3. Price is within a range of 0.2x Volatility and 1.0x Volatility of the Goldie Locks Mean
4. GKD-C Confirmation 2 agrees
5. GKD-V Volatility/Volume agrees
Baseline Entry
1. GKD-B Baseline signal
2. GKD-C Confirmation 1 agrees
3. Price is within a range of 0.2x Volatility and 1.0x Volatility of the Goldie Locks Mean
4. GKD-C Confirmation 2 agrees
5. GKD-V Volatility/Volume agrees
6. GKD-C Confirmation 1 signal was less than 7 candles prior
Continuation Entry
1. Standard Entry, Baseline Entry, or Pullback; entry triggered previously
2. GKD-B Baseline hasn't crossed since entry signal trigger
3. GKD-C Confirmation Continuation Indicator signals
4. GKD-C Confirmation 1 agrees
5. GKD-B Baseline agrees
6. GKD-C Confirmation 2 agrees
1-Candle Rule Standard Entry
1. GKD-C Confirmation 1 signal
2. GKD-B Baseline agrees
3. Price is within a range of 0.2x Volatility and 1.0x Volatility of the Goldie Locks Mean
Next Candle:
1. Price retraced (Long: close < close or Short: close > close )
2. GKD-B Baseline agrees
3. GKD-C Confirmation 1 agrees
4. GKD-C Confirmation 2 agrees
5. GKD-V Volatility/Volume agrees
1-Candle Rule Baseline Entry
1. GKD-B Baseline signal
2. GKD-C Confirmation 1 agrees
3. Price is within a range of 0.2x Volatility and 1.0x Volatility of the Goldie Locks Mean
4. GKD-C Confirmation 1 signal was less than 7 candles prior
Next Candle:
1. Price retraced (Long: close < close or Short: close > close )
2. GKD-B Baseline agrees
3. GKD-C Confirmation 1 agrees
4. GKD-C Confirmation 2 agrees
5. GKD-V Volatility/Volume Agrees
PullBack Entry
1. GKD-B Baseline signal
2. GKD-C Confirmation 1 agrees
3. Price is beyond 1.0x Volatility of Baseline
Next Candle:
1. Price is within a range of 0.2x Volatility and 1.0x Volatility of the Goldie Locks Mean
3. GKD-C Confirmation 1 agrees
4. GKD-C Confirmation 2 agrees
5. GKD-V Volatility/Volume Agrees
█ GKD-C Digital Kahler CCI
What is Digital Kahler?
From Philipp Kahler's article for www.traders-mag.com, August 2008. "A Classic Indicator in a New Suit: Digital Stochastic"
Digital Indicators
Whenever you study the development of trading systems in particular, you will be struck in an extremely unpleasant way by the seemingly unmotivated indentations and changes in direction of each indicator. An experienced trader can recognize many false signals of the indicator on the basis of his solid background; a stupid trading system usually falls into any trap offered by the unclear indicator course. This is what motivated me to improve even further this and other indicators with the help of a relatively simple procedure. The goal of this development is to be able to use this indicator in a trading system with as few additional conditions as possible. Discretionary traders will likewise be happy about this clear course, which is not nerve-racking and makes concentrating on the essential elements of trading possible.
How Is It Done?
The digital Stochastic is a child of the original indicator. We owe a debt of gratitude to George Lane for his idea to design an indicator which describes the position of the current price within the high-low range of the historical price movement. My contribution to this indicator is the changed pattern which improves the quality of the signal without generating too long delays in giving signals. The trick used to generate this “digital” behavior of the indicator. It can be used with most oscillators like RSI or CCI.
First of all, the original is looked at. The indicator always moves between 0 and 100. The precise position of the indicator or its course relative to the trigger line are of no interest to me, I would just like to know whether the indicator is quoted below or above the value 50. This is tantamount to the question of whether the market is just trading above or below the middle of the high-low range of the past few days. If the market trades in the upper half of its high-low range, then the digital Stochastic is given the value 1; if the original Stochastic is below 50, then the value –1 is given. This leads to a sequence of 1/-1 values – the digital core of the new indicator. These values are subsequently smoothed by means of a short exponential moving average . This way minor false signals are eliminated and the indicator is given its typical form.
Calculation
The calculation is simple
Step1: create the CCI
Step 2: Use CCI as Fast MA and smoothed CCI as Slow MA
Step 3: Multiple the Slow and Fast MAs by their respective input ratios, and then divide by their sum. if the result is greater than 0, then the result is 1, if it's less than 0 then the result is -1, then chart the data
if ((slowr * slow_k + fastr * fast_k) / (fastr + slowr) > 50.0)
temp := 1
if ((slowr * slow_k + fastr * fast_k) / (fastr + slowr) < 50.0)
temp := -1
Step 4: Profit
Requirements
Inputs
Confirmation 1 and Solo Confirmation: GKD-V Volatility / Volume indicator
Confirmation 2: GKD-C Confirmation indicator
Outputs
Confirmation 2 and Solo Confirmation Complex: GKD-E Exit indicator
Confirmation 1: GKD-C Confirmation indicator
Continuation: GKD-E Exit indicator
Solo Confirmation Simple: GKD-BT Backtest strategy
Additional features will be added in future releases.
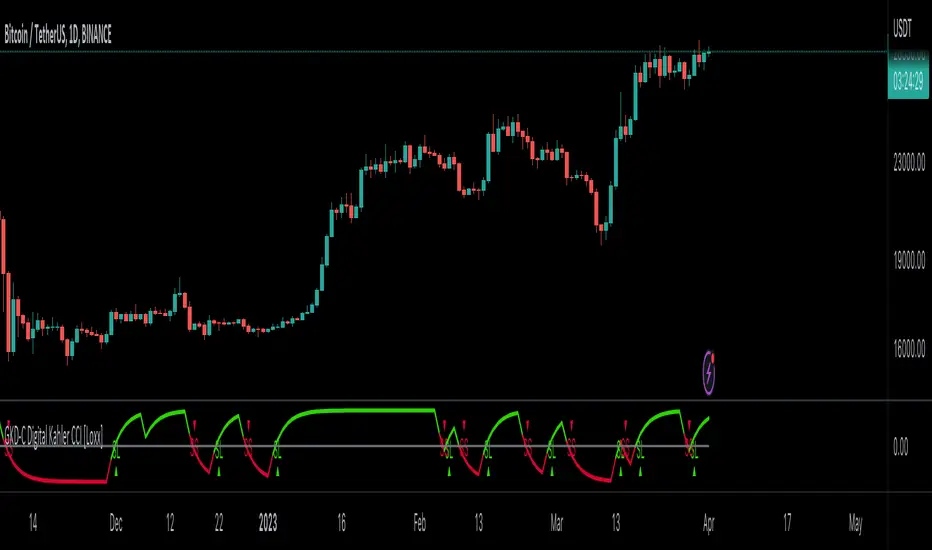
GKD-C VHF-Adaptive CCI [Loxx]Giga Kaleidoscope GKD-C VHF-Adaptive CCI is a Confirmation module included in Loxx's "Giga Kaleidoscope Modularized Trading System".
█ Giga Kaleidoscope Modularized Trading System
What is Loxx's "Giga Kaleidoscope Modularized Trading System"?
The Giga Kaleidoscope Modularized Trading System is a trading system built on the philosophy of the NNFX (No Nonsense Forex) algorithmic trading.
What is the NNFX algorithmic trading strategy?
The NNFX (No-Nonsense Forex) trading system is a comprehensive approach to Forex trading that is designed to simplify the process and remove the confusion and complexity that often surrounds trading. The system was developed by a Forex trader who goes by the pseudonym "VP" and has gained a significant following in the Forex community.
The NNFX trading system is based on a set of rules and guidelines that help traders make objective and informed decisions. These rules cover all aspects of trading, including market analysis, trade entry, stop loss placement, and trade management.
Here are the main components of the NNFX trading system:
1. Trading Philosophy: The NNFX trading system is based on the idea that successful trading requires a comprehensive understanding of the market, objective analysis, and strict risk management. The system aims to remove subjective elements from trading and focuses on objective rules and guidelines.
2. Technical Analysis: The NNFX trading system relies heavily on technical analysis and uses a range of indicators to identify high-probability trading opportunities. The system uses a combination of trend-following and mean-reverting strategies to identify trades.
3. Market Structure: The NNFX trading system emphasizes the importance of understanding the market structure, including price action, support and resistance levels, and market cycles. The system uses a range of tools to identify the market structure, including trend lines, channels, and moving averages.
4. Trade Entry: The NNFX trading system has strict rules for trade entry. The system uses a combination of technical indicators to identify high-probability trades, and traders must meet specific criteria to enter a trade.
5. Stop Loss Placement: The NNFX trading system places a significant emphasis on risk management and requires traders to place a stop loss order on every trade. The system uses a combination of technical analysis and market structure to determine the appropriate stop loss level.
6. Trade Management: The NNFX trading system has specific rules for managing open trades. The system aims to minimize risk and maximize profit by using a combination of trailing stops, take profit levels, and position sizing.
Overall, the NNFX trading system is designed to be a straightforward and easy-to-follow approach to Forex trading that can be applied by traders of all skill levels.
Core components of an NNFX algorithmic trading strategy
The NNFX algorithm is built on the principles of trend, momentum, and volatility. There are six core components in the NNFX trading algorithm:
1. Volatility - price volatility; e.g., Average True Range, True Range Double, Close-to-Close, etc.
2. Baseline - a moving average to identify price trend
3. Confirmation 1 - a technical indicator used to identify trends
4. Confirmation 2 - a technical indicator used to identify trends
5. Continuation - a technical indicator used to identify trends
6. Volatility/Volume - a technical indicator used to identify volatility/volume breakouts/breakdown
7. Exit - a technical indicator used to determine when a trend is exhausted
What is Volatility in the NNFX trading system?
In the NNFX (No Nonsense Forex) trading system, ATR (Average True Range) is typically used to measure the volatility of an asset. It is used as a part of the system to help determine the appropriate stop loss and take profit levels for a trade. ATR is calculated by taking the average of the true range values over a specified period.
True range is calculated as the maximum of the following values:
-Current high minus the current low
-Absolute value of the current high minus the previous close
-Absolute value of the current low minus the previous close
ATR is a dynamic indicator that changes with changes in volatility. As volatility increases, the value of ATR increases, and as volatility decreases, the value of ATR decreases. By using ATR in NNFX system, traders can adjust their stop loss and take profit levels according to the volatility of the asset being traded. This helps to ensure that the trade is given enough room to move, while also minimizing potential losses.
Other types of volatility include True Range Double (TRD), Close-to-Close, and Garman-Klass
What is a Baseline indicator?
The baseline is essentially a moving average, and is used to determine the overall direction of the market.
The baseline in the NNFX system is used to filter out trades that are not in line with the long-term trend of the market. The baseline is plotted on the chart along with other indicators, such as the Moving Average (MA), the Relative Strength Index (RSI), and the Average True Range (ATR).
Trades are only taken when the price is in the same direction as the baseline. For example, if the baseline is sloping upwards, only long trades are taken, and if the baseline is sloping downwards, only short trades are taken. This approach helps to ensure that trades are in line with the overall trend of the market, and reduces the risk of entering trades that are likely to fail.
By using a baseline in the NNFX system, traders can have a clear reference point for determining the overall trend of the market, and can make more informed trading decisions. The baseline helps to filter out noise and false signals, and ensures that trades are taken in the direction of the long-term trend.
What is a Confirmation indicator?
Confirmation indicators are technical indicators that are used to confirm the signals generated by primary indicators. Primary indicators are the core indicators used in the NNFX system, such as the Average True Range (ATR), the Moving Average (MA), and the Relative Strength Index (RSI).
The purpose of the confirmation indicators is to reduce false signals and improve the accuracy of the trading system. They are designed to confirm the signals generated by the primary indicators by providing additional information about the strength and direction of the trend.
Some examples of confirmation indicators that may be used in the NNFX system include the Bollinger Bands, the MACD (Moving Average Convergence Divergence), and the Stochastic Oscillator. These indicators can provide information about the volatility, momentum, and trend strength of the market, and can be used to confirm the signals generated by the primary indicators.
In the NNFX system, confirmation indicators are used in combination with primary indicators and other filters to create a trading system that is robust and reliable. By using multiple indicators to confirm trading signals, the system aims to reduce the risk of false signals and improve the overall profitability of the trades.
What is a Continuation indicator?
In the NNFX (No Nonsense Forex) trading system, a continuation indicator is a technical indicator that is used to confirm a current trend and predict that the trend is likely to continue in the same direction. A continuation indicator is typically used in conjunction with other indicators in the system, such as a baseline indicator, to provide a comprehensive trading strategy.
What is a Volatility/Volume indicator?
Volume indicators, such as the On Balance Volume (OBV), the Chaikin Money Flow (CMF), or the Volume Price Trend (VPT), are used to measure the amount of buying and selling activity in a market. They are based on the trading volume of the market, and can provide information about the strength of the trend. In the NNFX system, volume indicators are used to confirm trading signals generated by the Moving Average and the Relative Strength Index. Volatility indicators include Average Direction Index, Waddah Attar, and Volatility Ratio. In the NNFX trading system, volatility is a proxy for volume and vice versa.
By using volume indicators as confirmation tools, the NNFX trading system aims to reduce the risk of false signals and improve the overall profitability of trades. These indicators can provide additional information about the market that is not captured by the primary indicators, and can help traders to make more informed trading decisions. In addition, volume indicators can be used to identify potential changes in market trends and to confirm the strength of price movements.
What is an Exit indicator?
The exit indicator is used in conjunction with other indicators in the system, such as the Moving Average (MA), the Relative Strength Index (RSI), and the Average True Range (ATR), to provide a comprehensive trading strategy.
The exit indicator in the NNFX system can be any technical indicator that is deemed effective at identifying optimal exit points. Examples of exit indicators that are commonly used include the Parabolic SAR, the Average Directional Index (ADX), and the Chandelier Exit.
The purpose of the exit indicator is to identify when a trend is likely to reverse or when the market conditions have changed, signaling the need to exit a trade. By using an exit indicator, traders can manage their risk and prevent significant losses.
In the NNFX system, the exit indicator is used in conjunction with a stop loss and a take profit order to maximize profits and minimize losses. The stop loss order is used to limit the amount of loss that can be incurred if the trade goes against the trader, while the take profit order is used to lock in profits when the trade is moving in the trader's favor.
Overall, the use of an exit indicator in the NNFX trading system is an important component of a comprehensive trading strategy. It allows traders to manage their risk effectively and improve the profitability of their trades by exiting at the right time.
How does Loxx's GKD (Giga Kaleidoscope Modularized Trading System) implement the NNFX algorithm outlined above?
Loxx's GKD v1.0 system has five types of modules (indicators/strategies). These modules are:
1. GKD-BT - Backtesting module (Volatility, Number 1 in the NNFX algorithm)
2. GKD-B - Baseline module (Baseline and Volatility/Volume, Numbers 1 and 2 in the NNFX algorithm)
3. GKD-C - Confirmation 1/2 and Continuation module (Confirmation 1/2 and Continuation, Numbers 3, 4, and 5 in the NNFX algorithm)
4. GKD-V - Volatility/Volume module (Confirmation 1/2, Number 6 in the NNFX algorithm)
5. GKD-E - Exit module (Exit, Number 7 in the NNFX algorithm)
(additional module types will added in future releases)
Each module interacts with every module by passing data between modules. Data is passed between each module as described below:
GKD-B => GKD-V => GKD-C(1) => GKD-C(2) => GKD-C(Continuation) => GKD-E => GKD-BT
That is, the Baseline indicator passes its data to Volatility/Volume. The Volatility/Volume indicator passes its values to the Confirmation 1 indicator. The Confirmation 1 indicator passes its values to the Confirmation 2 indicator. The Confirmation 2 indicator passes its values to the Continuation indicator. The Continuation indicator passes its values to the Exit indicator, and finally, the Exit indicator passes its values to the Backtest strategy.
This chaining of indicators requires that each module conform to Loxx's GKD protocol, therefore allowing for the testing of every possible combination of technical indicators that make up the six components of the NNFX algorithm.
What does the application of the GKD trading system look like?
Example trading system:
Backtest: Strategy with 1-3 take profits, trailing stop loss, multiple types of PnL volatility, and 2 backtesting styles
Baseline: Hull Moving Average
Volatility/Volume: Hurst Exponent
Confirmation 1: VHF-Adaptive CCI as shown on the chart above
Confirmation 2: Williams Percent Range
Continuation: Fisher Transform
Exit: Rex Oscillator
Each GKD indicator is denoted with a module identifier of either: GKD-BT, GKD-B, GKD-C, GKD-V, or GKD-E. This allows traders to understand to which module each indicator belongs and where each indicator fits into the GKD protocol chain.
Giga Kaleidoscope Modularized Trading System Signals (based on the NNFX algorithm)
Standard Entry
1. GKD-C Confirmation 1 Signal
2. GKD-B Baseline agrees
3. Price is within a range of 0.2x Volatility and 1.0x Volatility of the Goldie Locks Mean
4. GKD-C Confirmation 2 agrees
5. GKD-V Volatility/Volume agrees
Baseline Entry
1. GKD-B Baseline signal
2. GKD-C Confirmation 1 agrees
3. Price is within a range of 0.2x Volatility and 1.0x Volatility of the Goldie Locks Mean
4. GKD-C Confirmation 2 agrees
5. GKD-V Volatility/Volume agrees
6. GKD-C Confirmation 1 signal was less than 7 candles prior
Continuation Entry
1. Standard Entry, Baseline Entry, or Pullback; entry triggered previously
2. GKD-B Baseline hasn't crossed since entry signal trigger
3. GKD-C Confirmation Continuation Indicator signals
4. GKD-C Confirmation 1 agrees
5. GKD-B Baseline agrees
6. GKD-C Confirmation 2 agrees
1-Candle Rule Standard Entry
1. GKD-C Confirmation 1 signal
2. GKD-B Baseline agrees
3. Price is within a range of 0.2x Volatility and 1.0x Volatility of the Goldie Locks Mean
Next Candle:
1. Price retraced (Long: close < close or Short: close > close )
2. GKD-B Baseline agrees
3. GKD-C Confirmation 1 agrees
4. GKD-C Confirmation 2 agrees
5. GKD-V Volatility/Volume agrees
1-Candle Rule Baseline Entry
1. GKD-B Baseline signal
2. GKD-C Confirmation 1 agrees
3. Price is within a range of 0.2x Volatility and 1.0x Volatility of the Goldie Locks Mean
4. GKD-C Confirmation 1 signal was less than 7 candles prior
Next Candle:
1. Price retraced (Long: close < close or Short: close > close )
2. GKD-B Baseline agrees
3. GKD-C Confirmation 1 agrees
4. GKD-C Confirmation 2 agrees
5. GKD-V Volatility/Volume Agrees
PullBack Entry
1. GKD-B Baseline signal
2. GKD-C Confirmation 1 agrees
3. Price is beyond 1.0x Volatility of Baseline
Next Candle:
1. Price is within a range of 0.2x Volatility and 1.0x Volatility of the Goldie Locks Mean
3. GKD-C Confirmation 1 agrees
4. GKD-C Confirmation 2 agrees
5. GKD-V Volatility/Volume Agrees
█ GKD-C VHF-Adaptive CCI
What is CCI?
CCI (Commodity Channel Index) is a popular technical analysis tool used by traders to identify potential trend reversals, overbought and oversold conditions, and trading opportunities in various financial markets such as stocks, commodities, currencies, and bonds.
The CCI indicator is a momentum oscillator that measures the difference between the current price of an asset and its historical average price over a given period of time. The CCI calculation involves subtracting the typical price of an asset from its simple moving average (SMA), and then dividing the result by a multiple of the mean absolute deviation (MAD) of the typical price.
The formula for CCI can be written as:
CCI = (Typical Price - SMA) / (0.015 x MAD)
Where:
Typical Price = (High + Low + Close) / 3
SMA = Simple Moving Average of Typical Price over a specified period (usually 20)
MAD = Mean Absolute Deviation of Typical Price over the same period
The CCI values range between -100 and +100. When the CCI value is above +100, it indicates that the asset is overbought, and there is a possibility of a trend reversal or price correction. Conversely, when the CCI value is below -100, it indicates that the asset is oversold, and there is a potential for a trend reversal or price increase.
Traders use CCI in various ways, such as identifying divergences between price and CCI, looking for bullish or bearish crossovers of the CCI line, and using the CCI in conjunction with other technical indicators to confirm trading signals.
Overall, CCI is a useful tool for traders and investors to analyze market trends, identify potential reversals, and make informed trading decisions. However, it is important to remember that no single indicator can predict the future market movements with certainty, and traders should always consider other factors such as fundamental analysis, news events, and risk management strategies when making trading decisions.
What is a Vertical Horizontal Filter?
The Vertical Horizontal Filter (VHF) is a technical indicator used in trading to identify whether a market is trending or in a sideways trading range. It was developed by Adam White, and is based on the concept that markets tend to exhibit more volatility when they are trending, and less volatility when they are in a sideways range.
The VHF is calculated by taking the ratio of the range of the high and low prices over a specified period to the total range of prices over the same period. The resulting ratio is then multiplied by 100 to create a percentage value.
If the VHF is above a certain threshold, typically 60, it is considered to be indicating a trending market. If it is below the threshold, it is indicating a sideways trading range.
Traders use the VHF to help identify market conditions and to adjust their trading strategies accordingly. In a trending market, traders may look for opportunities to enter or exit positions based on the direction of the trend, while in a sideways trading range, traders may look for opportunities to buy at the bottom of the range and sell at the top.
The VHF can also be used in conjunction with other technical indicators, such as moving averages or momentum indicators, to help confirm trading signals. For example, if the VHF is indicating a trending market and the moving average is also indicating a trend, this may provide a stronger signal to enter or exit a trade.
One potential limitation of the VHF is that it can be less effective in markets that are transitioning between trending and sideways trading ranges. During these periods, the VHF may not accurately reflect the current market conditions, and traders may need to use other indicators or methods to help identify the current trend.
In summary, the Vertical Horizontal Filter (VHF) is a technical indicator used in trading to identify whether a market is trending or in a sideways trading range. It is based on the concept that markets exhibit more volatility when they are trending, and less volatility when they are in a sideways range. Traders use the VHF to help identify market conditions and adjust their trading strategies accordingly.
What is VHF-Adaptive CCI?
This indicator adapts to a VHF filter output. This is done by calculating a period output from the VHF filter. This value is then used to calculate CCI. This adaptivity allows CCI to adjust to price movement more accurately thereby reducing noise and improving signal quality.
Requirements
Inputs
Confirmation 1 and Solo Confirmation: GKD-V Volatility / Volume indicator
Confirmation 2: GKD-C Confirmation indicator
Outputs
Confirmation 2 and Solo Confirmation Complex: GKD-E Exit indicator
Confirmation 1: GKD-C Confirmation indicator
Continuation: GKD-E Exit indicator
Solo Confirmation Simple: GKD-BT Backtest strategy
Additional features will be added in future releases.
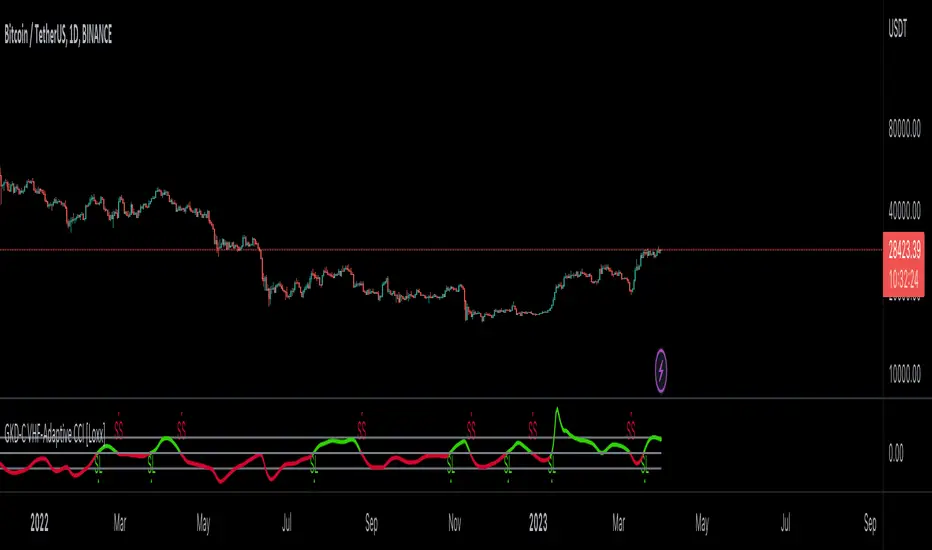
GKD-C T3-based CCI [Loxx]Giga Kaleidoscope GKD-C T3-based CCI is a Confirmation module included in Loxx's "Giga Kaleidoscope Modularized Trading System".
█ Giga Kaleidoscope Modularized Trading System
What is Loxx's "Giga Kaleidoscope Modularized Trading System"?
The Giga Kaleidoscope Modularized Trading System is a trading system built on the philosophy of the NNFX (No Nonsense Forex) algorithmic trading.
What is the NNFX algorithmic trading strategy?
The NNFX (No-Nonsense Forex) trading system is a comprehensive approach to Forex trading that is designed to simplify the process and remove the confusion and complexity that often surrounds trading. The system was developed by a Forex trader who goes by the pseudonym "VP" and has gained a significant following in the Forex community.
The NNFX trading system is based on a set of rules and guidelines that help traders make objective and informed decisions. These rules cover all aspects of trading, including market analysis, trade entry, stop loss placement, and trade management.
Here are the main components of the NNFX trading system:
1. Trading Philosophy: The NNFX trading system is based on the idea that successful trading requires a comprehensive understanding of the market, objective analysis, and strict risk management. The system aims to remove subjective elements from trading and focuses on objective rules and guidelines.
2. Technical Analysis: The NNFX trading system relies heavily on technical analysis and uses a range of indicators to identify high-probability trading opportunities. The system uses a combination of trend-following and mean-reverting strategies to identify trades.
3. Market Structure: The NNFX trading system emphasizes the importance of understanding the market structure, including price action, support and resistance levels, and market cycles. The system uses a range of tools to identify the market structure, including trend lines, channels, and moving averages.
4. Trade Entry: The NNFX trading system has strict rules for trade entry. The system uses a combination of technical indicators to identify high-probability trades, and traders must meet specific criteria to enter a trade.
5. Stop Loss Placement: The NNFX trading system places a significant emphasis on risk management and requires traders to place a stop loss order on every trade. The system uses a combination of technical analysis and market structure to determine the appropriate stop loss level.
6. Trade Management: The NNFX trading system has specific rules for managing open trades. The system aims to minimize risk and maximize profit by using a combination of trailing stops, take profit levels, and position sizing.
Overall, the NNFX trading system is designed to be a straightforward and easy-to-follow approach to Forex trading that can be applied by traders of all skill levels.
Core components of an NNFX algorithmic trading strategy
The NNFX algorithm is built on the principles of trend, momentum, and volatility. There are six core components in the NNFX trading algorithm:
1. Volatility - price volatility; e.g., Average True Range, True Range Double, Close-to-Close, etc.
2. Baseline - a moving average to identify price trend
3. Confirmation 1 - a technical indicator used to identify trends
4. Confirmation 2 - a technical indicator used to identify trends
5. Continuation - a technical indicator used to identify trends
6. Volatility/Volume - a technical indicator used to identify volatility/volume breakouts/breakdown
7. Exit - a technical indicator used to determine when a trend is exhausted
What is Volatility in the NNFX trading system?
In the NNFX (No Nonsense Forex) trading system, ATR (Average True Range) is typically used to measure the volatility of an asset. It is used as a part of the system to help determine the appropriate stop loss and take profit levels for a trade. ATR is calculated by taking the average of the true range values over a specified period.
True range is calculated as the maximum of the following values:
-Current high minus the current low
-Absolute value of the current high minus the previous close
-Absolute value of the current low minus the previous close
ATR is a dynamic indicator that changes with changes in volatility. As volatility increases, the value of ATR increases, and as volatility decreases, the value of ATR decreases. By using ATR in NNFX system, traders can adjust their stop loss and take profit levels according to the volatility of the asset being traded. This helps to ensure that the trade is given enough room to move, while also minimizing potential losses.
Other types of volatility include True Range Double (TRD), Close-to-Close, and Garman-Klass
What is a Baseline indicator?
The baseline is essentially a moving average, and is used to determine the overall direction of the market.
The baseline in the NNFX system is used to filter out trades that are not in line with the long-term trend of the market. The baseline is plotted on the chart along with other indicators, such as the Moving Average (MA), the Relative Strength Index (RSI), and the Average True Range (ATR).
Trades are only taken when the price is in the same direction as the baseline. For example, if the baseline is sloping upwards, only long trades are taken, and if the baseline is sloping downwards, only short trades are taken. This approach helps to ensure that trades are in line with the overall trend of the market, and reduces the risk of entering trades that are likely to fail.
By using a baseline in the NNFX system, traders can have a clear reference point for determining the overall trend of the market, and can make more informed trading decisions. The baseline helps to filter out noise and false signals, and ensures that trades are taken in the direction of the long-term trend.
What is a Confirmation indicator?
Confirmation indicators are technical indicators that are used to confirm the signals generated by primary indicators. Primary indicators are the core indicators used in the NNFX system, such as the Average True Range (ATR), the Moving Average (MA), and the Relative Strength Index (RSI).
The purpose of the confirmation indicators is to reduce false signals and improve the accuracy of the trading system. They are designed to confirm the signals generated by the primary indicators by providing additional information about the strength and direction of the trend.
Some examples of confirmation indicators that may be used in the NNFX system include the Bollinger Bands, the MACD (Moving Average Convergence Divergence), and the Stochastic Oscillator. These indicators can provide information about the volatility, momentum, and trend strength of the market, and can be used to confirm the signals generated by the primary indicators.
In the NNFX system, confirmation indicators are used in combination with primary indicators and other filters to create a trading system that is robust and reliable. By using multiple indicators to confirm trading signals, the system aims to reduce the risk of false signals and improve the overall profitability of the trades.
What is a Continuation indicator?
In the NNFX (No Nonsense Forex) trading system, a continuation indicator is a technical indicator that is used to confirm a current trend and predict that the trend is likely to continue in the same direction. A continuation indicator is typically used in conjunction with other indicators in the system, such as a baseline indicator, to provide a comprehensive trading strategy.
What is a Volatility/Volume indicator?
Volume indicators, such as the On Balance Volume (OBV), the Chaikin Money Flow (CMF), or the Volume Price Trend (VPT), are used to measure the amount of buying and selling activity in a market. They are based on the trading volume of the market, and can provide information about the strength of the trend. In the NNFX system, volume indicators are used to confirm trading signals generated by the Moving Average and the Relative Strength Index. Volatility indicators include Average Direction Index, Waddah Attar, and Volatility Ratio. In the NNFX trading system, volatility is a proxy for volume and vice versa.
By using volume indicators as confirmation tools, the NNFX trading system aims to reduce the risk of false signals and improve the overall profitability of trades. These indicators can provide additional information about the market that is not captured by the primary indicators, and can help traders to make more informed trading decisions. In addition, volume indicators can be used to identify potential changes in market trends and to confirm the strength of price movements.
What is an Exit indicator?
The exit indicator is used in conjunction with other indicators in the system, such as the Moving Average (MA), the Relative Strength Index (RSI), and the Average True Range (ATR), to provide a comprehensive trading strategy.
The exit indicator in the NNFX system can be any technical indicator that is deemed effective at identifying optimal exit points. Examples of exit indicators that are commonly used include the Parabolic SAR, the Average Directional Index (ADX), and the Chandelier Exit.
The purpose of the exit indicator is to identify when a trend is likely to reverse or when the market conditions have changed, signaling the need to exit a trade. By using an exit indicator, traders can manage their risk and prevent significant losses.
In the NNFX system, the exit indicator is used in conjunction with a stop loss and a take profit order to maximize profits and minimize losses. The stop loss order is used to limit the amount of loss that can be incurred if the trade goes against the trader, while the take profit order is used to lock in profits when the trade is moving in the trader's favor.
Overall, the use of an exit indicator in the NNFX trading system is an important component of a comprehensive trading strategy. It allows traders to manage their risk effectively and improve the profitability of their trades by exiting at the right time.
How does Loxx's GKD (Giga Kaleidoscope Modularized Trading System) implement the NNFX algorithm outlined above?
Loxx's GKD v1.0 system has five types of modules (indicators/strategies). These modules are:
1. GKD-BT - Backtesting module (Volatility, Number 1 in the NNFX algorithm)
2. GKD-B - Baseline module (Baseline and Volatility/Volume, Numbers 1 and 2 in the NNFX algorithm)
3. GKD-C - Confirmation 1/2 and Continuation module (Confirmation 1/2 and Continuation, Numbers 3, 4, and 5 in the NNFX algorithm)
4. GKD-V - Volatility/Volume module (Confirmation 1/2, Number 6 in the NNFX algorithm)
5. GKD-E - Exit module (Exit, Number 7 in the NNFX algorithm)
(additional module types will added in future releases)
Each module interacts with every module by passing data between modules. Data is passed between each module as described below:
GKD-B => GKD-V => GKD-C(1) => GKD-C(2) => GKD-C(Continuation) => GKD-E => GKD-BT
That is, the Baseline indicator passes its data to Volatility/Volume. The Volatility/Volume indicator passes its values to the Confirmation 1 indicator. The Confirmation 1 indicator passes its values to the Confirmation 2 indicator. The Confirmation 2 indicator passes its values to the Continuation indicator. The Continuation indicator passes its values to the Exit indicator, and finally, the Exit indicator passes its values to the Backtest strategy.
This chaining of indicators requires that each module conform to Loxx's GKD protocol, therefore allowing for the testing of every possible combination of technical indicators that make up the six components of the NNFX algorithm.
What does the application of the GKD trading system look like?
Example trading system:
Backtest: Strategy with 1-3 take profits, trailing stop loss, multiple types of PnL volatility, and 2 backtesting styles
Baseline: Hull Moving Average
Volatility/Volume: Hurst Exponent
Confirmation 1: T3-based CCI as shown on the chart above
Confirmation 2: Williams Percent Range
Continuation: Fisher Transform
Exit: Rex Oscillator
Each GKD indicator is denoted with a module identifier of either: GKD-BT, GKD-B, GKD-C, GKD-V, or GKD-E. This allows traders to understand to which module each indicator belongs and where each indicator fits into the GKD protocol chain.
Giga Kaleidoscope Modularized Trading System Signals (based on the NNFX algorithm)
Standard Entry
1. GKD-C Confirmation 1 Signal
2. GKD-B Baseline agrees
3. Price is within a range of 0.2x Volatility and 1.0x Volatility of the Goldie Locks Mean
4. GKD-C Confirmation 2 agrees
5. GKD-V Volatility/Volume agrees
Baseline Entry
1. GKD-B Baseline signal
2. GKD-C Confirmation 1 agrees
3. Price is within a range of 0.2x Volatility and 1.0x Volatility of the Goldie Locks Mean
4. GKD-C Confirmation 2 agrees
5. GKD-V Volatility/Volume agrees
6. GKD-C Confirmation 1 signal was less than 7 candles prior
Continuation Entry
1. Standard Entry, Baseline Entry, or Pullback; entry triggered previously
2. GKD-B Baseline hasn't crossed since entry signal trigger
3. GKD-C Confirmation Continuation Indicator signals
4. GKD-C Confirmation 1 agrees
5. GKD-B Baseline agrees
6. GKD-C Confirmation 2 agrees
1-Candle Rule Standard Entry
1. GKD-C Confirmation 1 signal
2. GKD-B Baseline agrees
3. Price is within a range of 0.2x Volatility and 1.0x Volatility of the Goldie Locks Mean
Next Candle:
1. Price retraced (Long: close < close or Short: close > close )
2. GKD-B Baseline agrees
3. GKD-C Confirmation 1 agrees
4. GKD-C Confirmation 2 agrees
5. GKD-V Volatility/Volume agrees
1-Candle Rule Baseline Entry
1. GKD-B Baseline signal
2. GKD-C Confirmation 1 agrees
3. Price is within a range of 0.2x Volatility and 1.0x Volatility of the Goldie Locks Mean
4. GKD-C Confirmation 1 signal was less than 7 candles prior
Next Candle:
1. Price retraced (Long: close < close or Short: close > close )
2. GKD-B Baseline agrees
3. GKD-C Confirmation 1 agrees
4. GKD-C Confirmation 2 agrees
5. GKD-V Volatility/Volume Agrees
PullBack Entry
1. GKD-B Baseline signal
2. GKD-C Confirmation 1 agrees
3. Price is beyond 1.0x Volatility of Baseline
Next Candle:
1. Price is within a range of 0.2x Volatility and 1.0x Volatility of the Goldie Locks Mean
3. GKD-C Confirmation 1 agrees
4. GKD-C Confirmation 2 agrees
5. GKD-V Volatility/Volume Agrees
█ GKD-C T3-based CCI
What is T3?
The T3 Moving Average (T3MA) is a technical analysis indicator that was developed by Tim Tillson. It is a trend-following indicator that aims to provide a smoother and more accurate representation of price trends than other moving average indicators.
The T3MA is a type of exponential moving average ( EMA ) that is calculated using a series of complex formulas. Unlike a simple or exponential moving average , which use fixed smoothing factors, the T3MA uses a variable smoothing factor that is based on the volatility of the underlying asset. This means that the T3MA is able to adapt to changing market conditions and provide more accurate signals.
The formula for calculating the T3MA is as follows:
T3 = a * EMA1 + (1 - a) * T3
Where:
-T3 is the current value of the T3MA
-EMA1 is the current value of the first EMA
-T3 is the previous value of the T3MA
-a is the smoothing factor, which is based on the volatility of the underlying asset and is calculated using the following formulas:
-c1 = -1 + exp (-sqrt(2) * pi / period)
-c2 = 2 * c1 * c1 + 2 * c1
-c3 = 1 - c1 - c2
-a = c1 * sqrt(period) * (close - T3) + c2 * T3 + c3 * EMA1
In simple terms, the T3MA is calculated by taking a weighted average of two different EMAs, with the weight given to each EMA depending on the volatility of the asset being analyzed. The T3MA is then smoothed using a second smoothing factor, which further reduces noise and improves the accuracy of the indicator.
The T3MA can be used in a variety of ways by traders and analysts. Some common applications include using the T3MA as a trend-following indicator, with buy signals generated when the price of an asset crosses above the T3MA and sell signals generated when the price crosses below. The T3MA can also be used in combination with other indicators and analytical techniques to confirm trading decisions and identify potential trend reversals.
Overall, the T3 Moving Average is a highly sophisticated and complex technical indicator that is designed to provide a more accurate and reliable representation of price trends. While it may be difficult for novice traders to understand and use effectively, experienced traders and analysts may find the T3MA to be a valuable tool in their trading toolbox.
What is CCI?
he Commodity Channel Index (CCI) is a technical analysis indicator that was developed by Donald Lambert in 1980. It's primarily used to identify overbought and oversold conditions in the market, as well as trend direction and potential price reversals.
The CCI is calculated by taking the difference between the typical price (the average of the high, low, and close prices) and a moving average of the typical price over a certain period of time. This difference is then divided by a factor based on the average deviation of the typical price from the moving average.
The formula for the CCI is:
CCI = (Typical Price - 20-period SMA of Typical Price) / (0.015 x Mean Deviation)
Where:
Typical Price = (High + Low + Close) / 3
SMA = Simple Moving Average
Mean Deviation = Average of the absolute value of the difference between the Typical Price and the SMA over the last 20 periods.
The CCI is usually displayed as a line chart that oscillates around a centerline of zero. Readings above zero indicate that the typical price is above the moving average, while readings below zero indicate that the typical price is below the moving average.
Traders typically use the CCI to identify overbought and oversold conditions in the market. When the CCI rises above a certain level (e.g., +100), it's considered overbought, indicating that the price may be due for a correction or reversal. When the CCI falls below a certain level (e.g., -100), it's considered oversold, indicating that the price may be due for a bounce or reversal.
The CCI can also be used to identify potential trend reversals. When the CCI crosses above or below the zero line, it can signal a potential change in trend. For example, if the CCI crosses above the zero line, it could indicate that a bullish trend is emerging, while a cross below the zero line could indicate that a bearish trend is emerging.
Overall, the Commodity Channel Index is a useful technical analysis tool for identifying overbought and oversold conditions, as well as potential trend reversals in the market. However, like all technical indicators, it should be used in conjunction with other forms of analysis and risk management techniques to make informed trading decisions.
What is the T3-based CCI?
T3-based CCI uses T3 smoothing to reduce fasle signals and improved the signal of the regular CCI.
Requirements
Inputs
Confirmation 1 and Solo Confirmation: GKD-V Volatility / Volume indicator
Confirmation 2: GKD-C Confirmation indicator
Outputs
Confirmation 2 and Solo Confirmation Complex: GKD-E Exit indicator
Confirmation 1: GKD-C Confirmation indicator
Continuation: GKD-E Exit indicator
Solo Confirmation Simple: GKD-BT Backtest strategy
Additional features will be added in future releases.

Supertrend ANY INDICATOR (RSI, MFI, CCI, etc.) + Range FilterThis indicator will generate a supertrend of your chosen configuration on any of the following indicators:
RSI
MFI
Accum/Dist
Momentum
On Balance Volume
CCI
There is also a RANGE FILTER built into the scripts so that you can smooth the indicators for the supertrend. This is an optional configuration in the settings. Also, you can change the oversold/overbought bounds in the settings (they are removed entirely for indicators without bounds).
If you find this indicator useful, please boost it and follow! I am open to suggestions for adding new indicators to this script, it's very simple to add new ones, just suggest them in the comments.

MA (%) - Moving Average Percentage [HODLER]This indicator computes and indicates the average distance between the source and moving average, based on previous uptrend and downtrend reversals.
Firstly, this indicator offers three inputs: ma type, length, and source. These inputs allow you to customize the length, type, and source of the moving average used in the calculation.
Following this, you can select an offset percentage and a lookback value. The offset percentage enables you to fine-tune the automatically calculated distances, and only operates if the above and below percentages have not been set manually. The lookback value determines the number of highs and lows that are taken into account when calculating the averages.
Lastly, to filter out noise in the results, you can enable and adjust the Commodity Channel Index (CCI). The CCI has been normalized between 0 and 100 and oscillates around a zero line, making it a valuable tool for filtering out noise and more accurately depicting the average percentage changes within the overbought and oversold conditions.
The indicator plots the average distances in blue when the conditions of the settings are met. If the average is below, it is shown in blue, and if it is above, it is shown in yellow. The green and red colors represent whether the trend, based on the moving average, is rising or falling.
The attached chart is merely an example, and the indicator can be fully optimized when you have selected the appropriate moving average and offset percentages. These values may differ across different timeframes, and it is essential to set the right values for each timeframe.
It is worth noting that this indicator is specifically designed to identify tops and bottoms. However, it is important to keep in mind that no indicator can guarantee 100% accuracy, and the market can always behave unpredictably with unexpected price movements. Despite this, the indicator can be a useful tool when utilized in combination with other indicators.
Please don't hesitate to reach out if you have any questions or suggestions regarding this indicator.

Super 6x: RSI, MACD, Stoch, Loxxer, CCI, & Velocity [Loxx]Super 6x: RSI , MACD , Stoch , Loxxer, CCI , & Velocity is a combination of 6 indicators into one histogram. This includes the option to allow repainting.
What is MACD?
Moving average convergence divergence ( MACD ) is a trend-following momentum indicator that shows the relationship between two moving averages of a security’s price. The MACD is calculated by subtracting the 26-period exponential moving average ( EMA ) from the 12-period EMA .
What is CCI?
The Commodity Channel Index ( CCI ) measures the current price level relative to an average price level over a given period of time. CCI is relatively high when prices are far above their average. CCI is relatively low when prices are far below their average. Using this method, CCI can be used to identify overbought and oversold levels.
What is RSI?
The relative strength index is a technical indicator used in the analysis of financial markets. It is intended to chart the current and historical strength or weakness of a stock or market based on the closing prices of a recent trading period. The indicator should not be confused with relative strength .
What is Stochastic?
The stochastic oscillator, also known as stochastic indicator, is a popular trading indicator that is useful for predicting trend reversals. It also focuses on price momentum and can be used to identify overbought and oversold levels in shares, indices, currencies and many other investment assets.
What is Loxxer?
The Loxxer indicator is a technical analysis tool that compares the most recent maximum and minimum prices to the previous period's equivalent price to measure the demand of the underlying asset.
What is Velocity?
In simple words, velocity is the speed at which something moves in a particular direction. For example as the speed of a car travelling north on a highway, or the speed a rocket travels after launching.
How to use
Long signal: All 4 indicators turn green
Short signal: All 4 indicators turn red
Included
Bar coloring
Alerts

Direction Analysis WavesDescription
It is an indicator that aims to provide information about the direction of the trend, the basis of which is the CCI, CMO and MFI indices.
Symbols on the indicator are for informational purposes. Information about colors and symbols is given below.
Blue Wave: Graphical representation of the Commodity Channel Index (CCI) curve.
Green/Red Wave: Graphical representation of the Chande Momentum Oscillator (CMO) curve. This curve turns green when it rises above zero, and turns red when it falls below zero.
Yellow Wave: Graphical representation of the Money Flow Index (MFI) curve.
Blue Line: CCI line.
Green/Red Cross: CCI line shows green cross on red cross below 0 value.
Warning
As a result, this indicator should be expected to give an idea of the trend direction, not a trading signal.
Version
v1.0
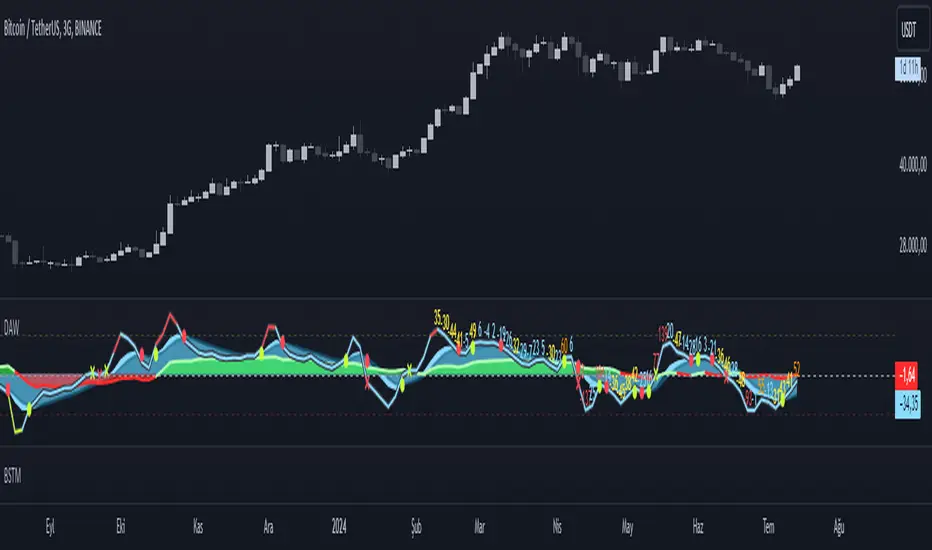
Strategy Myth-Busting #11 - TrendMagic+SqzMom+CDV - [MYN]This is part of a new series we are calling "Strategy Myth-Busting" where we take open public manual trading strategies and automate them. The goal is to not only validate the authenticity of the claims but to provide an automated version for traders who wish to trade autonomously.
Our 11th one is an automated version of the "Magic Trading Strategy : Most Profitable Indicator : 1 Minute Scalping Strategy Crypto" strategy from "Fx MENTOR US" who doesn't make any official claims but given the indicators he was using, it looked like on the surface that this might actually work. The strategy author uses this on the 1 minute and 3 minute timeframes on mostly FOREX and Heiken Ashi candles but as the title of his strategy indicates is designed for Crypto. So who knows..
To backtest this accurately and get a better picture we resolved the Heiken Ashi bars to standard candlesticks . Even so, I was unable to sustain any consistency in my results on either the 1 or 3 min time frames and both FOREX and Crypto. 10000% Busted.
This strategy uses a combination of 3 open-source public indicators:
Trend Magic by KivancOzbilgic
Squeeze Momentum by LazyBear
Cumulative Delta Volume by LonesomeTheBlue
Trend Magic consists of two main indicators to validate momentum and volatility. It uses an ATR like a trailing Stop to determine the overarching momentum and CCI as a means to validate volatility. Together these are used as the primary indicator in this strategy. When the CCI is above 0 this is confirmation of a volatility event is occurring with affirmation based upon current momentum (ATR).
The CCI volatility indicator gets confirmation by the the Cumulative Delta Volume indicator which calculates the difference between buying and selling pressure. Volume Delta is calculated by taking the difference of the volume that traded at the offer price and the volume that traded at the bid price. The more volume that is traded at the bid price, the more likely there is momentum in the market.
And lastly the Squeeze Momentum indicator which uses a combination of Bollinger Bands, Keltner Channels and Momentum are used to again confirm momentum and volatility. During periods of low volatility, Bollinger bands narrow and trade inside Keltner channels. They can only contract so much before it can’t contain the energy it’s been building. When the Bollinger bands come back out, it explodes higher. When we see the histogram bar exploding into green above 0 that is a clear confirmation of increased momentum and volatile. The opposite (red) below 0 is true when there are low periods. This indicator is used as a means to really determine when there is premium selling plays going on leading to big directional movements again confirming the positive or negative momentum and volatility direction.
If you know of or have a strategy you want to see myth-busted or just have an idea for one, please feel free to message me.
Trading Rules
1 - 3 min candles
FOREX or Crypto
Stop loss at swing high/low | 1.5 risk/ratio
Long Condition
Trend Magic line is Blue ( CCI is above 0) and above the current close on the bar
Squeeze Momentum's histogram bar is green/lime
Cumulative Delta Volume line is green
Short Condition
Trend Magic line is Red ( CCI is below 0) and below the current close on the bar
Squeeze Momentum's histogram bar is red/maroon
Cumulative Delta Volume line is peach

TTP OSC SuperTrendThis strategy instead of following the trend of the price it follows the trend of an oscillator.
You can follow the trend of RSI or CCI.
We use SuperTrend applied to either oscillator for entering a long.
Position can close from
- using a stop loss percentage parameter
- or when entering downtrend
- or when using TP% when the target is achieved
Ideas:
- Use the SuperTrend multiplier to match the oscillator behaviour, CCI moves less, so I use 1.5 multiplier. With RSI I use 3
- I find this strategy works great to do swing trades during bull markets. When backtesting BTCUSDT it outperforms buy and hold before the beginning of the bear market.
- Try RSI 7 instead of RSI 14 for faster response
Alerts
It supports separated payloads for each alert type:
1- Deal open
2- TP% reached
3- SL%
4- Downtrend deal close

Supply and Demand Zone ConfirmationHello traders and investors,
Today, I am going to share an indicator that I made by mixing RSI and CCI in different timeframe. You can use this indicator in various ways, however the best possible way I would recommend you to use it is to combine it with price action. I would suggest to play with, so you can decide if it works the best for you.
The whole purpose of making this indicator was to eliminate confusion around different indicators for overbought and oversold and many other headaches. You use price action and you are looking for confirmation to see there is a PRZ? here is your indicator. I found there are certain patterns with CCI and RSI in higher timeframe which helps to find the PRZ and I made this indicator with it.
You can choose to use this indicator in different timeframe. But you have to consider, the lower timeframe you'll go, you will get more signals but the effectiveness goes down with it. Also, if you are willing to change the time frame, You have to change some settings as well which I'll get into it in a moment.
The default settings are for 30min timeframe with these settings.
ibb.co
In case you would like to go to 15min time frame, here is the suggested changes in the setting.
ibb.co
I would suggest to play with different timeframe to find the suitable setting for the pairs you would like to trade. The main goal is you have to choose first CCI one timeframe higher ( if you are in 5min chart, first CCI should be at least 15 or 30min) and the second CCI one timeframe higher than first CCI (if you choose 15min for first CCI, go with 1hr for second CCI). And lastly, RSI can be variable but it is suggested to be at least as low as first CCI timeframe.
Lastly, you have to consider nothing in this script is a financial advice, it is only to help you improve your trading style by making other indicators as simple as possible.

Momentum shift CCI, MACD, RSI, AligatorIndicator for BTC only.
This indicator combines CCI MACD RSI AND William's alligator.
Bullish macd cross, RSI over 50, bullish William cross and positive CCI result in green background. Otherwise red background is displayed.
For better visibility extreme values can be displayed with greater color saturation. 1D BTCUSD is best with default values.
For other TFs Bull side and bear side values can be tweaked.
For bright red we may assume price to be `greatly oversold.
For bright green we may seek some profit taking.