Candlestick analysis

Position Size calculatorOverview
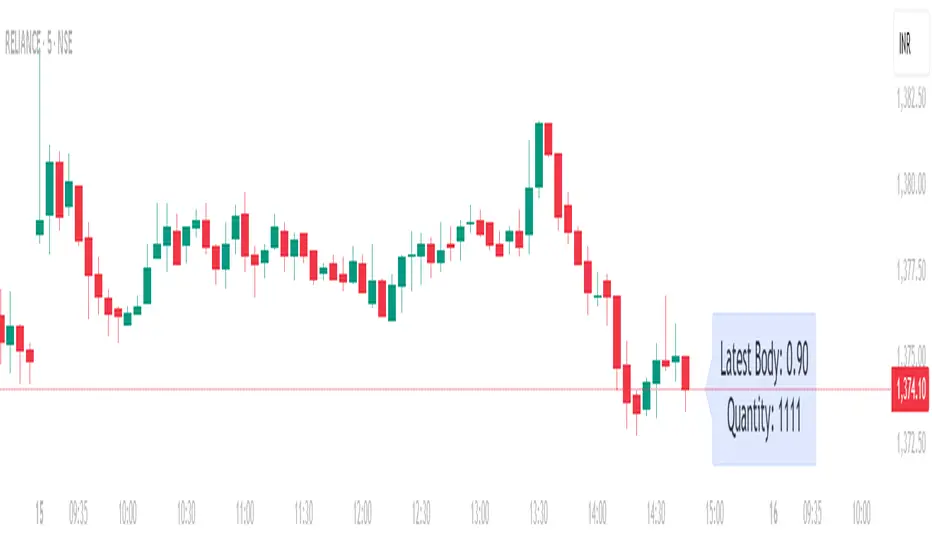
This indicator automatically calculates the average candle body size (|open − close|) for the current trading day and derives a position size (quantity) based on your fixed risk per trade (default ₹1000).
For example:
If today’s average candle body = ₹3.50 and risk = ₹1000 → Quantity = 285
How It Works:
The indicator calculates the absolute difference between open and close (the candle’s body) for every bar of the current day.
It averages those body sizes to estimate the average daily volatility.
Then it divides your chosen risk per trade by the average body size to estimate an appropriate quantity.
It automatically resets at the start of each new day.
Why Use It
While risk size can be derived manually or using TradingView’s built-in Long/Short Position Tool, this indicator provides a faster, more practical alternative when you need to make quick trade decisions — especially in fast-moving intraday markets .
It keeps you focused on execution rather than calculation.
Tip
You can still verify or fine-tune the quantity using the Long/Short Position Tool or a manual calculator, but this indicator helps you react instantly when opportunities appear.
Smart BUY/SELL Pop IndicatorSmart BUY/SELL Indicator
This indicator shows BUY and SELL labels directly on your TradingView chart. Green labels indicate potential upward moves, and red labels indicate potential downward moves.
How it works
It uses two moving averages: a fast (9-period) and a slow (21-period). A BUY signal appears when the fast MA crosses above the slow MA, and a SELL signal appears when it crosses below.
Why it’s useful
It gives a visual guide for entry and exit points without alert messages. Accuracy can improve by adding filters like RSI or MACD.

Buy Sell Signals MKSConditions for Buying is Current candle a0 LOW = OPEN, b) Has a smaller wick than the previous cabndle size. Size here means high minus low of previous candle. More importantly Buy signal is genarated if the prious candle or series of candles were red. Condition for Sell signal is completely opposite of Buy signal. Buy signal will appear only after a Sell signal was generated earlier and vice versa for Sell signal. Signals are generated on a 5 minute timeframe. Idea is solely concieived by me.
Disclaimer: Just donot blindly take trades based on signals. Analyse the chart pattern, price action on different time frames of your own...

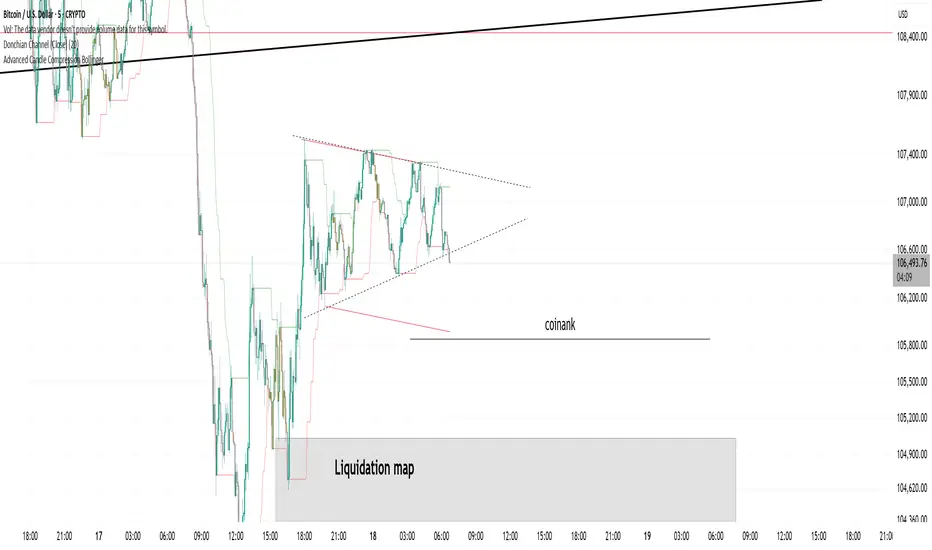
Donchian Channel (Close)Donchian channel based on candle close. Allows you to avoid fake wicks and rely only on closing prices.
Strong Engulfing Scalping qgm engulfing detector. If no time to find engulfing my strategy found engulfing alert u through notification

HTF Fibonacci on intraday ChartThis indicator plots Higher Timeframe (HTF) Fibonacci retracement levels directly on your intraday chart, allowing you to visualize how the current price action reacts to key retracement zones derived from the higher timeframe trend.
Concept
Fibonacci retracement levels are powerful tools used to identify potential support and resistance zones within a price trend.
However, these levels are often calculated on a higher timeframe (like Daily or Weekly), while most traders execute entries on lower timeframes (like 15m, 30m, or 1H).
This indicator bridges that gap — it projects the higher timeframe’s Fibonacci levels onto your current intraday chart, helping you see where institutional reactions or swing pivots might occur in real time.
How It Works
Select the Higher Timeframe (HTF)
You can choose which higher timeframe the Fibonacci structure is derived from — default is Daily.
Define the Lookback Period
The script looks back over the chosen number of bars on the higher timeframe to find the highest high and lowest low — the base for Fibonacci calculations.
Plots Key Fibonacci Levels Automatically:
0% (Low)
23.6%
38.2%
50.0%
61.8%
78.6%
100% (High)
Dynamic Labels
Each Fibonacci level is labelled on the latest bar, updating in real time as new data forms on the higher timeframe.
Best Used For
Intraday traders who want to align lower-timeframe entries with higher-timeframe structure.
Swing traders confirming price reactions around major Fibonacci retracement zones.
Contextual analysis for pullback entries, breakout confirmations, or retests of key levels.
Recommended Settings
Higher Timeframe: Daily (for intraday analysis)
Lookback: 50 bars (adjust based on volatility)
Combine with MACD, RSI, CPR, or Pivots for confluence.
License & Credits
Created and published for educational and analytical purposes.
Inspired by standard Fibonacci analysis practices.

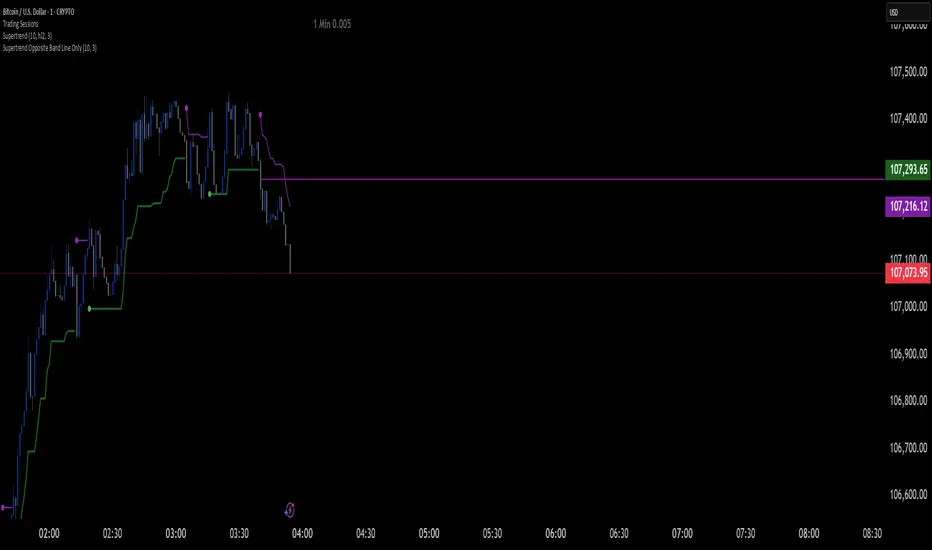
Supertrend Opposite Band Line Onlywhen super trend changes Trend , its important to wait for crossing the Price line of opposite Band so i have written this script . this will help you Traders for sure
ETH Smart Money Order Blocks Detector derek
This script helps identify potential Order Blocks (institutional price zones) on the chart based on Breaks of Structure (BOS).
It automatically highlights demand zones (green blocks) and supply zones (red blocks), making it easier to read institutional market flow.
Ideal for traders using Smart Money Concepts (SMC) or market structure analysis.
Compatible with any asset and timeframe.
🔹 Bullish OB = potential buy entry zone
🔹 Bearish OB = potential sell or resistance zone
Author: Derek 🧠💹

Volume Biased CandlesVolume Biased Candles
This indicator visualizes the underlying volume polarity of price action by coloring candles based on directional volume bias over a rolling bucket of bars.
Instead of reading price alone, each candle reflects whether buying or selling pressure has dominated within its recent volume structure — giving a more intuitive picture of volume sentiment beneath price movement.
🔹 How it works
Bucket Size (n) → defines how many candles are aggregated to evaluate directional volume bias
For each bucket, total up-volume and down-volume are compared to determine overall market pressure
Volume Bias Score → a continuous ratio from -1 to +1, representing the relative dominance of buyers or sellers
Candles are colored according to the active bias — green for positive (buying), red for negative (selling)
🔹 Use cases
Visualize shifts in market control without needing divergence overlays
Combine with delta divergence or price structure tools to validate entries and exits
Simplify volume and price insights into an intuitive, single-chart visualization
✨ Volume Biased Candles transforms standard candles into a live sentiment gauge, revealing whether the dominant flow behind price movement is bullish or bearish.

多周期Stoch RSI共振指标Multi-period Stoch RSI resonance indicator
This is a multi-period resonance indicator,4h、1h、30m、15m

EMA Ribbon MozyMozy TRading
EMA Ribbons for short time frames on daily traders. Buy or sell during crosses

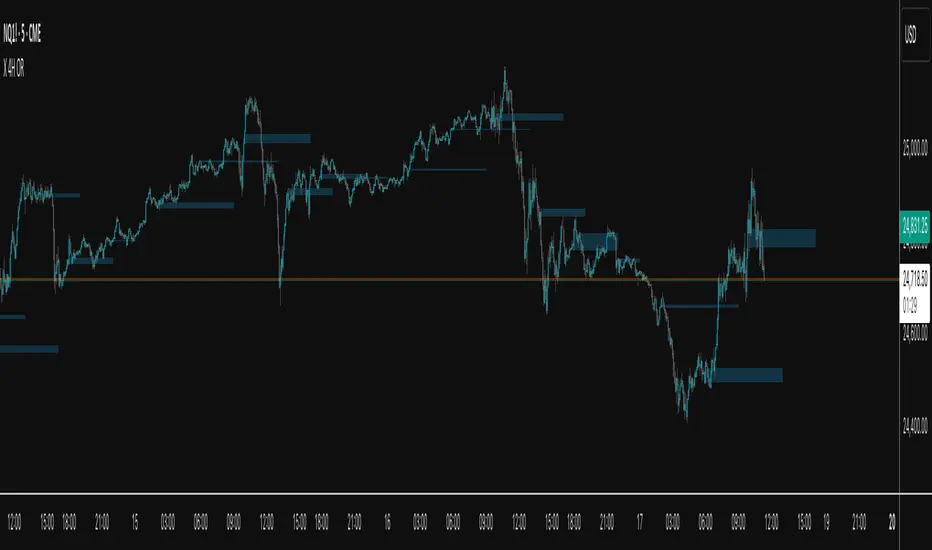
X 4H ORThis indicator plots the 30-second opening range (high/low) for six New-York–time anchors—2am, 6am, 10am, 2pm, 6pm, and 10pm—and extends each box to a fixed end time (e.g., 2am→9am, 6am→1pm, etc.). It samples true 30-second data regardless of the chart timeframe, so the captured highs/lows are precise.
What it does
Builds the first 30s OR for each selected anchor and draws a time-anchored box for that session.
Archives every day’s boxes (up to a cap) so you can study how price interacts with past ranges.
Adds per-anchor show toggles to display the latest box for that anchor.
Adds a global History toggle to show/hide all archived boxes without deleting them (clean view vs. context view).
Uses borderless, color-coded fills per anchor to avoid edge distortion while keeping levels easy to read.
Why it’s useful
Quickly spot session inflection zones where liquidity, breakouts, or reversals cluster.
Compare how current price trades relative to recent session ranges for bias and risk framing.
Perform lightweight post-session review/backtesting on OR breaks, retests, and range rotations.
Keep charts decluttered on demand (latest only), or flip on history for deeper context.
黄金专用LPPL特征检测(Log-Periodic Power Law Singularity)专门用于黄金走势的LPPL检测,在技术分析中,LPPL 奇点指的是对数周期幂律奇异性(Log-Periodic Power Law Singularity),它是对数周期幂律模型(LPPL)中的一个关键概念。以下是关于它的详细介绍:
提出者及背景:LPPL 模型是由研究市场泡沫的先驱者、物理学家迪迪埃・索尔内特(Didier Sornette)等人提出的。该模型结合了理性预期泡沫的经济理论、投资者的模仿和羊群行为的行为金融学以及分岔和相变的数学统计物理学,用于检测金融市场中的泡沫和预测市场转折点。
模型原理:LPPL 模型假设当市场出现泡沫时,资产价格会呈现出一种特殊的波动模式,这种模式由正反馈机制驱动。在泡沫形成过程中,投资者的模仿和跟风行为导致市场参与者的一致性和协同性急剧上升,价格出现 “快于指数” 的增长,同时伴随着加速的对数周期振荡。而 LPPL 奇点就是价格增长和振荡达到极限的那个有限时间点,在这个点之前,价格增长越来越快,振荡频率也越来越高,当到达奇点时,泡沫破裂,市场往往会出现急剧的反转和崩盘。
数学表达:LPPL 模型的数学公式较为复杂,其原始形式提出了一个由 3 个线性参数和 4 个非线性参数组成的函数。通过将这个函数与对数价格时间序列进行拟合,可以估计出模型的参数,进而确定奇点的时间位置等信息。
在金融市场中的应用:LPPL 模型及其中的奇点概念主要用于检测金融市场中的泡沫和预测市场的崩溃点。例如,在 2008 年石油价格泡沫和 2009 年上海股市泡沫等事件中,该模型都被用于分析和预测市场的转折点。不过,该模型也存在一定的局限性,比如对奇点具体点位的预测误差较大,而且市场情况复杂多变,可能会有强大的外力干扰等因素影响模型的准确性。
The LPPL model was proposed by physicist Didier Sornette, a pioneer in the study of market bubbles, and others. The model combines the economic theory of rational expectations bubbles, behavioral finance on investor imitation and herding behavior, and the mathematical statistical physics of bifurcations and phase transitions to detect bubbles in financial markets and predict market turning points.
Model Principle: The LPPL model posits that when a market bubble forms, asset prices exhibit a distinctive pattern of fluctuation driven by a positive feedback mechanism. During the bubble's formation, investors' imitation and bandwagon-following behavior lead to a sharp increase in consistency and coordination among market participants, resulting in "faster-than-exponential" price growth accompanied by accelerating logarithmic-periodic oscillations. The LPPL singularity is the finite point in time where price growth and oscillation reach their limits. Prior to this point, prices grow increasingly faster, and the frequency of oscillations increases. When the singularity is reached, the bubble bursts, and the market often experiences a sharp reversal and crash.

Real Relative Strength Breakout & BreakdownReal Relative Strength Breakout & Breakdown Indicator
What It Does
Identifies high-probability trading setups by combining:
Technical Breakouts/Breakdowns - Price breaking support/resistance zones
Real Relative Strength (RRS) - Volatility-adjusted performance vs benchmark (SPY)
Key Insight: The strongest signals occur when price action contradicts market direction—breakouts during market weakness or breakdowns during market strength show exceptional buying/selling pressure.
Real Relative Strength (RRS) Calculation
RRS measures outperformance/underperformance on a volatility-adjusted basis:
Power Index = (Benchmark Price Move) / (Benchmark ATR)
RRS = (Stock Price Move - Power Index × Stock ATR) / Stock ATR
RRS (smoothed) = 3-period SMA of RRS
Interpretation:
RRS > 0 = Relative Strength (outperforming)
RRS < 0 = Relative Weakness (underperforming)
Signal Types
🟢 Large Green Triangle (Premium Long)
Condition: Breakout + RRS > 0
Meaning: Stock breaking resistance WHILE outperforming benchmark
Best when: Market is weak but stock breaks out anyway = exceptional strength
Use: High-conviction long entries
🔵 Small Blue Triangle (Standard Breakout)
Condition: Breakout + RRS ≤ 0
Meaning: Breaking resistance but underperforming benchmark
Typical: "Rising tide lifts all boats" scenario during market rally
Use: Lower conviction—may just be following market
🟠 Large Orange Triangle (Premium Short)
Condition: Breakdown + RRS < 0
Meaning: Stock breaking support WHILE underperforming benchmark
Best when: Market is strong but stock breaks down anyway = severe weakness
Use: High-conviction short entries
🔴 Small Red Triangle (Standard Breakdown)
Condition: Breakdown + RRS ≥ 0
Meaning: Breaking support but outperforming benchmark
Typical: Stock falling less than market during selloff
Use: Lower conviction—may recover when market does
Why Large Triangles Matter
Large signals show divergence = genuine institutional flow:
Stock breaking out while market falls → Aggressive buying despite headwinds
Stock breaking down while market rallies → Aggressive selling despite tailwinds
These setups reveal where real conviction lies, not just momentum-following behavior.
Quick Settings
RRS: 12-period lookback, 3-bar smoothing, vs SPY
Breakouts: 5-period pivots, 200-bar lookback, 3% zone width, 2 minimum tests

(SPY to ES) ETF→Futures Multi-Level (10 Levels + Select All)Converts selected ETF levels (SPY or QQQ) into equivalent futures levels (ES or NQ).
Uses live price ratio between ETF and futures for real-time level translation.
Supports 10 independent levels (A–J) with user-defined ETF price inputs.
Provides checkboxes to toggle each level’s visibility or show all at once.
Applies smoothing (ta.sma) to reduce noise from short-term price movement.
Lets user customize each line’s color, width, and style (solid, dashed, dotted).
Automatically updates lines as new bars form without user interaction.
Uses persistent line objects to keep levels stable when scrolling or zooming.
Adapts to either SPY→ES or QQQ→NQ depending on the “Convert SPY?” toggle.
Draws clean horizontal lines without legend clutter for visual precision.
SOME ONE PUBLISHED THIS FUNCTIONALITY FOR A CHARGE SO I MADE IT FREE.
-rA
