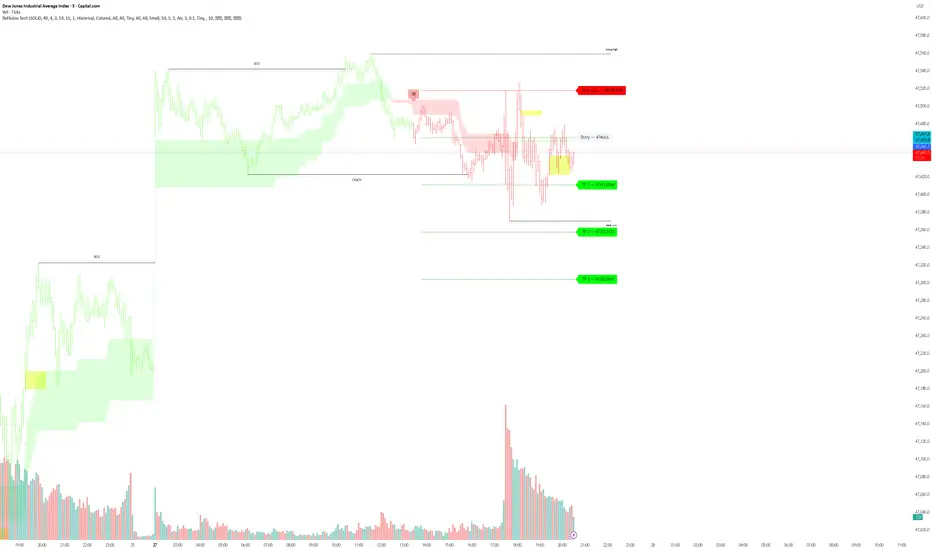
eFkolos TechMachine learning-enhanced SuperTrend indicator that uses k-means clustering to adaptively optimize SuperTrend parameters based on historical performance. Let me break down what makes this unique:
Key Innovation
Instead of using a single fixed SuperTrend factor, this indicator:
Calculates multiple SuperTrends simultaneously (with factors from 1 to 5 by default, stepped at 0.5)
Tracks performance of each variant using exponential smoothing
Clusters them into 3 groups (Best/Average/Worst) using k-means algorithm
Adapts by selecting the average factor from your chosen cluster
Clever Technical Aspects
Performance Metric: Uses a smart approach where performance = EMA of (price_change × signal_direction), giving positive values when the SuperTrend correctly predicts direction.
K-means Implementation: Properly initializes centroids using quartiles and iterates until convergence - this is solid unsupervised learning.
Adaptive MA Layer: The perf_ama that adapts faster when the performance index is high (more confidence) and slower when low.
Memory Management: Uses UDTs (User Defined Types) efficiently with arrays to handle multiple SuperTrend instances.
밴드 및 채널
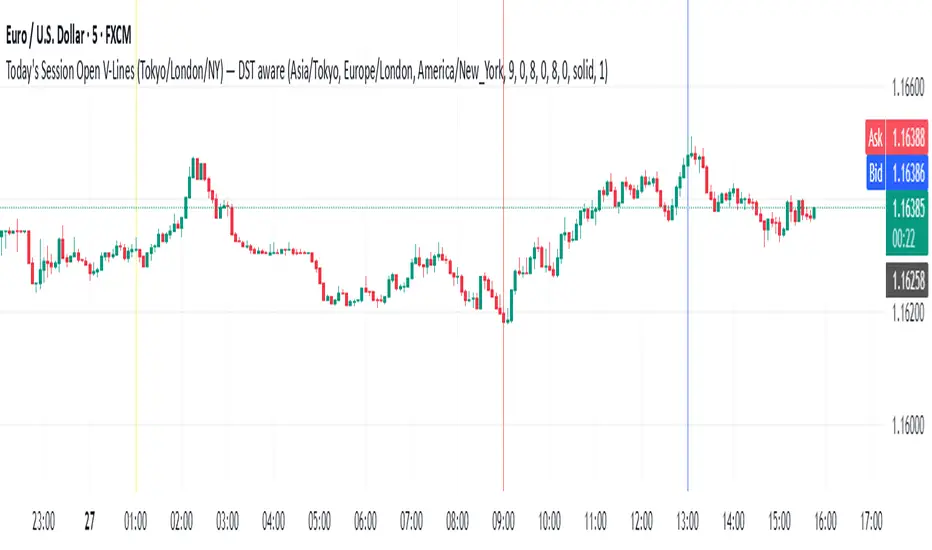
Todays Session Open LN,NYWhen are the Asian, London and New York open for each session simple stuff trading view made me right more stuff so i can publish this what to do c'est la vie
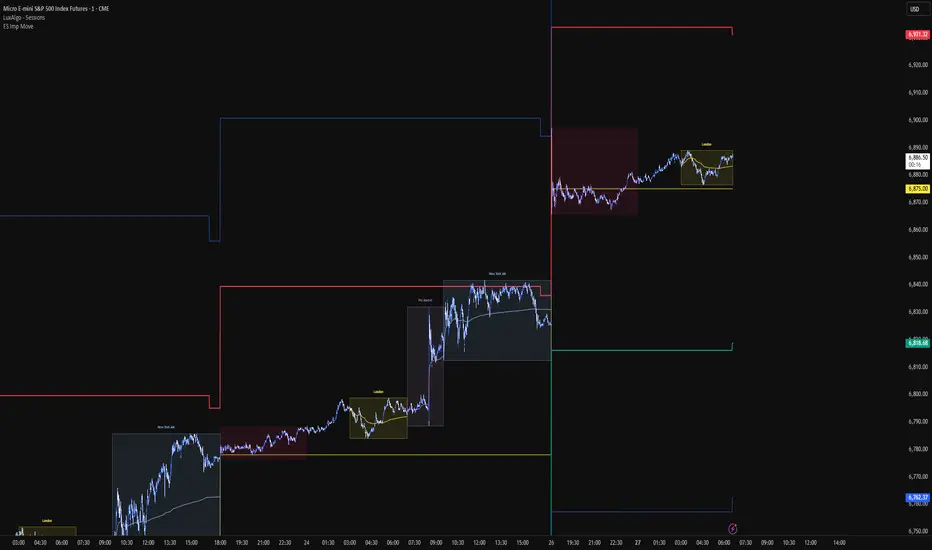
VIX Implied move on ESCalculated the moves based on VIX and draws horizontal lines on ES. Best timeframe to start is 18 hrs.
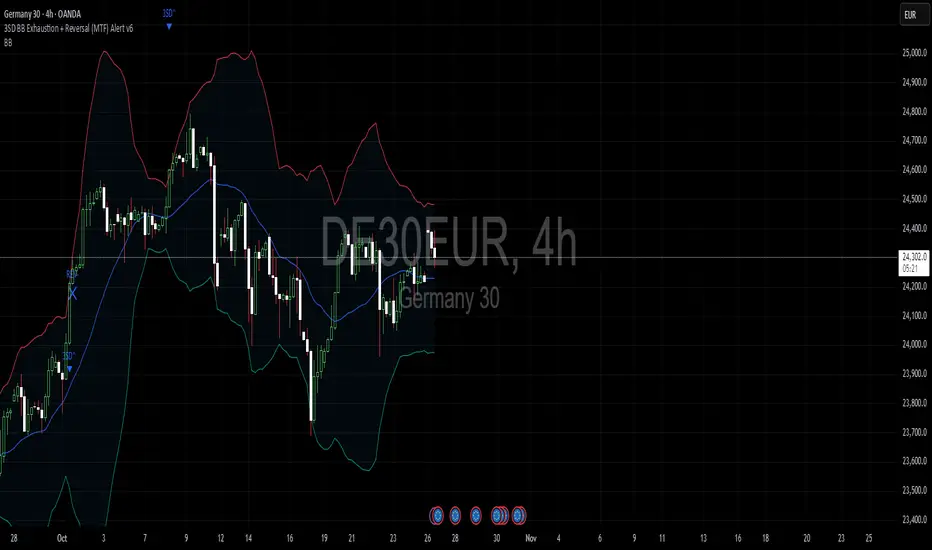
3SD Bollinger Exhaustion & Reversal Alert IndicatorThe Bollinger Band 3 Standard Deviation (3SD) captures roughly 99% of price action within its boundaries.
When price moves beyond these extremes, it often signals temporary overextension — creating opportunities for mean reversion trades, especially when aligned with the prevailing trend.
This indicator alerts you when:
- Price touches the 3SD Bollinger Band on higher timeframes (H4, D1, W1, M1), and
- A reversal reaction occurs — defined by a bullish or bearish candle close on H1 or H4.
Together, these conditions identify potential high-probability entry zones where exhaustion meets trend alignment.
🚀 Coming Soon
A premium version is in development, combining this 3SD exhaustion logic with my proprietary trend-following system.
It will generate confluence-based trade signals when price interacts with both the 3SD band and the trend-following band.
Stay tuned for updates.
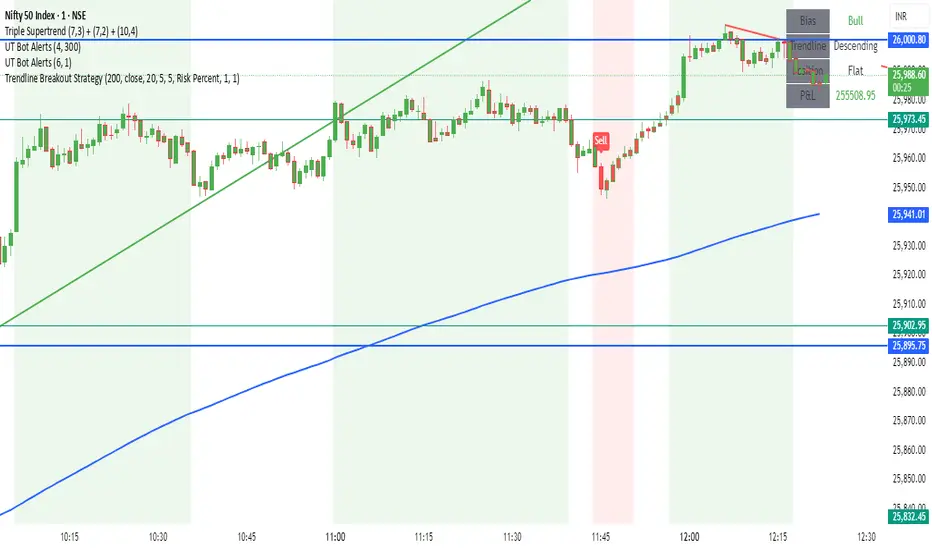
Trendline Breakout Strategy Strategy should place entries & exits so that it can be backtested (use strategy.entry and strategy.exit with explicit stop and limit prices). Include an option for fixed percent position sizing and an option for fixed contract size. Draw the trendline on the chart (with option to hide/show) and add labels that show: bias (Bull/Bear), trendline slope, entry price, SL, TP and the reason (e.g., "Trendline Breakout"). Provide user inputs for: EMA length (default 200), lookback for pivot detection, pivot sensitivity (left/right bars), quantity mode (percent / contracts), risk percent or fixed size, enable/disable backtest prints, and enable alerts. Avoid repainting: use confirmed pivot logic (pivot detection must use completed bars) and only take entry after breakout confirmed on close. Document any limitations (for example, trendline using two highest/highest bars inside lookback is approximate). Add clear comments, helpful variable names, and include example alertcondition lines for entry and exit signals.
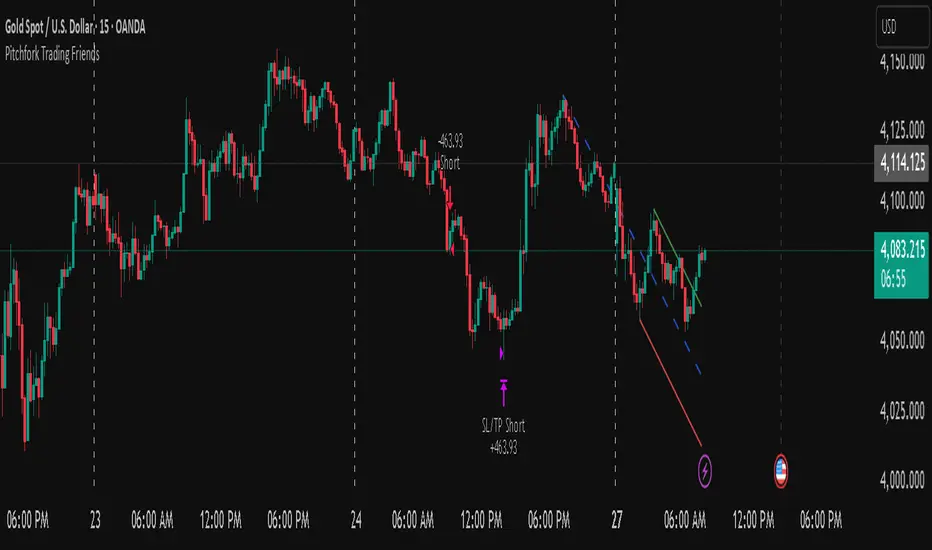
Pitchfork-Trading Friendsuses the pitchfork to give entry and exit zones, and gives a net overall summary for a beginner trader to enter into.
PDH & PDL Levels This indicator mark previous day high and low lines on current day. Lines will start at opening of the market and will remain there till end of the day. Lines are marked with PDH and PDL labels

Gaussian RibbonSummary
Adaptive Gaussian ribbon with inner/outer sigma bands and soft regime colors—green trend, red pressure, gray neutral.
What it is
A clean Gaussian filter ribbon that maps trend + volatility without the jitter. It uses a Gaussian smoother, a tiny EMA basis, and two standard-deviation bands. Color fades with distance from the basis, and flips softly (no knife-edge).
How it works
Gaussian core: IIR-style smoothing on your chosen source (default hlc3).
Basis: EMA(3) of the Gaussian for a steadier slope.
Bands: Inner = Basis ± (σ × Inner Mult), Outer = Basis ± (σ × Outer Mult).
Regime: z-score → softsign → EMA(3) → bull / neutral / bear.
Faded look: opacity ramps with distance; neutral turns gray.
What “Regime” Means (Simple)
A regime is the market’s “weather.” It shifts between Bull, Neutral, and Bear. Different tactics work in each.
How this indicator detects regime
Builds a smoothed score of price vs. the basis (z-score → softsign → EMA).
Score > 0 = Bull, score < 0 = Bear. Inside the inner band = Neutral filter to cut noise.
Color changes are soft (faded) so flips don’t knife-edge.
Playbook (What to do)
Bull (Green): Buy pullbacks to the inner band; add on strength; cut fast if price falls back inside the ribbon.
Neutral (Gray): Reduce size, fade extremes, or stand down. Wait for a clean break in either direction.
Bear (Red): Sell/short rallies to the ribbon; protect capital; flip long only after a confirmed regime turn.
For Pros (Tuning & Confirmation)
Timeframe bias: Use higher TF (1W/2W) for context; trade on 1D/4H in the higher-TF direction.
Smoother vs faster: Increase Length to reduce flip-flop; decrease for earlier turns.
Vol filter: Widen Outer/Inner multipliers in choppy markets; narrow in strong trends.
Confirm: Use structure (HH/HL vs LH/LL), volume/OBV, or your MA; ribbon = context, not a standalone trigger.
How to read it
Green = trend support; pullbacks to the inner band are typical buy-the-dip zones.
Gray = inside ribbon; chop/mean reversion. Size down or wait.
Red = trend pressure; rallies into ribbon are fade zones until regime flips.
Opacity increases with distance = stronger momentum.
Good starting presets
Macro (1W–2W): Length 90–110, Outer 2.3, Inner 1.3, Source hlc3.
Swing (1D): Length 60–80, Outer 2.0, Inner 1.4.
Intraday (1–4H): Length 30–40, Outer 1.8, Inner 1.2.
Options
Opens in a separate pane (overlay=false). Set overlay=true to place on candles (consider +5 transparency on fills).
Watermark is “CAYEN” (table-based, no editor drama).
Why it’s “safe”
No repaint. No lookahead; uses only closed-bar data.
Deterministic state and divide-by-zero guards.
Limitations
It’s a context tool. It will lag at regime turns (by design). Use structure/volume to time entries.
Credits
Script by Jason Cayen. Gaussian smoothing is classic DSP math (public domain).
Release notes (v1.0)
Initial public release: faded bands, neutral zone, soft regime colors, Non-repainting; pane by default.

FVG Donchian Channel strategy30min FVG + Donchian Channel strategy
buy sell by 30min fvg
and stoploss , take profit by Donchian Channel
Run the strategy on the 1min timeframe!

Bullish & Bearish Reversal Pattern with Sequential Bars20 Bollinger Bands and custom Stochasti_MTM Setup
Both long and short reversal signals.

Triple EMA (5, 8, 13) + Confirmed Alerts with SoundThis indicator uses three Exponential Moving Averages (EMA 5, 8, and 13) to generate buy and sell signals when the EMAs are properly aligned and not touching. Signals are confirmed on candle close and can trigger customizable sound alerts directly from the TradingView alert panel.

Reverse RSI LevelsSimple reverse RSI calculation
As default RSI values 30-50-70 are calculated into price.
This can be used similar to a bollinger band, but has also multiple other uses.
70 RSI works as overbought/resistance level.
50 RSI works as both support and resistance depending on the trend.
30 RSI works as oversold/support level.
Keep in mind that RSI levels can go extreme, specially in Crypto.
I haven't made it possible to adjust the default levels, but I've added 4 more calculations where you can plot reverse RSI calculations of your desired RSI values.
If you're a RSI geek, you probably use RSI quite often to see how high/low the RSI might go before finding a new support or resistance level. Now you can just put the RSI level into on of the 4 slots in the settings and see where that support/resistance level might be on the chart.

VWAP & Band Cross Strategy v6VWAP & Band Cross Strategy v6: Script Summary
This Pine Script implements a highly flexible, multi-layered trading strategy centered around the Volume Weighted Average Price (VWAP) and its associated Standard Deviation Bands.
The strategy is designed to test various entry/exit models based on how the price interacts with the central VWAP line and the upper/lower volatility bands, with extensive risk management and confirmation filters.
1. Core Mechanics (VWAP & Bands)
VWAP Calculation: Calculates the VWAP based on a user-defined source (default is the close price).
Standard Deviation Bands: Creates upper and lower bands by calculating the standard deviation of the price (over 20 periods by default) and multiplying it by a user-defined Multiplier (default is 2.0). These bands dynamically expand and contract with volatility.
Plotting: The script clearly plots the VWAP (purple), the Upper Band (green), and the Lower Band (red), with a colored fill between the bands.
2. Entry Triggers
The core entry logic is based on a single, user-selected cross event between the price and the VWAP/Bands. The user can choose from six predefined entry types:
Entry Type Category
Entry Trigger (Long)
Entry Trigger (Short)
Mean Reversion
Price crosses over the Lower Band.
Price crosses under the Upper Band.
Trend Following
Price crosses over the Upper Band (Breakout).
Price crosses under the Lower Band (Breakout).
VWAP Cross
Price crosses over the VWAP.
Price crosses under the VWAP.
3. Filters and Confirmation
Trades are only executed if they pass a series of optional filters, making the strategy highly customizable:
Technical Confirmation (Optional): Users can enable and configure up to three additional indicators that must align with the trade direction:
RSI: Price must be Oversold (for Long) or Overbought (for Short).
SMMA: Price must be above the SMMA (for Long) or below (for Short).
MACD: MACD line must cross the Signal line and the Histogram must be positive/negative.
Time and Day Filters: Trades are restricted to a defined Entry Start/End Hour/Minute window, and only execute on user-selected Trading Days of the week.
Trade Direction: Can be toggled to execute Long Only, Short Only, or Both.
4. Advanced Risk Management (Daily Limits)
The strategy incorporates robust daily limits that reset at a configured Daily Reset Hour/Minute:
Daily Profit/Loss Limits: If the running total of Realized PnL (closed trades) + Unrealized PnL (open position) exceeds a user-defined Daily Take Profit (in Ticks) or falls below the Daily Stop Loss (in Ticks), the strategy locks out new trades and immediately closes any open position.
Max Daily Trades: Prevents the strategy from entering more than a specified number of trades per day.
5. Exit Logic
The strategy exit is also highly configurable via the Exit Type setting:
Fixed Ticks / ATR / Capped ATR: If one of these is selected, the script calculates a static Stop Loss and Take Profit level upon entry, using either fixed tick values or dynamic values based on the Average True Range (ATR), which are then executed using Pine Script's strategy.exit function.
Cross Exits (VWAP/Bands): If selected, the position is closed when the price crosses the VWAP or a specific band in the opposite direction.
End-of-Day Close: An unconditional exit that closes all open positions at a user-defined Close All Hour/Minute, regardless of profit/loss or limit status, preventing positions from being held overnight.

MNQ Hybrid Scalper Pro - Advanced NASDAQ Futures Scalping System🎯 Overview
The MNQ Hybrid Scalper Pro is a comprehensive scalping system engineered specifically for NASDAQ futures traders. This indicator implements a modern hybrid approach that combines institutional-grade VWAP analysis with momentum oscillators optimized for the unique volatility characteristics of the NASDAQ market. Developed through extensive research on MNQ/NQ price action patterns, this indicator provides clear, actionable signals while filtering out market noise during high-volatility periods.
✨ Key Features
1. VWAP Foundation
Session-anchored VWAP with automatic reset
Dynamic standard deviation bands (1σ and 2σ)
Color-coded price bars based on VWAP positioning
VWAP test detection with momentum confirmation
2. Optimized Momentum Suite
Fast RSI (7): Aggressive settings (85/15) for quick scalping signals
Scalping MACD (5,13,6): Optimized parameters with SMA option
Quick Stochastic (9,3,3): Tuned for 1-minute chart responsiveness
Divergence Detection: Automated bullish/bearish divergence alerts
3. Multi-Timeframe Trend Filter
Triple EMA system (9, 21, 50) on current and higher timeframes
Trend strength scoring (-3 to +3) for directional bias
Prevents counter-trend trades in strong trending markets
Visual trend alignment indicators
4. Smart Signal Generation
Long Signals: VWAP pullback + RSI oversold + MACD bullish turn + HTF trend alignment
Short Signals: VWAP rally + RSI overbought + MACD bearish turn + HTF trend alignment
Signal cooldown period to prevent overtrading
Session-based filtering for optimal trading windows
5. Risk Management Visualization
Automatic profit target levels (10 & 20 points)
Dynamic stop loss levels (6 & 8 points)
Risk/reward ratio calculation (minimum 1.5:1)
Breakeven level display after 5 points profit
Visual entry, target, and stop lines on chart
6. Session Intelligence
NY opening range highlight (first 30 minutes)
Optimal scalping window shading (9:30-11:30 AM EST)
Major session markers (Asia, Europe, NY)
Session countdown timer
Contract rollover reminders
7. Real-Time Performance Dashboard
Current trend status across timeframes
Signal statistics and win rate tracking
Position relative to VWAP
Momentum indicator status (OB/OS/Neutral)
Volume analysis (relative to 20-period average)
Volatility monitoring with ATR spike detection
8. Professional Alert System
High-probability entry alerts with specific levels
VWAP test notifications with momentum confirmation
Target and stop loss hit alerts
Trend alignment notifications
Comprehensive alert messages with entry, stop, and target prices
📈 How to Use
Optimal Setup:
Timeframe: Best on 1-minute charts (also works on 3-min and 5-min)
Instrument: Optimized for MNQ (Micro E-mini NASDAQ), works with NQ
Session: Most effective during NY session (9:30-11:30 AM EST)
Chart Type: Standard candlestick or bars
Signal Interpretation:
Green Triangle (▲): Long entry signal - all conditions aligned for upward scalp
Red Triangle (▼): Short entry signal - all conditions aligned for downward scalp
DIV Labels: Momentum divergence detected - potential reversal zones
Colored Bars: Green = above VWAP (bullish bias), Red = below VWAP (bearish bias)
Entry Checklist:
Wait for signal arrow to appear
Confirm trend alignment in dashboard (HTF Trend)
Check momentum status isn't extreme
Verify you're within optimal trading window
Enter at market with predetermined stop and target
⚙️ Customization Options
Display Settings:
Toggle individual components on/off
4 color schemes (Professional, Dark, Light, Classic)
Adjustable transparency and visual elements
Dashboard position selection
Signal Settings:
Adjust momentum indicator parameters
Modify risk/reward levels
Configure session filters
Set signal cooldown periods
Advanced Features:
Multi-timeframe period adjustment
Volatility filter sensitivity
Contract type selection (MNQ/NQ)
Alert configuration options
📊 Best Practices
Start in Simulation: Test the indicator in paper trading first
Respect the Trend: Don't fight the higher timeframe trend
Manage Risk: Use the suggested stop losses consistently
Time Your Trades: Focus on the optimal scalping window
Confirm Signals: Best results when multiple confirmations align
⚠️ Important Notes
Supplementary Tool: This indicator supplements but doesn't replace proper market analysis and order flow reading
No Repainting: All signals are confirmed on bar close
Education Required: Understanding of scalping principles recommended
Risk Management: Always use proper position sizing and risk management
Market Conditions: Performance varies with market volatility and conditions
🎓 Educational Value
This indicator serves as an excellent educational tool for:
Learning VWAP-based trading strategies
Understanding momentum indicator optimization
Practicing multi-timeframe analysis
Developing systematic scalping approaches
Risk management visualization
💻 Technical Specifications
Pine Script Version: v6
Calculation Method: Non-repainting, real-time
Performance: Optimized for minimal lag
Compatibility: All TradingView plan levels
Updates: Regularly maintained and improved
🏆 What Makes This Unique
Unlike generic indicators, the MNQ Hybrid Scalper Pro is specifically engineered for NASDAQ futures volatility patterns. It combines institutional trading concepts (VWAP) with retail-friendly visualization and clear signals, bridging the gap between professional and accessible trading tools.
📬 Support & Feedback
Questions, suggestions, or feedback? Leave a comment below or send a private message. Your input helps improve the indicator for the entire community.
CME_MINI:MNQ1!
Disclaimer: This indicator is for educational and informational purposes only. It does not constitute financial advice. Trading futures involves substantial risk of loss and is not suitable for all investors. Past performance is not indicative of future results. Always conduct your own analysis and consult with a qualified financial advisor.

Zero Lag Trend Signals (MTF) [Quant Trading] V7Overview
The Zero Lag Trend Signals (MTF) V7 is a comprehensive trend-following strategy that combines Zero Lag Exponential Moving Average (ZLEMA) with volatility-based bands to identify high-probability trade entries and exits. This strategy is designed to reduce lag inherent in traditional moving averages while incorporating dynamic risk management through ATR-based stops and multiple exit mechanisms.
This is a longer term horizon strategy that takes limited trades. It is not a high frequency trading and therefore will also have limited data and not > 100 trades.
How It Works
Core Signal Generation:
The strategy uses a Zero Lag EMA (ZLEMA) calculated by applying an EMA to price data that has been adjusted for lag:
Calculate lag period: floor((length - 1) / 2)
Apply lag correction: src + (src - src )
Calculate ZLEMA: EMA of lag-corrected price
Volatility bands are created using the highest ATR over a lookback period multiplied by a band multiplier. These bands are added to and subtracted from the ZLEMA line to create upper and lower boundaries.
Trend Detection:
The strategy maintains a trend variable that switches between bullish (1) and bearish (-1):
Long Signal: Triggers when price crosses above ZLEMA + volatility band
Short Signal: Triggers when price crosses below ZLEMA - volatility band
Optional ZLEMA Trend Confirmation:
When enabled, this filter requires ZLEMA to show directional momentum before entry:
Bullish Confirmation: ZLEMA must increase for 4 consecutive bars
Bearish Confirmation: ZLEMA must decrease for 4 consecutive bars
This additional filter helps avoid false signals in choppy or ranging markets.
Risk Management Features:
The strategy includes multiple stop-loss and take-profit mechanisms:
Volatility-Based Stops: Default stop-loss is placed at ZLEMA ± volatility band
ATR-Based Stops: Dynamic stop-loss calculated as entry price ± (ATR × multiplier)
ATR Trailing Stop: Ratcheting stop-loss that follows price but never moves against position
Risk-Reward Profit Target: Take-profit level set as a multiple of stop distance
Break-Even Stop: Moves stop to entry price after reaching specified R:R ratio
Trend-Based Exit: Closes position when price crosses EMA in opposite direction
Performance Tracking:
The strategy includes optional features for monitoring and analyzing trades:
Floating Statistics Table: Displays key metrics including win rate, GOA (Gain on Account), net P&L, and max drawdown
Trade Log Labels: Shows entry/exit prices, P&L, bars held, and exit reason for each closed trade
CSV Export Fields: Outputs trade data for external analysis
Default Strategy Settings
Commission & Slippage:
Commission: 0.1% per trade
Slippage: 3 ticks
Initial Capital: $1,000
Position Size: 100% of equity per trade
Main Calculation Parameters:
Length: 70 (range: 70-7000) - Controls ZLEMA calculation period
Band Multiplier: 1.2 - Adjusts width of volatility bands
Entry Conditions (All Disabled by Default):
Use ZLEMA Trend Confirmation: OFF - Requires ZLEMA directional momentum
Re-Enter on Long Trend: OFF - Allows multiple entries during sustained trends
Short Trades:
Allow Short Trades: OFF - Strategy is long-only by default
Performance Settings (All Disabled by Default):
Use Profit Target: OFF
Profit Target Risk-Reward Ratio: 2.0 (when enabled)
Dynamic TP/SL (All Disabled by Default):
Use ATR-Based Stop-Loss & Take-Profit: OFF
ATR Length: 14
Stop-Loss ATR Multiplier: 1.5
Profit Target ATR Multiplier: 2.5
Use ATR Trailing Stop: OFF
Trailing Stop ATR Multiplier: 1.5
Use Break-Even Stop-Loss: OFF
Move SL to Break-Even After RR: 1.5
Use Trend-Based Take Profit: OFF
EMA Exit Length: 9
Trade Data Display (All Disabled by Default):
Show Floating Stats Table: OFF
Show Trade Log Labels: OFF
Enable CSV Export: OFF
Trade Label Vertical Offset: 0.5
Backtesting Date Range:
Start Date: January 1, 2018
End Date: December 31, 2069
Important Usage Notes
Default Configuration: The strategy operates in its most basic form with default settings - using only ZLEMA crossovers with volatility bands and volatility-based stop-losses. All advanced features must be manually enabled.
Stop-Loss Priority: If multiple stop-loss methods are enabled simultaneously, the strategy will use whichever condition is hit first. ATR-based stops override volatility-based stops when enabled.
Long-Only by Default: Short trading is disabled by default. Enable "Allow Short Trades" to trade both directions.
Performance Monitoring: Enable the floating stats table and trade log labels to visualize strategy performance during backtesting.
Exit Mechanisms: The strategy can exit trades through multiple methods: stop-loss hit, take-profit reached, trend reversal, or trailing stop activation. The trade log identifies which exit method was used.
Re-Entry Logic: When "Re-Enter on Long Trend" is enabled with ZLEMA trend confirmation, the strategy can take multiple long positions during extended uptrends as long as all entry conditions remain valid.
Capital Efficiency: Default setting uses 100% of equity per trade. Adjust "default_qty_value" to manage position sizing based on risk tolerance.
Realistic Backtesting: Strategy includes commission (0.1%) and slippage (3 ticks) to provide realistic performance expectations. These values should be adjusted based on your broker and market conditions.
Recommended Use Cases
Trending Markets: Best suited for markets with clear directional moves where trend-following strategies excel
Medium to Long-Term Trading: The default length of 70 makes this strategy more appropriate for swing trading rather than scalping
Risk-Conscious Traders: Multiple stop-loss options allow traders to customize risk management to their comfort level
Backtesting & Optimization: Comprehensive performance tracking features make this strategy ideal for testing different parameter combinations
Limitations & Considerations
Like all trend-following strategies, performance may suffer in choppy or ranging markets
Default 100% position sizing means full capital exposure per trade - consider reducing for conservative risk management
Higher length values (70+) reduce signal frequency but may improve signal quality
Multiple simultaneous risk management features may create conflicting exit signals
Past performance shown in backtests does not guarantee future results
Customization Tips
For more aggressive trading:
Reduce length parameter (minimum 70)
Decrease band multiplier for tighter bands
Enable short trades
Use lower profit target R:R ratios
For more conservative trading:
Increase length parameter
Enable ZLEMA trend confirmation
Use wider ATR stop-loss multipliers
Enable break-even stop-loss
Reduce position size from 100% default
For optimal choppy market performance:
Enable ZLEMA trend confirmation
Increase band multiplier
Use tighter profit targets
Avoid re-entry on trend continuation
Visual Elements
The strategy plots several elements on the chart:
ZLEMA line (color-coded by trend direction)
Upper and lower volatility bands
Long entry markers (green triangles)
Short entry markers (red triangles, when enabled)
Stop-loss levels (when positions are open)
Take-profit levels (when enabled and positions are open)
Trailing stop lines (when enabled and positions are open)
Optional ZLEMA trend markers (triangles at highs/lows)
Optional trade log labels showing complete trade information
Exit Reason Codes (for CSV Export)
When CSV export is enabled, exit reasons are coded as:
0 = Manual/Other
1 = Trailing Stop-Loss
2 = Profit Target
3 = ATR Stop-Loss
4 = Trend Change
Conclusion
Zero Lag Trend Signals V7 provides a robust framework for trend-following with extensive customization options. The strategy balances simplicity in its core logic with sophisticated risk management features, making it suitable for both beginner and advanced traders. By reducing moving average lag while incorporating volatility-based signals, it aims to capture trends earlier while managing risk through multiple configurable exit mechanisms.
The modular design allows traders to start with basic trend-following and progressively add complexity through ZLEMA confirmation, multiple stop-loss methods, and advanced exit strategies. Comprehensive performance tracking and export capabilities make this strategy an excellent tool for systematic testing and optimization.
Note: This strategy is provided for educational and backtesting purposes. All trading involves risk. Past performance does not guarantee future results. Always test thoroughly with paper trading before risking real capital, and adjust position sizing and risk parameters according to your risk tolerance and account size.
================================================================================
TAGS:
================================================================================
trend following, ZLEMA, zero lag, volatility bands, ATR stops, risk management, swing trading, momentum, trend confirmation, backtesting
================================================================================
CATEGORY:
================================================================================
Strategies
================================================================================
CHART SETUP RECOMMENDATIONS:
================================================================================
For optimal visualization when publishing:
Use a clean chart with no other indicators overlaid
Select a timeframe that shows multiple trade signals (4H or Daily recommended)
Choose a trending asset (crypto, forex major pairs, or trending stocks work well)
Show at least 6-12 months of data to demonstrate strategy across different market conditions
Enable the floating stats table to display key performance metrics
Ensure all indicator lines (ZLEMA, bands, stops) are clearly visible
Use the default chart type (candlesticks) - avoid Heikin Ashi, Renko, etc.
Make sure symbol information and timeframe are clearly visible
================================================================================
COMPLIANCE NOTES:
================================================================================
✅ Open-source publication with complete code visibility
✅ English-only title and description
✅ Detailed explanation of methodology and calculations
✅ Realistic commission (0.1%) and slippage (3 ticks) included
✅ All default parameters clearly documented
✅ Performance limitations and risks disclosed
✅ No unrealistic claims about performance
✅ No guaranteed results promised
✅ Appropriate for public library (original trend-following implementation with ZLEMA)
✅ Educational disclaimers included
✅ All features explained in detail
================================================================================

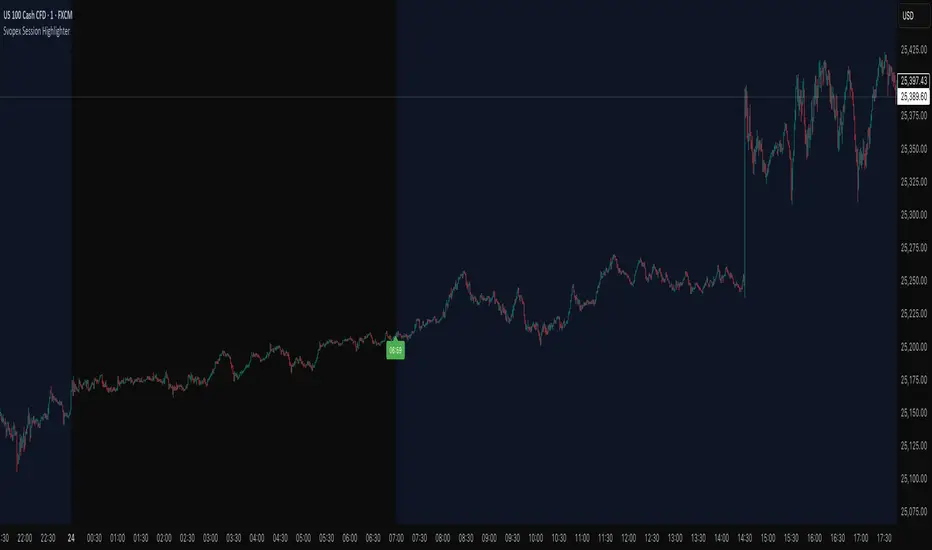
Svopex Session Highlighter# Session Highlighter
## Description
**Session Highlighter** is a powerful Pine Script indicator designed to visually identify and mark specific trading hours on your chart. This tool helps traders focus on their preferred trading sessions by highlighting the background during active hours and marking the session start with customizable visual markers.
## Key Features
- **📊 Session Background Highlighting**: Automatically shades the chart background during your defined trading hours (default: 7:00 - 23:00)
- **🎯 Smart Session Start Marker**: Places a marker on the last candle before session start, intelligently adapting to your timeframe:
- 1 Hour chart: Marker at 6:00
- 15 Minute chart: Marker at 6:45
- 5 Minute chart: Marker at 6:55
- 1 Minute chart: Marker at 6:59
- **🌍 Timezone Support**: Choose from multiple timezones (Europe/Prague, Europe/London, America/New_York, UTC)
- **🎨 5 Marker Styles**: Customize your session start indicator:
- Triangle
- Circle
- Diamond
- Label with time text
- Vertical line
- **⚙️ Fully Customizable**: Adjust start/end hours, timezone, and marker style through simple settings
## Settings
- **Start Hour**: Set your session start time (0-23)
- **End Hour**: Set your session end time (0-23)
- **Timezone**: Select your trading timezone
- **Marker Style**: Choose your preferred visual marker
## Use Cases
- Identify London/New York trading sessions
- Mark Asian session hours
- Highlight your personal trading windows
- Avoid trading during off-hours
- Perfect for day traders and scalpers
## Installation
1. Copy the Pine Script code
2. Open TradingView Pine Editor
3. Paste the code and click "Add to Chart"
4. Configure settings to match your trading schedule
Corpus Bollinger BandsThis is a copy of the build-in indicator, but as addition, it shows the distance between upper and lower band in percentage.
Volume+RSI IndicatorVolume+RSI Indicator - It’s a hybrid momentum indicator that combines Relative Strength Index (RSI) and Volume data. While RSI measures the strength and speed of price movement, volume measures the strength of participation. When combined, they can filter out false signals and confirm strong market moves.

Mohit-Fixed 4H & 15M Basesbase concept script
taught by Team ATM
A Trading Monk
-Nitin Makhija
-Akhilesh Pandey

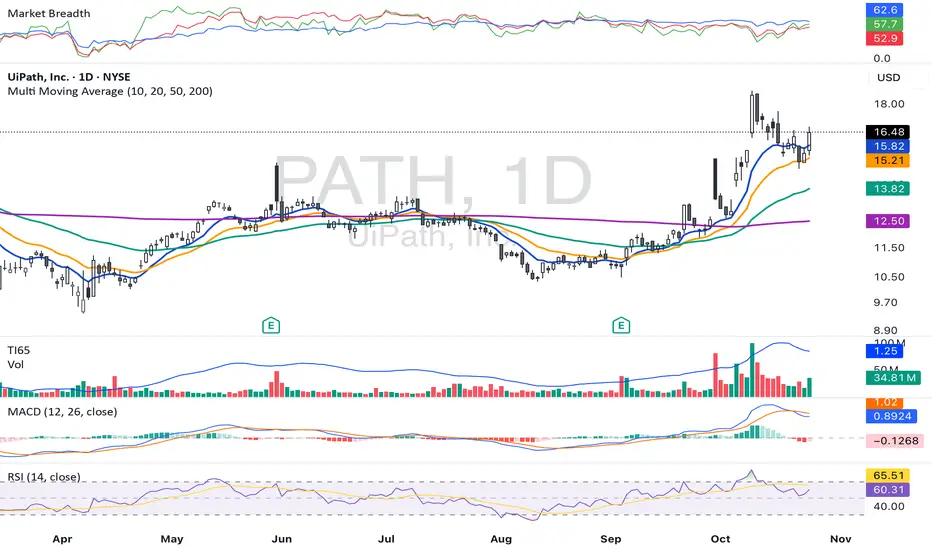
TI65**TI65 (Trend Intensity 65)** is a technical indicator designed to measure the strength and momentum of a trend over two distinct periods. It compares a short-term 7-period simple moving average (SMA) with a long-term 65-period SMA, producing a ratio that helps traders identify shifts in market momentum and trend direction.
- When the **TI65 value is greater than 1**, it indicates that the short-term moving average is above the long-term average, suggesting increasing momentum and a potentially bullish trend.
- When the **TI65 value drops below 1**, it signals weakening short-term momentum relative to the longer-term trend, often interpreted as a bearish or consolidating phase.
This indicator can be applied to both price and volume data, making it useful for identifying periods of strong volume surges or price movements. By observing changes in the TI65 ratio, traders can pinpoint low-risk entry points for trend-following strategies and quickly recognize periods of market transition.
TI65 is commonly used by momentum and breakout traders for screening strong candidates and confirming the sustainability of ongoing trends. It is simple, effective, and easily implemented via custom scripts on popular platforms like TradingView.
Volume TI65**TI65 (Trend Intensity 65)** is a technical indicator designed to measure the strength and momentum of a trend over two distinct periods. It compares a short-term 7-period simple moving average (SMA) with a long-term 65-period SMA, producing a ratio that helps traders identify shifts in market momentum and trend direction.
- When the **TI65 value is greater than 1**, it indicates that the short-term moving average is above the long-term average, suggesting increasing momentum and a potentially bullish trend.
- When the **TI65 value drops below 1**, it signals weakening short-term momentum relative to the longer-term trend, often interpreted as a bearish or consolidating phase.
This indicator can be applied to both price and volume data, making it useful for identifying periods of strong volume surges or price movements. By observing changes in the TI65 ratio, traders can pinpoint low-risk entry points for trend-following strategies and quickly recognize periods of market transition.
TI65 is commonly used by momentum and breakout traders for screening strong candidates and confirming the sustainability of ongoing trends. It is simple, effective, and easily implemented via custom scripts on popular platforms like TradingView.

Orb SignalLightThe ORB Signal Light is the free version of our flagship ORB Signal Pro indicator, designed for traders who use the Opening Range Breakout (ORB) as their core framework.
It automatically plots your session range, highlights breakout zones, and gives you the same clean visual foundation used by thousands of traders inside the Midas Touch community — without the advanced automation.
Key Features:
• Automatic ORB detection (5m / 15m adaptive)
• Clean breakout visualization and ORB bands
• Lightweight design for faster performance
Limitations:
The Crazy Horse Strategy, Dynamic Money Management, Setup Grading, and Automatic Stop Loss Logic are locked in this version and only available in ORB Signal Pro.
📍 Built for ORB Addicts. Powered by The Midas Touch Trading Group.
