INVITE-ONLY SCRIPT
Algotrdr
업데이트됨
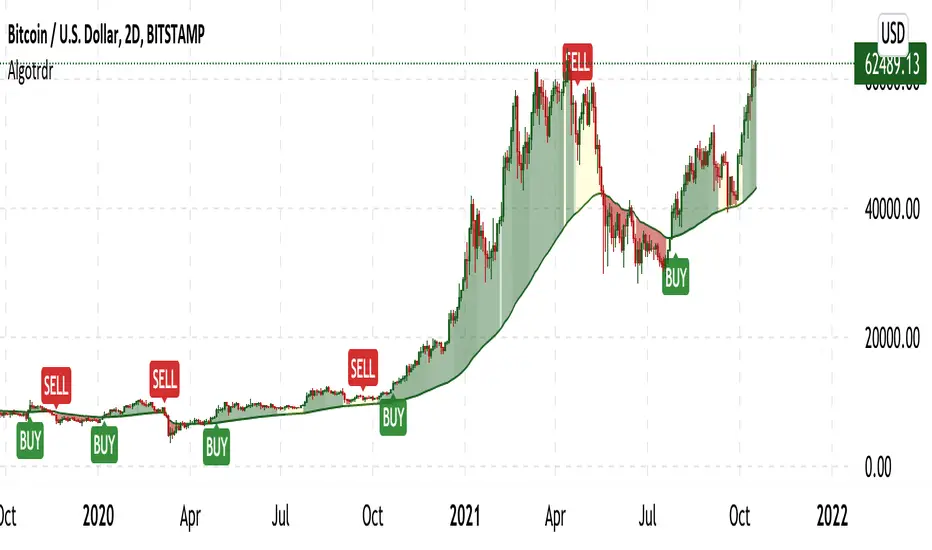
Algotrdr is an indicator designed around 3 features that work together on any asset, and on all timeframes, to help you achieve profitability while trading. Let’s take a look at what the three features are.
Signals
This indicator’s signal feature has a proprietary trend algo that uses our own trend strength feature, multiple moving averages, volume, candle data, and fibonacci levels. When a candle meets the base signal requirement it then uses a dynamic bullish and bearish score from our Volume Trend Strength algo to either plot the signal or wait for another. You can also do another cross check and only plot signals that align with a larger MA defined trend.
Volume Trend Strength
This feature tracks the current trend strength. It analyses Volume, VWMA, Mcginley Dynamic MA, differences in price, and recent retraces going against the trend to print bullish/bearish colors that get darker as the trend gets stronger. It also turns yellow when there isn’t enough volume supporting the current trend, which can indicate an upcoming trend reversal. This feature can be switched to appear as a color changing MA.
Take Profit / Pivot Levels
Prints Tradingview’s Fibonacci Pivot Points on the chart to help users identify potential take profit and S/R levels. I also added 4th and 5th S/Rs that use 1.618 and 2.618 levels.
Aside from the signals the other two features come with an off switch incase you don’t want to use either of them.
릴리즈 노트
Bull/bear score improvements.릴리즈 노트
Gave the volume trend strength ma line its own set of bold colors since the last set was difficult to see.릴리즈 노트
Volume trend strength improvements.릴리즈 노트
Changed default settings.릴리즈 노트
Changed the step of the signal sensitivity setting to add more control options at the request of a user릴리즈 노트
Fixed an issue and trend adjustments.릴리즈 노트
Added a new signal mode selector which allows users to tell the indicator to prioritize faster breakouts, or reduce choppy signal periods (safemode), or to continue using default mode.릴리즈 노트
Trend tweaks릴리즈 노트
Typo fix초대 전용 스크립트
이 스크립트에 대한 접근은 작성자가 승인한 사용자로 제한되며, 일반적으로 지불이 필요합니다. 즐겨찾기에 추가할 수 있지만 권한을 요청하고 작성자에게 권한을 받은 후에만 사용할 수 있습니다. 자세한 내용은 algotrdr_에게 문의하거나 아래의 작성자의 지시사항을 따르십시오.
트레이딩뷰는 스크립트 작성자를 100% 신뢰하고 스크립트 작동 원리를 이해하지 않는 한 스크립트 비용을 지불하고 사용하는 것을 권장하지 않습니다. 대부분의 경우 커뮤니티 스크립트에서 무료로 좋은 오픈소스 대안을 찾을 수 있습니다.
작성자 지시 사항
″Visit our website https://www.algotrdr.com/ to sign up.
차트에 이 스크립트를 사용하시겠습니까?
경고: 액세스를 요청하기 전에 읽어 보시기 바랍니다.
면책사항
이 정보와 게시물은 TradingView에서 제공하거나 보증하는 금융, 투자, 거래 또는 기타 유형의 조언이나 권고 사항을 의미하거나 구성하지 않습니다. 자세한 내용은 이용 약관을 참고하세요.