INVITE-ONLY SCRIPT
Cynotronic Divergence tool
업데이트됨

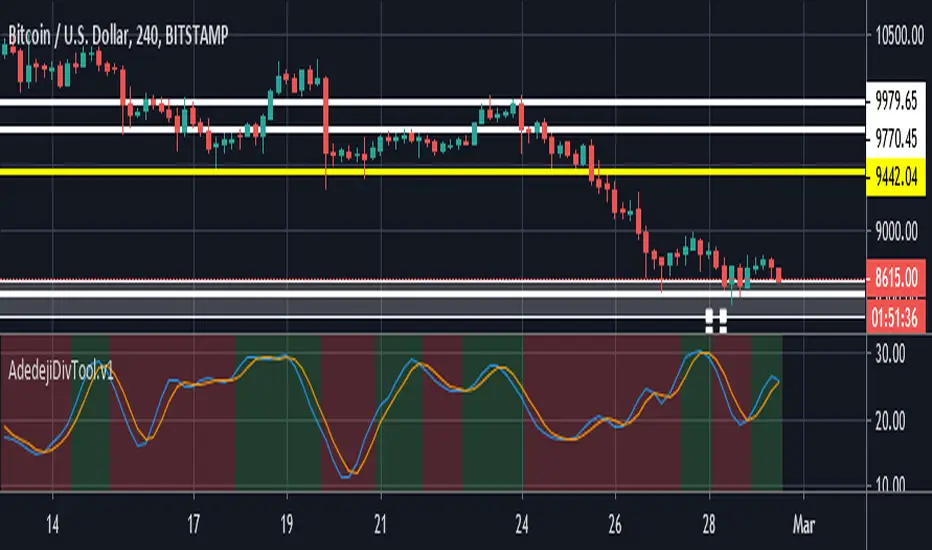
This tool was developed to accurately capture divergences. Back-testing has shown it's relatively more accurate in detecting all types of divergences (both hidden and regular).
The tool is NOT to be used in isolation; it's best used in conjunction with moving averages (preferably the 20 SMA);
How to use
1. The indicator background indicates bullish (green background color) or bearish (red background color) sentiments;
2. Indicator reversal is most bullish when price action is above MA;
3. Indicator reversal + Green background + price above MA is extremely Bullish ;
4. Indicator reversal + Green background + price below MA is indicative of an incoming distribution phase;
5. Indicator reversal + Red background + price above MA is slightly bullish ;
6. Indicator reversal + Red background + price above MA is indicative of an incoming accumulation period.
릴리즈 노트
Renamed and upgraded script to version 4초대 전용 스크립트
이 스크립트에 대한 접근은 작성자가 승인한 사용자로 제한되며, 일반적으로 지불이 필요합니다. 즐겨찾기에 추가할 수 있지만 권한을 요청하고 작성자에게 권한을 받은 후에만 사용할 수 있습니다. 자세한 내용은 ADEDEJI_EDGE에게 문의하거나 아래의 작성자의 지시사항을 따르십시오.
트레이딩뷰는 스크립트 작성자를 100% 신뢰하고 스크립트 작동 원리를 이해하지 않는 한 스크립트 비용을 지불하고 사용하는 것을 권장하지 않습니다. 대부분의 경우 커뮤니티 스크립트에서 무료로 좋은 오픈소스 대안을 찾을 수 있습니다.
작성자 지시 사항
″
차트에 이 스크립트를 사용하시겠습니까?
경고: 액세스를 요청하기 전에 읽어 보시기 바랍니다.
면책사항
이 정보와 게시물은 TradingView에서 제공하거나 보증하는 금융, 투자, 거래 또는 기타 유형의 조언이나 권고 사항을 의미하거나 구성하지 않습니다. 자세한 내용은 이용 약관을 참고하세요.