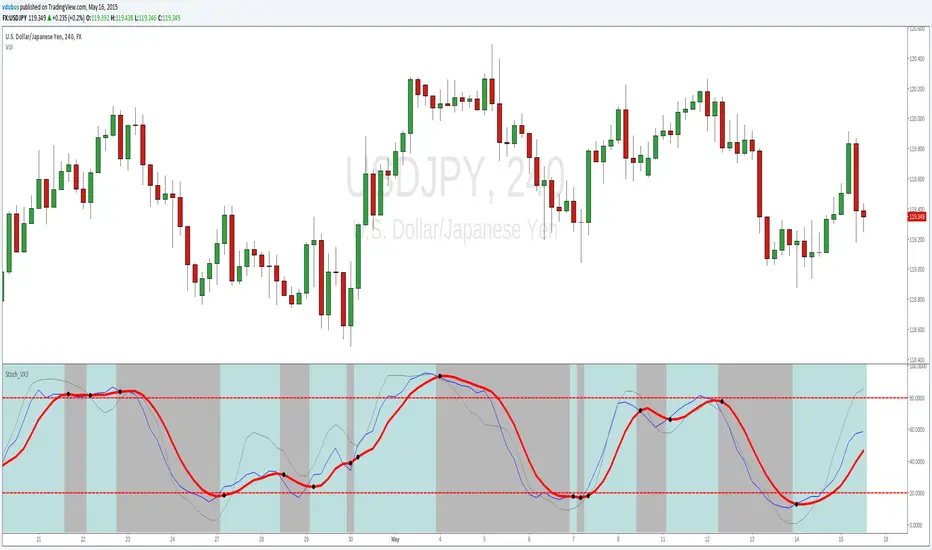
vdubus

Stoch_VX3

Stoch_VX3
Upgrade from Stoch_VX2
*Cross over markers
*Directional bgcolor indication

To run in line with the VX family / or stand alone :-
Baseline_VX1 MACD_VX1 Stoch_VX3 (this one)
/Strategy, line up all three, place your bets - Black or Green :)

오픈 소스 스크립트

이 스크립트의 오써는 참된 트레이딩뷰의 스피릿으로 이 스크립트를 오픈소스로 퍼블리쉬하여 트레이더들로 하여금 이해 및 검증할 수 있도록 하였습니다. 오써를 응원합니다! 스크립트를 무료로 쓸 수 있지만, 다른 퍼블리케이션에서 이 코드를 재사용하는 것은 하우스룰을 따릅니다. 님은 즐겨찾기로 이 스크립트를 차트에서 쓸 수 있습니다.

면책사항

이 정보와 게시물은 TradingView에서 제공하거나 보증하는 금융, 투자, 거래 또는 기타 유형의 조언이나 권고 사항을 의미하거나 구성하지 않습니다. 자세한 내용은 이용 약관을 참고하세요.

차트에 이 스크립트를 사용하시겠습니까?
study(title="Stoch_VX3", shorttitle="Stoch_VX3")
length = input(13, minval=1), smoothK = input(5, minval=1), smoothD = input(5, minval=1)
k = sma(stoch(close, high, low, length), smoothK)
d = sma(k, smoothD)
plot(k, color=blue, linewidth=1)
plot(d, color=red, linewidth=2)
h0 = hline(80, color=red, linewidth=2)
h1 = hline(20, color=red, linewidth=2)
fill(h0, h1, color=purple, transp=100)

//study(title="Stoch_VX1", shorttitle="Stoch_VX1", overlay=false)
//Modified script for binary Options trading ="Vdubus BinaryPro 2"
//.Original PPO Code Created by TheLark / Chris Moody
// Tops & Bottoms.
pctile = input(90, title="%")
wrnpctile = input(70, title=" %")
Short = input(0.3, title="LONG")
Long = input(0.5, title="SHORT")
lkbT = input(144,title="'PRO-Top")
lkbB = input(144,title="'PRO-Bottom")
//sl=input(true)
//swl=input(true)
//Laguerre PPO Code from TheLark
lag(g, p) =>
    L0 = (1 - g)*p+g*nz(L0[1])
    L1 = -g*L0+nz(L0[1])+g*nz(L1[1])
    L2 = -g*L1+nz(L1[1])+g*nz(L2[1])
    L3 = -g*L2+nz(L2[1])+g*nz(L3[1])
    f = (L0 + 2*L1 + 2*L2 + L3)/6
    f
lmas = lag(Short, hl2)
lmal = lag(Long, hl2)

pctileB = pctile * -1
wrnpctileB = wrnpctile * -1

//PPO Plot
ppoT = (lmas-lmal)/lmal*100
ppoB = (lmal - lmas)/lmal*100
//PercentRank of PPO 
pctRankT = percentrank(ppoT, lkbT)
pctRankB = percentrank(ppoB, lkbB) * -1
//Color Definition of Columns
colT = pctRankT >= pctile ? gray : pctRankT >= wrnpctile and pctRankT < pctile ? gray : gray
plot(pctRankT,title="Percentile Rank Columns", color=colT, style=line, linewidth=1)
//------------------------------------------
//plotshape(crossUp, title="Arror up", style=shape.triangleup, location=location.bottom, color=red)
//plotshape(crossDo, title="Arrow down",style=shape.triangledown, location=location.top, color=green)
//----------------
plot(cross(d, k) ? d : na, color=black, style = circles, linewidth = 4)
OutputSignal = k >= d ? 0 : 1
bgcolor(OutputSignal>0?#000000:#128E89, transp=80)
//===============================================