INVITE-ONLY SCRIPT
Stock Fair Value (SFV)
업데이트됨
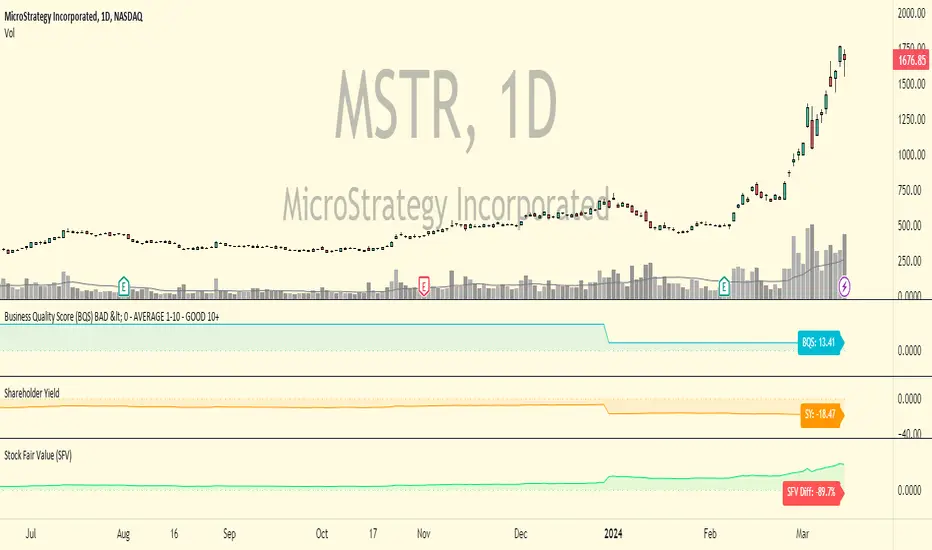
Stock Fair Value (SFV) is an indicator that displays an estimated fair value per share price for the business. It uses fundamental data including future consensus earnings estimates from Wall Street analysts, how fast the business is growing, and the balance sheet to come up with a number that approximates what a fair price would be to pay for the stock. In the top right hand corner of the Indicator is a highlighted box showing the % difference from the current price and the Fair Value price, if the box is green it means the stock is currently undervalued by that much % below the Fair Value price, if the box is red it means the stock is currently overvalued by that much % above the Fair Value price.
The indicator formula also uses the current market price as an input, as there is information about the business baked into the current stock price that isn't apparent in fundamental data that I believe deserves to affect the fair value price. This indicator uses my own unique formula, it is not a standard Discounted Cash flow (DCF) model nor is it based on any other published valuation formula or model. As this indicator uses fundamental data there isn't any changeable settings for the user.
This indicator is designed for stocks only and isn't applicable on other markets like forex, futures or crypto. It can be used on the daily, weekly or monthly time frames as the value doesn't change. It's designed to be part of an overall investment process for stock investors with medium to long term timeframes, it's not suited for short term trading like most valuation strategies.
Please note like any indicator it's not perfect as there's only so much input that can go into it, therefore use it as a rough guide as to what the fair value of a stock could be, there are of course many other factors that can and will affect what a fair price of a business should be. As value investors, we ideally want to buy safe quality growing businesses that are at least 30% below fair value then hold them until the stock trades back up to fair value or above. This indicator can help with what all value investors are trying to do, that is buy low and sell high. It can also be used to avoid expensive stocks as they may have more downside risk with less upside potential.
If you see the Stock Fair Value price make a drastic and significant move overnight that's because some new fundamental data has come into the system, it could be new consensus earnings estimates or a change in business growth rates that causes a sudden and significant shift in the calculated fair value.
As you can see from the chart above of Alibaba BABA the Stock Fair Value indicator is showing a current reading of $385.12 per share. At the current date of this writing, 11th January 2021, the current price of BABA is $132.19 which is 65.68% below the Stock Fair Value price of $385.12 and makes this stock one of the most undervalued large cap stocks listed on the New York Stock Exchange according to this indicator.
It's also worth noting that Charlie Munger, Vice Chairman of Berkshire Hathaway BRK.B and long term business partner of Warren Buffett, has recently been accumulating a large position in BABA which as a lifelong devotee of value investing suggests he sees great value in Alibaba at current prices just as the Stock Fair Value Indicator is suggesting too.
Other examples of large cap stocks that are currently significantly undervalued according to this indicator are;
AT&T T (40.72% undervalued)

Citigroup C (51.97% undervalued)

Fedex FDX (41.94% undervalued)

To get access to this indicator PM or email me to my address shown below.
Enjoy :)
Disclaimer: All my scripts and content are for educational purposes only. I'm not a financial advisor and do not give personal finance advice. Past performance is no guarantee of future performance. Please trade at your own risk.
The indicator formula also uses the current market price as an input, as there is information about the business baked into the current stock price that isn't apparent in fundamental data that I believe deserves to affect the fair value price. This indicator uses my own unique formula, it is not a standard Discounted Cash flow (DCF) model nor is it based on any other published valuation formula or model. As this indicator uses fundamental data there isn't any changeable settings for the user.
This indicator is designed for stocks only and isn't applicable on other markets like forex, futures or crypto. It can be used on the daily, weekly or monthly time frames as the value doesn't change. It's designed to be part of an overall investment process for stock investors with medium to long term timeframes, it's not suited for short term trading like most valuation strategies.
Please note like any indicator it's not perfect as there's only so much input that can go into it, therefore use it as a rough guide as to what the fair value of a stock could be, there are of course many other factors that can and will affect what a fair price of a business should be. As value investors, we ideally want to buy safe quality growing businesses that are at least 30% below fair value then hold them until the stock trades back up to fair value or above. This indicator can help with what all value investors are trying to do, that is buy low and sell high. It can also be used to avoid expensive stocks as they may have more downside risk with less upside potential.
If you see the Stock Fair Value price make a drastic and significant move overnight that's because some new fundamental data has come into the system, it could be new consensus earnings estimates or a change in business growth rates that causes a sudden and significant shift in the calculated fair value.
As you can see from the chart above of Alibaba
It's also worth noting that Charlie Munger, Vice Chairman of Berkshire Hathaway
Other examples of large cap stocks that are currently significantly undervalued according to this indicator are;
AT&T
Citigroup
Fedex
To get access to this indicator PM or email me to my address shown below.
Enjoy :)
Disclaimer: All my scripts and content are for educational purposes only. I'm not a financial advisor and do not give personal finance advice. Past performance is no guarantee of future performance. Please trade at your own risk.
릴리즈 노트
Improved visualization of the indicator to be easier to interpret. Nothing changed to the underlying indicator logic.초대 전용 스크립트
이 스크립트에 대한 접근은 작성자가 승인한 사용자로 제한되며, 일반적으로 지불이 필요합니다. 즐겨찾기에 추가할 수 있지만 권한을 요청하고 작성자에게 권한을 받은 후에만 사용할 수 있습니다. 자세한 내용은 Click-Capital에게 문의하거나 아래의 작성자의 지시사항을 따르십시오.
트레이딩뷰는 스크립트 작성자를 100% 신뢰하고 스크립트 작동 원리를 이해하지 않는 한 스크립트 비용을 지불하고 사용하는 것을 권장하지 않습니다. 대부분의 경우 커뮤니티 스크립트에서 무료로 좋은 오픈소스 대안을 찾을 수 있습니다.
작성자 지시 사항
″Contact me using TradingView private chat or email me at scale@greenstonedigital.com to request access to my invite-only scripts.
차트에 이 스크립트를 사용하시겠습니까?
경고: 액세스를 요청하기 전에 읽어 보시기 바랍니다.
면책사항
이 정보와 게시물은 TradingView에서 제공하거나 보증하는 금융, 투자, 거래 또는 기타 유형의 조언이나 권고 사항을 의미하거나 구성하지 않습니다. 자세한 내용은 이용 약관을 참고하세요.