INVITE-ONLY SCRIPT
TradeChartist TrendStalker - Market Bias Indicator
™TradeChartist TrendStalker helps visualise the Market Bias through 3 different Plot types and also displays Trend Direction Identifier (Green, Red and Orange square blocks) that can be connected to ™TradeChartist Plug and Trade to generate Trade entries, Targets, StopLoss and create alerts based on performance on the chosen timeframe. The three plot types are as below.
1. Market Bias Strength Oscillator
Plots true strength of Market Bias - helps determine if Market is Bullish/Bearish overall for the asset on chart TF.
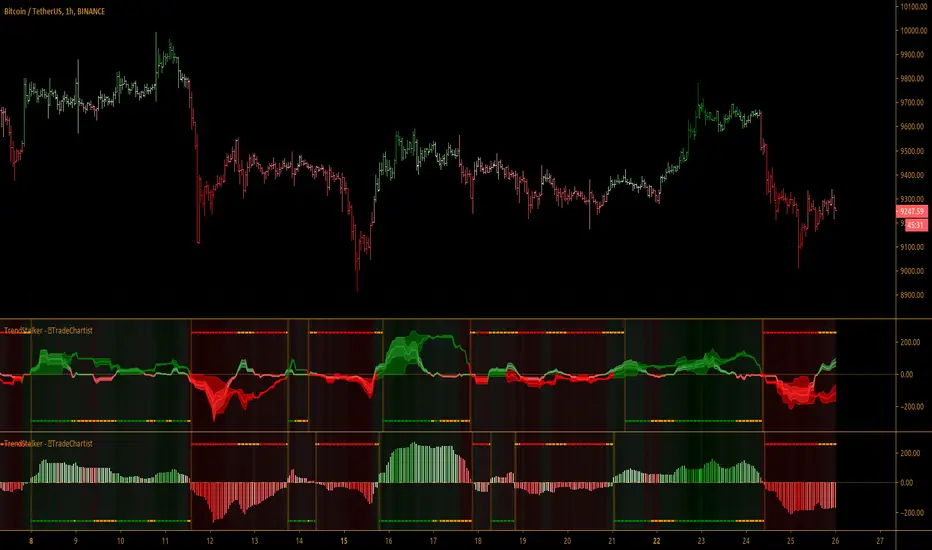
2. Market Bias Detector - Range Based
Displays TrendStalker plots stalking the Market Bias based on Range the Market is expecting to gain/lose from the asset on the Chart Timeframe. Change in Market Bias can be easily seen through the Convergence/Divergence of the TrendStalker plots.
3. Market Bias Detector - Price
Displays TrendStalker plots stalking the Market Bias based on Price for the asset on the Chart Timeframe. Change in Market Bias can be easily seen through the Convergence/Divergence of the TrendStalker plots.
Note: Trend Direction Identifier for Trade entries will be the same for Market Bias Detector plots, but differs from Market Bias Strength Oscillator.
Note: Trend Direction Identifier plots orange squares when its detecting a potential change in trend and its recommended to close some/most of the position or move Stop Loss to protect profit/reduce risk. Once the orange squares turn back into green/red squares, it signals safe re-entry.
Green squares - Bullish Trend
Red Squares - Bearish Trend
Orange Squares - Potential change in Market Bias
===================================================================================================================
TrendStalker Cool Extras
BTC 1hr Chart with TrendStalker Extras

===================================================================================================================
BTC 1hr Chart with TrendStalker connected to ™TradeChartist Plug and Trade

===================================================================================================================
This is not a free to use indicator. Get in touch with me (PM me directly if you would like trial access to test the indicator)
Premium Scripts - Trial access and Information
===================================================================================================================
1. Market Bias Strength Oscillator
Plots true strength of Market Bias - helps determine if Market is Bullish/Bearish overall for the asset on chart TF.
2. Market Bias Detector - Range Based
Displays TrendStalker plots stalking the Market Bias based on Range the Market is expecting to gain/lose from the asset on the Chart Timeframe. Change in Market Bias can be easily seen through the Convergence/Divergence of the TrendStalker plots.
3. Market Bias Detector - Price
Displays TrendStalker plots stalking the Market Bias based on Price for the asset on the Chart Timeframe. Change in Market Bias can be easily seen through the Convergence/Divergence of the TrendStalker plots.
Note: Trend Direction Identifier for Trade entries will be the same for Market Bias Detector plots, but differs from Market Bias Strength Oscillator.
Note: Trend Direction Identifier plots orange squares when its detecting a potential change in trend and its recommended to close some/most of the position or move Stop Loss to protect profit/reduce risk. Once the orange squares turn back into green/red squares, it signals safe re-entry.
Green squares - Bullish Trend
Red Squares - Bearish Trend
Orange Squares - Potential change in Market Bias
===================================================================================================================
TrendStalker Cool Extras
- Option to paint Background Color
- Option to enable Take Profit bar recommendation (Works only with Market Bias Strength Oscillator)
- Option to paint Price Bars using Market Bias Strength
- Alerts can be created for Long/Short Entry/Re-entry and Long/Short SOS signals (Orange squares). For all other alerts, ™TradeChartist Plug and Trade can be used.
BTC 1hr Chart with TrendStalker Extras
===================================================================================================================
BTC 1hr Chart with TrendStalker connected to ™TradeChartist Plug and Trade
===================================================================================================================
This is not a free to use indicator. Get in touch with me (PM me directly if you would like trial access to test the indicator)
Premium Scripts - Trial access and Information
- Trial access offered on all Premium scripts.
- PM me directly to request trial access to the scripts or for more information.
===================================================================================================================
초대 전용 스크립트
이 스크립트에 대한 접근은 작성자가 승인한 사용자로 제한되며, 일반적으로 지불이 필요합니다. 즐겨찾기에 추가할 수 있지만 권한을 요청하고 작성자에게 권한을 받은 후에만 사용할 수 있습니다. 자세한 내용은 TradeChartist에게 문의하거나 아래의 작성자의 지시사항을 따르십시오.
트레이딩뷰는 스크립트 작성자를 100% 신뢰하고 스크립트 작동 원리를 이해하지 않는 한 스크립트 비용을 지불하고 사용하는 것을 권장하지 않습니다. 대부분의 경우 커뮤니티 스크립트에서 무료로 좋은 오픈소스 대안을 찾을 수 있습니다.
작성자 지시 사항
″
차트에 이 스크립트를 사용하시겠습니까?
경고: 액세스를 요청하기 전에 읽어 보시기 바랍니다.
Get in touch with me if you would like access to my Premium scripts for a trial before deciding on lifetime access.
Telegram - @Trade_Chartist
Free Scripts - bit.ly/Free-Scripts
Telegram - @Trade_Chartist
Free Scripts - bit.ly/Free-Scripts
면책사항
이 정보와 게시물은 TradingView에서 제공하거나 보증하는 금융, 투자, 거래 또는 기타 유형의 조언이나 권고 사항을 의미하거나 구성하지 않습니다. 자세한 내용은 이용 약관을 참고하세요.