INVITE-ONLY SCRIPT
Trend Ladder Pro
Trend Ladder Pro
Detail Explanation:
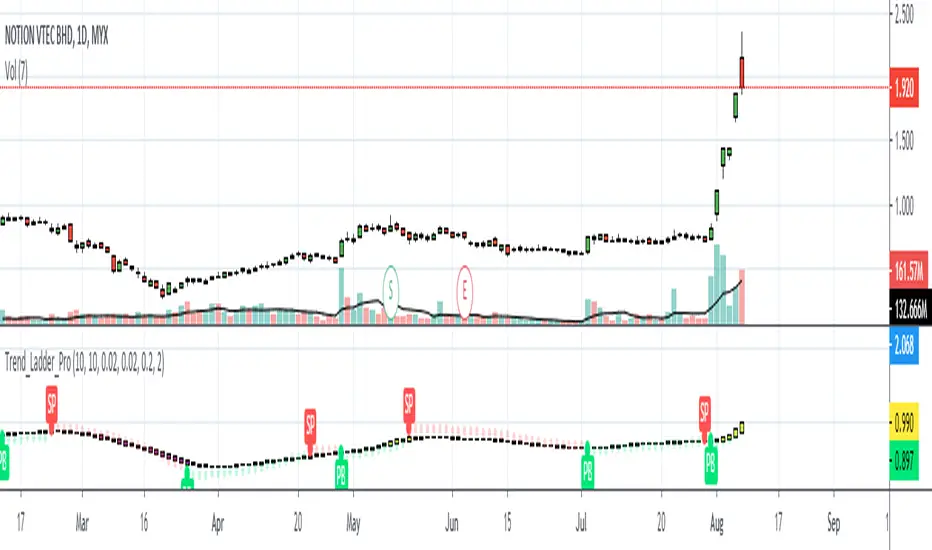
1. Purple Ladder
- Indicate that the market share is in a bearish trend. The ladder is heikin ashi candle which gives the smoother and uninterrupted downtrend.
2. Yellow Ladder
- Indicate that the market share is in a bullish trend. The ladder is heikin ashi candle which gives the smoother and uninterrupted uptrend.
3. Selling Pressure(SP)
- This signal shows that the selling pressure starting to take over the market shares. It appear when the first dot triggered to warn the traders from entering the market share or to take profit if they already holding position.
4. Pullback(PB)
- This signal shows that traders starting to have an interest in the market shares and having a pullback signal. It appear when the first dot triggered to alert the traders so that the market share can be put in the watchlist.
5. Red and Green Dot
- These dots are Parabolic SAR with the default setting but custom colors depending on the user interest. The dots are below as the price moving uptrend and above when the price downtrend. However, during sideways there will be a lot of false signals.
Contact me if you want to try the indicator.
Detail Explanation:
1. Purple Ladder
- Indicate that the market share is in a bearish trend. The ladder is heikin ashi candle which gives the smoother and uninterrupted downtrend.
2. Yellow Ladder
- Indicate that the market share is in a bullish trend. The ladder is heikin ashi candle which gives the smoother and uninterrupted uptrend.
3. Selling Pressure(SP)
- This signal shows that the selling pressure starting to take over the market shares. It appear when the first dot triggered to warn the traders from entering the market share or to take profit if they already holding position.
4. Pullback(PB)
- This signal shows that traders starting to have an interest in the market shares and having a pullback signal. It appear when the first dot triggered to alert the traders so that the market share can be put in the watchlist.
5. Red and Green Dot
- These dots are Parabolic SAR with the default setting but custom colors depending on the user interest. The dots are below as the price moving uptrend and above when the price downtrend. However, during sideways there will be a lot of false signals.
Contact me if you want to try the indicator.
초대 전용 스크립트
이 스크립트는 작성자가 승인한 사용자만 접근할 수 있습니다. 사용하려면 요청 후 승인을 받아야 하며, 일반적으로 결제 후에 허가가 부여됩니다. 자세한 내용은 아래 작성자의 안내를 따르거나 Trader_Cenonet에게 직접 문의하세요.
트레이딩뷰는 스크립트의 작동 방식을 충분히 이해하고 작성자를 완전히 신뢰하지 않는 이상, 해당 스크립트에 비용을 지불하거나 사용하는 것을 권장하지 않습니다. 커뮤니티 스크립트에서 무료 오픈소스 대안을 찾아보실 수도 있습니다.
작성자 지시 사항
면책사항
해당 정보와 게시물은 금융, 투자, 트레이딩 또는 기타 유형의 조언이나 권장 사항으로 간주되지 않으며, 트레이딩뷰에서 제공하거나 보증하는 것이 아닙니다. 자세한 내용은 이용 약관을 참조하세요.