INVITE-ONLY SCRIPT
Pivot Points with Fibonacci Daily
Pivot Points with Fibonacci
Daily only
What is a Pivot Point?
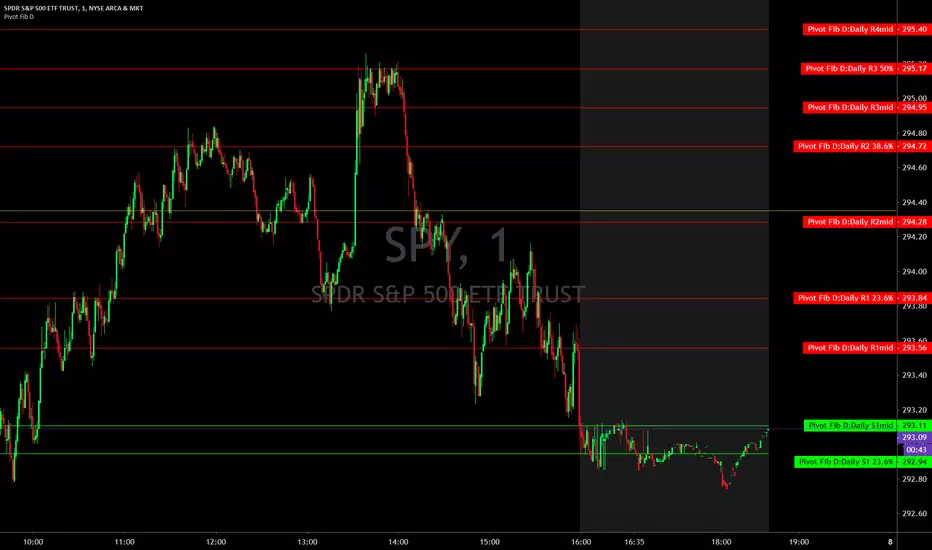
A pivot point is a technical analysis indicator, or calculations, used to determine the overall trend of the market over different time frames. The pivot point itself is simply the average of the high, low and closing prices from the previous trading day. On the subsequent day, trading above the pivot point is thought to indicate ongoing bullish sentiment, while trading below the pivot point indicates bearish sentiment.
The pivot point is the basis for the indicator, but it also includes other support and resistance levels that are projected based on the pivot point calculation. All these levels help traders see where the price could experience support or resistance. Similarly, if the price moves through these levels it lets the trader know the price is trending in that direction.
When the price of an asset is trading above the pivot point , it indicates the day is bullish or positive.
When the price of an asset is trading below the pivot point , it indicates the day is bearish or negative.
The indicator typically includes four additional levels: S1, S2, R1, and R2. These stand for support one and two, and resistance one and two.
Support and resistance one and two may cause reversals, but they may also be used to confirm the trend. For example, if the price is falling and moves below S1, it helps confirm the downtrend and indicate a possible continuation to S2.
This Script includes the Mid Pivot Points , All levels are based on Fibonacci
Daily only
What is a Pivot Point?
A pivot point is a technical analysis indicator, or calculations, used to determine the overall trend of the market over different time frames. The pivot point itself is simply the average of the high, low and closing prices from the previous trading day. On the subsequent day, trading above the pivot point is thought to indicate ongoing bullish sentiment, while trading below the pivot point indicates bearish sentiment.
The pivot point is the basis for the indicator, but it also includes other support and resistance levels that are projected based on the pivot point calculation. All these levels help traders see where the price could experience support or resistance. Similarly, if the price moves through these levels it lets the trader know the price is trending in that direction.
When the price of an asset is trading above the pivot point , it indicates the day is bullish or positive.
When the price of an asset is trading below the pivot point , it indicates the day is bearish or negative.
The indicator typically includes four additional levels: S1, S2, R1, and R2. These stand for support one and two, and resistance one and two.
Support and resistance one and two may cause reversals, but they may also be used to confirm the trend. For example, if the price is falling and moves below S1, it helps confirm the downtrend and indicate a possible continuation to S2.
This Script includes the Mid Pivot Points , All levels are based on Fibonacci
Follow us
Twitter twitter.com/darksidetrader
YouTube youtube.com/channel/UCAR8aMbticG9ePJrxeZ8mjw
Join Chat Room discord.gg/N4HSqJN96X
Website tradersofwallst.com
Live
9:00 AM EST to 2:30 PM EST
Twitter twitter.com/darksidetrader
YouTube youtube.com/channel/UCAR8aMbticG9ePJrxeZ8mjw
Join Chat Room discord.gg/N4HSqJN96X
Website tradersofwallst.com
Live
9:00 AM EST to 2:30 PM EST
초대 전용 스크립트
이 스크립트에 대한 접근은 작성자가 승인한 사용자로 제한되며, 일반적으로 지불이 필요합니다. 즐겨찾기에 추가할 수 있지만 권한을 요청하고 작성자에게 권한을 받은 후에만 사용할 수 있습니다. 자세한 내용은 DarkSideTrader에게 문의하거나 아래의 작성자의 지시사항을 따르십시오.
이것은 비공개 초대 전용 스크립트이며 스크립트 관리자에 의해 분석되지 않았음을 유의해 주세요. 이 스크립트가 하우스 룰을 준수하는지는 확인되지 않았습니다. TradingView는 스크립트를 100% 신뢰하고 스크립트의 작동 방식을 완전히 이해하지 않는 한, 스크립트에 비용을 지불하고 사용하는 것을 권장하지 않습니다. 많은 경우, 커뮤니티 스크립트에서 무료로 좋은 오픈 소스 대안을 찾을 수 있습니다.
차트에 이 스크립트를 사용하시겠습니까?
경고: 액세스를 요청하기 전에 읽어 보시기 바랍니다.
면책사항
이 정보와 게시물은 TradingView에서 제공하거나 보증하는 금융, 투자, 거래 또는 기타 유형의 조언이나 권고 사항을 의미하거나 구성하지 않습니다. 자세한 내용은 이용 약관을 참고하세요.