INVITE-ONLY SCRIPT
MRT, Barcolor for Trend Direction
This is an indicator that I use to identify trend.
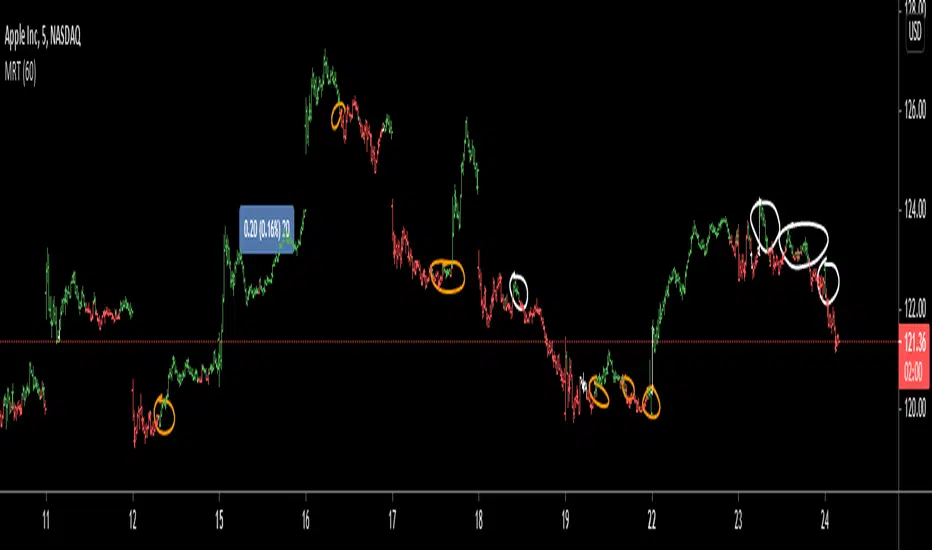
1- This is AAPL five minutes chart
A-Yellow Circles on the chart: Green is a Buy ,Red is a Sell
B-The white bars are transition to to the opposite color (red to green or vic versa ) it can serve as a warning of trend change.
C-As with any signal , sometimes it is a false signal (the white circles you see there). However, I would stick to the signal each time it changes.
2-The indicator uses previous highs and lows based on different time frames that you select. and calculate the winners and losers.
3-
A-I personally choose shorter time frame ( Hour, 30 minutes, even 1 minute) because I want faster signals to trade short term.
B-However, you can use it for longer term if you trade on longer time frames.
c-Whatever timeframe you use , choose lower for the candle; For example, if you use the One-Hour for the indicator then apply it to the five minutes chart. I use the 30 seconds chart.
4-This indicator will not guarantee any returns.
comment if you have any question.
1- This is
A-Yellow Circles on the chart: Green is a Buy ,Red is a Sell
B-The white bars are transition to to the opposite color (red to green or vic versa ) it can serve as a warning of trend change.
C-As with any signal , sometimes it is a false signal (the white circles you see there). However, I would stick to the signal each time it changes.
2-The indicator uses previous highs and lows based on different time frames that you select. and calculate the winners and losers.
3-
A-I personally choose shorter time frame ( Hour, 30 minutes, even 1 minute) because I want faster signals to trade short term.
B-However, you can use it for longer term if you trade on longer time frames.
c-Whatever timeframe you use , choose lower for the candle; For example, if you use the One-Hour for the indicator then apply it to the five minutes chart. I use the 30 seconds chart.
4-This indicator will not guarantee any returns.
comment if you have any question.
초대 전용 스크립트
이 스크립트는 작성자가 승인한 사용자만 접근할 수 있습니다. 사용하려면 요청을 보내고 승인을 받아야 합니다. 일반적으로 결제 후에 승인이 이루어집니다. 자세한 내용은 아래 작성자의 지침을 따르거나 malrawi에게 직접 문의하세요.
트레이딩뷰는 스크립트 작성자를 완전히 신뢰하고 스크립트 작동 방식을 이해하지 않는 한 스크립트 비용을 지불하거나 사용하지 않는 것을 권장하지 않습니다. 무료 오픈소스 대체 스크립트는 커뮤니티 스크립트에서 찾을 수 있습니다.
작성자 지시 사항
PM me on Tradingview messages for 3 months trial
면책사항
이 정보와 게시물은 TradingView에서 제공하거나 보증하는 금융, 투자, 거래 또는 기타 유형의 조언이나 권고 사항을 의미하거나 구성하지 않습니다. 자세한 내용은 이용 약관을 참고하세요.