INVITE-ONLY SCRIPT
NMA indicator
업데이트됨
Indicator “NMA”
Class: oscillator/trend deviations
Trading type: intraday
Time frame: 5 min – 60 min
Purpose: search for divergences
Level of aggressiveness: standard
Indicator «NMA» is used to determine the divergence points between current prices and their fair (theoretical, calculated) values. Presence of strong divergence is a signal that prices have entered overbought/oversold zone. This, in turn, is a basis for position opening opposite to the current price dynamics.
Structure of the indicator
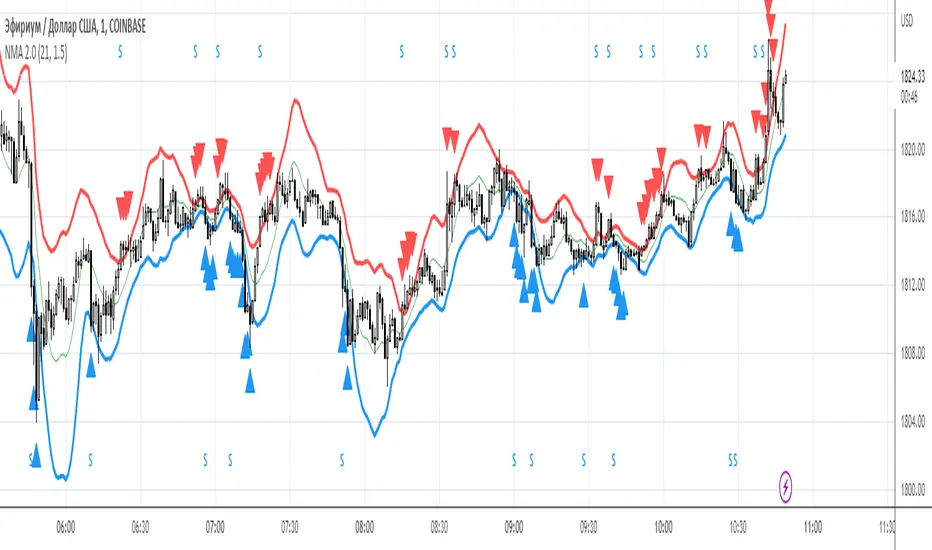
Indicator consists of colored lines and signal triangles, displayed on the chart.
- green line – shows current fair price. When current price is close to this line it means that there are no any significant divergences in the price dynamics. The green line is also a take-profit line – at this price positions should be closed;
- blue line – shows synthetic support level (analogue of the oversold zone), which is changing dynamically. From blue line “buy” trades are recommended;
- red line – shows synthetic resistance level (analogue of the overbought zone), which is changing dynamically. From red line “sell” trades are recommended;
To ease the trading process indicator displays on the chart “buy” and “sell” signals in form of blue/red triangles.
Input parameters of the indicator
To set up the indicator a number of input parameters are used:
- AR period (period of indicator, by default = 21) – is used to calculate fair (theoretical) prices based on linier auto regression model.
- Number of deviations (the number of standard deviations, by default = 1.5) – this parameter regulates the level of aggressiveness of the indicator. The bigger the parameter is the less signals are generated, but higher the quality if these signals is.
Rules of trading
Indicator can be used on the any time frame. For the intraday purposes periods from 5 min to 1 hour are recommended.
The general rules are as follows:
- if price crosses the blue line up-down – this is a signal that current price has fallen too much relatively its theoretical value (analogue of the oversold zone);
- if price crosses the red line down-up – this is a signal that current price has risen too much relatively its theoretical value (analogue of the overbought zone);
- “buy” from the blue line. For additional indication blue triangle is displayed on the chart;
- “sell” from the red line. For additional indication red triangle is displayed on the chart;
- take-profits are set near the green line
- stop-losses are not provided. Positions are closed after the opposite signal appears.
Class: oscillator/trend deviations
Trading type: intraday
Time frame: 5 min – 60 min
Purpose: search for divergences
Level of aggressiveness: standard
Indicator «NMA» is used to determine the divergence points between current prices and their fair (theoretical, calculated) values. Presence of strong divergence is a signal that prices have entered overbought/oversold zone. This, in turn, is a basis for position opening opposite to the current price dynamics.
Structure of the indicator
Indicator consists of colored lines and signal triangles, displayed on the chart.
- green line – shows current fair price. When current price is close to this line it means that there are no any significant divergences in the price dynamics. The green line is also a take-profit line – at this price positions should be closed;
- blue line – shows synthetic support level (analogue of the oversold zone), which is changing dynamically. From blue line “buy” trades are recommended;
- red line – shows synthetic resistance level (analogue of the overbought zone), which is changing dynamically. From red line “sell” trades are recommended;
To ease the trading process indicator displays on the chart “buy” and “sell” signals in form of blue/red triangles.
Input parameters of the indicator
To set up the indicator a number of input parameters are used:
- AR period (period of indicator, by default = 21) – is used to calculate fair (theoretical) prices based on linier auto regression model.
- Number of deviations (the number of standard deviations, by default = 1.5) – this parameter regulates the level of aggressiveness of the indicator. The bigger the parameter is the less signals are generated, but higher the quality if these signals is.
Rules of trading
Indicator can be used on the any time frame. For the intraday purposes periods from 5 min to 1 hour are recommended.
The general rules are as follows:
- if price crosses the blue line up-down – this is a signal that current price has fallen too much relatively its theoretical value (analogue of the oversold zone);
- if price crosses the red line down-up – this is a signal that current price has risen too much relatively its theoretical value (analogue of the overbought zone);
- “buy” from the blue line. For additional indication blue triangle is displayed on the chart;
- “sell” from the red line. For additional indication red triangle is displayed on the chart;
- take-profits are set near the green line
- stop-losses are not provided. Positions are closed after the opposite signal appears.
릴리즈 노트
Version with Alerts초대 전용 스크립트
이 스크립트에 대한 접근은 작성자가 승인한 사용자로 제한되며, 일반적으로 지불이 필요합니다. 즐겨찾기에 추가할 수 있지만 권한을 요청하고 작성자에게 권한을 받은 후에만 사용할 수 있습니다. 자세한 내용은 Trade24Fx에게 문의하거나 아래의 작성자의 지시사항을 따르십시오.
트레이딩뷰는 스크립트 작성자를 100% 신뢰하고 스크립트 작동 원리를 이해하지 않는 한 스크립트 비용을 지불하고 사용하는 것을 권장하지 않습니다. 대부분의 경우 커뮤니티 스크립트에서 무료로 좋은 오픈소스 대안을 찾을 수 있습니다.
작성자 지시 사항
″Please address all questions about this indicator (including access to it) in private messages.
차트에 이 스크립트를 사용하시겠습니까?
경고: 액세스를 요청하기 전에 읽어 보시기 바랍니다.
Авторские индикаторы
bit.ly/2oBvkHY
Больше информации на нашем ютьюб-канале
youtube.com/channel/UCYEOurJfasXWyYnrriGwsqQ
bit.ly/2oBvkHY
Больше информации на нашем ютьюб-канале
youtube.com/channel/UCYEOurJfasXWyYnrriGwsqQ
면책사항
이 정보와 게시물은 TradingView에서 제공하거나 보증하는 금융, 투자, 거래 또는 기타 유형의 조언이나 권고 사항을 의미하거나 구성하지 않습니다. 자세한 내용은 이용 약관을 참고하세요.