INVITE-ONLY SCRIPT
Price Volatility Index[Version No.1]
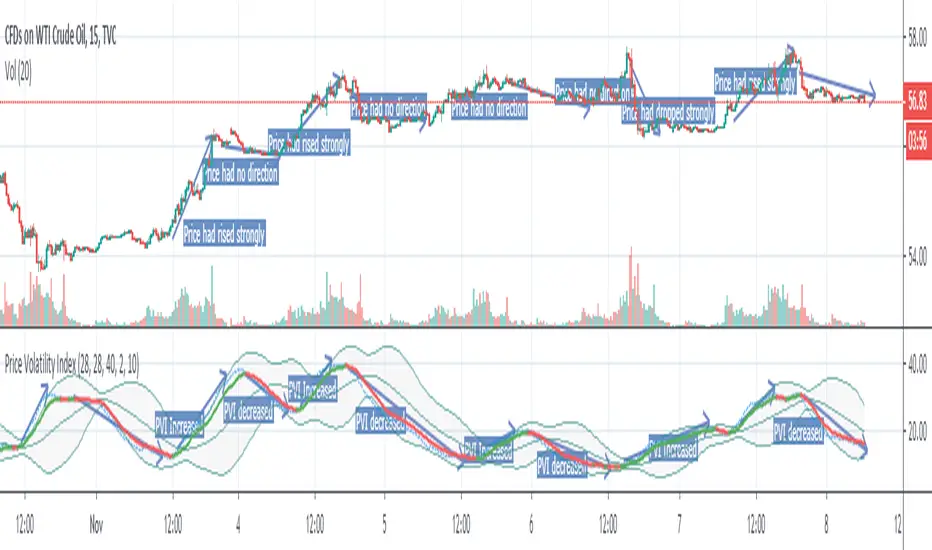
The 'Price Volatility index' indicator shows the amplitude of the price. It's called PVI.
If the PVI index rises, it means that the inertia of the price is sufficiently supplied.
The key point here is that the rise in the PVI index doesn't mean the price is going up, and the decline in the PVI index is not going to go down.
Shows the strength of the amplitude of the price regardless of directionality.
If the PVI indicator rises, it means that the amplitude of the price is strong, and if the PVI indicator decreases, the amplitude of the price will be weakened, indicating a directionless market.
"This indicator had reused indicator which name is 'CEMA'.
Reused indicator URL:[url= tradingview.com/u/mvtradeide...] tradingview.com/u/mvtradeide...
reused indicator 'CEMA' CODE
study(title="Color EMA", shorttitle="CEMA", overlay=true)
en = input (10, minval=1, Title="Length")
src = input(close, Title="Source")
out = ema ( src , le)
(out, color=out>out?green:out[out?red:blue, linewidth=2, transsp=0, Title="CEMA")
초대 전용 스크립트
이 스크립트에 대한 접근은 작성자가 승인한 사용자로 제한되며, 일반적으로 지불이 필요합니다. 즐겨찾기에 추가할 수 있지만 권한을 요청하고 작성자에게 권한을 받은 후에만 사용할 수 있습니다. 자세한 내용은 HAMTOOSA_ACADEMY에게 문의하거나 아래의 작성자의 지시사항을 따르십시오.
트레이딩뷰는 스크립트 작성자를 100% 신뢰하고 스크립트 작동 원리를 이해하지 않는 한 스크립트 비용을 지불하고 사용하는 것을 권장하지 않습니다. 대부분의 경우 커뮤니티 스크립트에서 무료로 좋은 오픈소스 대안을 찾을 수 있습니다.
차트에 이 스크립트를 사용하시겠습니까?
경고: 액세스를 요청하기 전에 읽어 보시기 바랍니다.
면책사항
이 정보와 게시물은 TradingView에서 제공하거나 보증하는 금융, 투자, 거래 또는 기타 유형의 조언이나 권고 사항을 의미하거나 구성하지 않습니다. 자세한 내용은 이용 약관을 참고하세요.