INVITE-ONLY SCRIPT
Boom Hunter XL Signals
업데이트됨

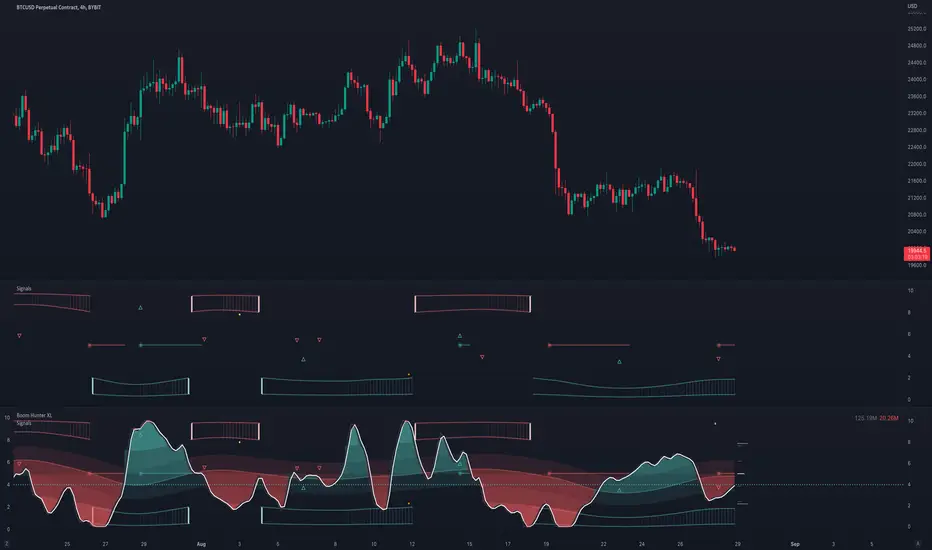
This is the alerts script for Boom Hunter XL and overlays on top of your chart or over your indicator. Alerts are provided for common Boom Hunter XL signals such as breakouts, first pullbacks, pumps, dumps, overbought and oversold.
Small Triangle = First pullback entry
Triangle = Breakout
Square = Overbought/Oversold
Circle = Pump and Dump
Bar Colors can be turned on in the settings. Colors are available for signalling pressure, channel pressure and trend.
Small Triangle = First pullback entry
Triangle = Breakout
Square = Overbought/Oversold
Circle = Pump and Dump
Bar Colors can be turned on in the settings. Colors are available for signalling pressure, channel pressure and trend.
릴리즈 노트
This update includes some big changes. This signals indicator is now designed to overlay on top of your Boom Hunter XL indicator. It still displays common signals and provides alerts but now with a clean chart. The signals are unicode which means you can change the icons to any unicode character in the style settings. There are some new additions such as SR bands and volatility signals. After loading this indicator simply drag it on top of Boom Hunter XLThe SR bands show the support and resistance bands for the current channel. We can visually see price action testing these channels. To trade within the channel look for the first pullback after price action gets rejected. You can adjust these bands to your chart in the settings, either add smoothing or change the sensitivity. Using a sensitivity of 20 will show more ups and downs while increasing this number will show stronger moves/trends.
As the strength of support and resistance increases bars will start to appear and get stronger with the SR. When the SR strength peaks candles appear. This shows price action testing SR. After the peak comes the release, Price action will either break the SR or get rejected but at this moment price action is free to move. In the screenshot below we can see how to track price action within the channel. Price action will get pulled to a support or resistance band and then bounce from it. The Candles show the squeeze and release.
The volatility signals use Digital Signal Processing (DSP) to push boom hunter in ways it should not be. To make a move the charts need to set it up. Using DSP we can pickup these big moves before it happens. You can either enter on the current pivot, wait for the next pivot, or wait until the end of the trend. This depends on your settings and time frame. There are 3 different frequencies you can adjust including thresholds. Alerts for these signals are coming on next update as well as some new signals and strategies (including entry and exit alerts). You will be able to use these for bot control.
릴리즈 노트
Minor update: Fixed bug with osc3 crossover alert and added all alert() function so now it is possible to set one alert to trigger every alert.릴리즈 노트
Minor update: Individual signals can be selected when creating alerts.릴리즈 노트
Added alerts for Volatility초대 전용 스크립트
이 스크립트에 대한 접근은 작성자가 승인한 사용자로 제한되며, 일반적으로 지불이 필요합니다. 즐겨찾기에 추가할 수 있지만 권한을 요청하고 작성자에게 권한을 받은 후에만 사용할 수 있습니다. 자세한 내용은 veryfid에게 문의하거나 아래의 작성자의 지시사항을 따르십시오.
TradingView does not suggest paying for a script and using it unless you 100% trust its author and understand how the script works. In many cases, you can find a good open-source alternative for free in our Community Scripts.
작성자 지시 사항
″To get access please visit my website https://www.boomhunter.net.
차트에 이 스크립트를 사용하시겠습니까?
경고: 액세스를 요청하기 전에 읽어 보시기 바랍니다.
면책사항
이 정보와 게시물은 TradingView에서 제공하거나 보증하는 금융, 투자, 거래 또는 기타 유형의 조언이나 권고 사항을 의미하거나 구성하지 않습니다. 자세한 내용은 이용 약관을 참고하세요.