INVITE-ONLY SCRIPT
Holy Pro Scalper
업데이트됨
What is Holy Pro Scalper
This is an advanced Indicator comprising of 21 Fuzzy and Quantitative logics running at once, which takes care of a lot of things for a trader, such as:
1> The current Dominant Trend
2> A Good Entry Point
3> A Way to Recover
4> A point to Stop
5> A Method to Book and Trail Profits
The Logics Includes Likes of :
> DonchainChannels, Supertrend, Bollinger Bands, ATR, Volume, RSI, Stoch etc....
The main Aim of this Indicator is to help traders trade with Rules, and make money if they follow it correctly.
Because One of the most important learnings which I have learnt in my professional trading career is creating a solid trading rule, which takes care of you even if the market is against you!
Another Problem the indicator tries to Solve Is What Securities to Trade for Tomorrow, Traders can plan before day trading and make the strategy towards the instrument in an effective way by just following a few rules, which are Easy to learn!
So Getting into how to Use this Indicator, (U can read the text and see the Video, shared below )
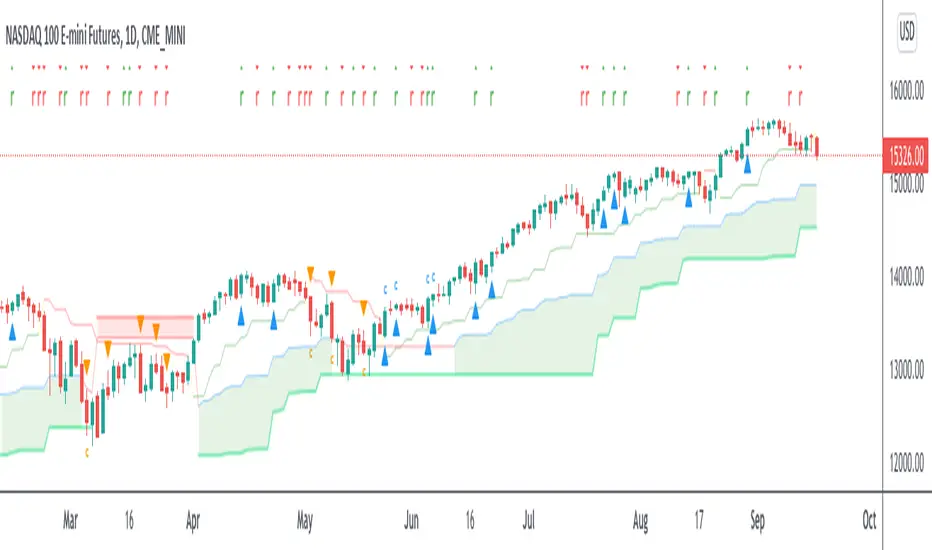
The indicator Comprises of 3 Basic UI Parts
1> Trading Signal
2> Recovery Signal
3> Dominant Trend
Trading Signal
This is represented by a triangle (both buy and sell) in (blue and Orange Colors)
There are two types of trading signals
a> Normal Trading Signal
b> Requiring Confirmation Trading Signal (“c” on top/ below of the Candle where signal Came)
The way to trade them is, one can straight away trade a normal Trading Signal, on the High of the Candle,
A “Requiring Confirmation Trading Signal” must be traded on the high of the Closing candle above the respective Signal candle, that is a trader must wait for the confirmation candle closing above the high of the Requiring Confirmation Trading Signal Candle.
Recovery Signal
A Recovery signal is a sign of recovery the system presents to a trader, when he/she have taken position/ trade as per the trading signal,
A recovery Signal helps to identify the time when its good to look for a recovery at breakeven cost or profit, if the recovery is broken,
There are two types of Recovery in the System,
1> Green Recovery
Which should be considered as a recovery when a Short Trade is active, it shows the intent of the market to change direction, so a trader while in short trade if he sees a green recovery anytime after his order is filled, he may plan to recover, if the recovery candle is broken, so he can wait to recover at breakeven cost or plan for a stop or book profit if market permits
2> Red Recovery
Which should be considered as a recovery when a Long Trade is active, it shows the intent of the market to change direction, so a trader while in long trade if he sees a red recovery anytime after his order is filled, he may plan to recover, if the recovery candle is broken, so he can wait to recover at breakeven cost or plan for a stop or book profit if market permits
Stopping Point and Dominant Trend
So Dominant Trend of the market is represented by a trend Following Line and Area
So if Area on Trend Following Line is Red, market’s dominant trend is Bear
And if Area on Trend Following Line is Green, market’s dominant trend is Bull
If a trader is in Trade the dominant trend line is considered as a stopping point, if market closes below it, in Long position, one can straight away take a Stop and May reverse trade according to thought process
Provision For Alerts
All Trading Signals
Bull Trading Signals
Bear Trading Signals
Green Recovery Signals
Red Recovery Signals
Video Examples


What Instruments and Time Frames It Works
Works on Every Liquid Instrument and Standard Timeframe (1m to 1month)
How Can u Get Access
Only do Private Message to me, use Comment Box for Constructive Comments
What If you Want To learn the Trading Setups of Profitability
Only do Private Message to me, use Comment Box for Constructive Comments
This is an advanced Indicator comprising of 21 Fuzzy and Quantitative logics running at once, which takes care of a lot of things for a trader, such as:
1> The current Dominant Trend
2> A Good Entry Point
3> A Way to Recover
4> A point to Stop
5> A Method to Book and Trail Profits
The Logics Includes Likes of :
> DonchainChannels, Supertrend, Bollinger Bands, ATR, Volume, RSI, Stoch etc....
The main Aim of this Indicator is to help traders trade with Rules, and make money if they follow it correctly.
Because One of the most important learnings which I have learnt in my professional trading career is creating a solid trading rule, which takes care of you even if the market is against you!
Another Problem the indicator tries to Solve Is What Securities to Trade for Tomorrow, Traders can plan before day trading and make the strategy towards the instrument in an effective way by just following a few rules, which are Easy to learn!
So Getting into how to Use this Indicator, (U can read the text and see the Video, shared below )
The indicator Comprises of 3 Basic UI Parts
1> Trading Signal
2> Recovery Signal
3> Dominant Trend
Trading Signal
This is represented by a triangle (both buy and sell) in (blue and Orange Colors)
There are two types of trading signals
a> Normal Trading Signal
b> Requiring Confirmation Trading Signal (“c” on top/ below of the Candle where signal Came)
The way to trade them is, one can straight away trade a normal Trading Signal, on the High of the Candle,
A “Requiring Confirmation Trading Signal” must be traded on the high of the Closing candle above the respective Signal candle, that is a trader must wait for the confirmation candle closing above the high of the Requiring Confirmation Trading Signal Candle.
Recovery Signal
A Recovery signal is a sign of recovery the system presents to a trader, when he/she have taken position/ trade as per the trading signal,
A recovery Signal helps to identify the time when its good to look for a recovery at breakeven cost or profit, if the recovery is broken,
There are two types of Recovery in the System,
1> Green Recovery
Which should be considered as a recovery when a Short Trade is active, it shows the intent of the market to change direction, so a trader while in short trade if he sees a green recovery anytime after his order is filled, he may plan to recover, if the recovery candle is broken, so he can wait to recover at breakeven cost or plan for a stop or book profit if market permits
2> Red Recovery
Which should be considered as a recovery when a Long Trade is active, it shows the intent of the market to change direction, so a trader while in long trade if he sees a red recovery anytime after his order is filled, he may plan to recover, if the recovery candle is broken, so he can wait to recover at breakeven cost or plan for a stop or book profit if market permits
Stopping Point and Dominant Trend
So Dominant Trend of the market is represented by a trend Following Line and Area
So if Area on Trend Following Line is Red, market’s dominant trend is Bear
And if Area on Trend Following Line is Green, market’s dominant trend is Bull
If a trader is in Trade the dominant trend line is considered as a stopping point, if market closes below it, in Long position, one can straight away take a Stop and May reverse trade according to thought process
Provision For Alerts
All Trading Signals
Bull Trading Signals
Bear Trading Signals
Green Recovery Signals
Red Recovery Signals
Video Examples
What Instruments and Time Frames It Works
Works on Every Liquid Instrument and Standard Timeframe (1m to 1month)
How Can u Get Access
Only do Private Message to me, use Comment Box for Constructive Comments
What If you Want To learn the Trading Setups of Profitability
Only do Private Message to me, use Comment Box for Constructive Comments
릴리즈 노트
For Those Who are Looking to demo evaluate itGo here
https://in.tradingview.com/chart/ow7CtAFN/
릴리즈 노트
Updates Regarding Multi Timeframe Scalping!Please take a look on this video if you would like to know how to scalp the markets
There is always a lot to learn, Keep growing!

초대 전용 스크립트
이 스크립트에 대한 접근은 작성자가 승인한 사용자로 제한되며, 일반적으로 지불이 필요합니다. 즐겨찾기에 추가할 수 있지만 권한을 요청하고 작성자에게 권한을 받은 후에만 사용할 수 있습니다. 자세한 내용은 Ankit_1618에게 문의하거나 아래의 작성자의 지시사항을 따르십시오.
트레이딩뷰는 스크립트 작성자를 100% 신뢰하고 스크립트 작동 원리를 이해하지 않는 한 스크립트 비용을 지불하고 사용하는 것을 권장하지 않습니다. 대부분의 경우 커뮤니티 스크립트에서 무료로 좋은 오픈소스 대안을 찾을 수 있습니다.
작성자 지시 사항
″Only do Private Message to me, use Comment Box for Constructive Comments ,
Please Mind this is a premium indicator!
차트에 이 스크립트를 사용하시겠습니까?
경고: 액세스를 요청하기 전에 읽어 보시기 바랍니다.
Get Ocs Ai Trader, Your personal Ai Trade Assistant here
→ ocstrader.com
→ bit.ly/ocs_ai_trader
About me
AlgoTrading Certification, (University of Oxford, Säid Business School)
PGP Research Analysis, (NISM)
Electronics Engineer
→ ocstrader.com
→ bit.ly/ocs_ai_trader
About me
AlgoTrading Certification, (University of Oxford, Säid Business School)
PGP Research Analysis, (NISM)
Electronics Engineer
면책사항
이 정보와 게시물은 TradingView에서 제공하거나 보증하는 금융, 투자, 거래 또는 기타 유형의 조언이나 권고 사항을 의미하거나 구성하지 않습니다. 자세한 내용은 이용 약관을 참고하세요.