INVITE-ONLY SCRIPT
TopTenAlgo 10. SQZMOM Algorithmic Strategy with Alerts & Signals
업데이트됨
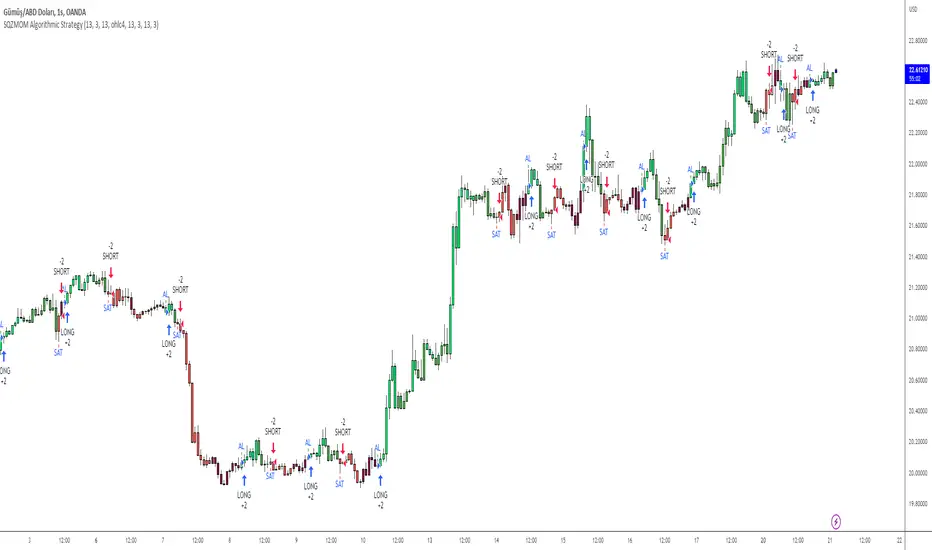
EN: This Algorithm is a derivative of John Carter's "TTM Squeeze" volatility indicator. Many strategists have taken the indicator on Tradingview with simple moving averages and have looked at the biggest mistake only by dealing with squeeze and exit processes to squeeze. But I used the algorithm to determine where the markets would actually explode. For example, instead of using SMAs , I tested them on the Linear Regression Curve using Volume Weighted Moving Averages and Hull MAs. This gave me the opportunity to develop a more responsive algorithm and identify where the actual explosion would occur. The Gray Circles in the midline show that the market is entering a new jam (in the Bollinger Bands and Keltner Channel). This means low volatility , the market prepares itself for an explosive move (up or down). White Circles mean that it is about to get out of the jam. The Blue Circles, which no one can calculate, now inform that the exit is no longer jammed and that the explosion has taken place.
Mr. Carter recommends that you wait until the first gray after a gray cross and take a position in the momentum direction (for example, if the momentum value is above zero, relax). Exit position when the momentum changes (increase or decrease, this is indicated by a color change). In this algorithm, I tried to achieve good entry points using an additional indicator such as ADX and WaveTrend. To draw the histogram, I used a different method based on Linear Regression . Mr.Carter uses a simple momentum indicator. Strategy, alarms and signals have been added to the indicator so that you can optimize in algorithmic trading.
In summary, this algorithm is a strict algorithm in which additional 4-5 indicators are blended. Conveniences for Everyone ...

TR: Bu Algoritma John Carter'ın "TTM Squeeze" volatilite göstergesinin bir türevidir. Bir çok stratejist Tradingview' de gösterge' yi basit hareketli ortalamalarla ele almış ve en büyük hatayı sadece sıkışma ve sıkışmadan çıkış süreçlerini ele alarak bakmışlardır. Fakat ben algoritmayı piyasaların asıl patlama yapacağı yeri tespit etmek için kullandım. Örneğin SMA' ları kullanmak yerine Hacim Ağırlıklı Hareketli Ortalamaları ve Hull MA' ları kullanarak onları Linerar Regresyon Eğrisinde stress testine tabi tuttum. Buda bana daha duyarlı bir algoritma geliştirmem ve asıl patlamanın olacağı yerleri tespit etmem için fırsat verdi. Orta hattaki Gri Daireler, piyasanın yeni bir sıkışmaya girdiğini gösteriyor ( Bollinger Bantları ve Keltner Kanalı'nda). Bu, düşük volatilite anlamına gelir, piyasa kendisini patlayıcı bir harekete hazırlar (yukarı veya aşağı). Beyaz Daireler ise sıkışmadan çıkmak üzere olduğu anlamına gelir. Hiç kimsenin hesap edemediği Mavi Daireler ise artık sıkışmadan çıkıldığını ve patlamanın gerçekleştiğini haber verir.
Mr.Carter, gri bir çarpı işaretinden sonra ilk griye kadar beklemenizi ve momentum yönünde bir pozisyon almanızı önerir (örneğin, momentum değeri sıfırın üstünde ise, rahat olun). Momentum değiştiğinde pozisyondan çıkın (artırma veya azaltma, bunu o bir renk değişikliği ile belirtilir). Bu algoritmada ben, ADX ve WaveTrend gibi ek bir gösterge kullanarak iyi giriş noktalarıelde etmeye çalıştım. Histogramı çizmek için ise Linear Regresyon tabanlı farklı bir yöntem kullandım. Mr.Carter basit bir momentum göstergesi kullanır. Göstergeye algoritmik işlemlerde optimizasyon yapabilmeniz için strateji, alrmlar ve sinyaller eklenmiştir.
Özetle bu algoritma ek 4-5 göstergenin harmanlandığı sıkı bir algoritmadır. Herkese Kolaylıklar dilerim...
Mr. Carter recommends that you wait until the first gray after a gray cross and take a position in the momentum direction (for example, if the momentum value is above zero, relax). Exit position when the momentum changes (increase or decrease, this is indicated by a color change). In this algorithm, I tried to achieve good entry points using an additional indicator such as ADX and WaveTrend. To draw the histogram, I used a different method based on Linear Regression . Mr.Carter uses a simple momentum indicator. Strategy, alarms and signals have been added to the indicator so that you can optimize in algorithmic trading.
In summary, this algorithm is a strict algorithm in which additional 4-5 indicators are blended. Conveniences for Everyone ...
TR: Bu Algoritma John Carter'ın "TTM Squeeze" volatilite göstergesinin bir türevidir. Bir çok stratejist Tradingview' de gösterge' yi basit hareketli ortalamalarla ele almış ve en büyük hatayı sadece sıkışma ve sıkışmadan çıkış süreçlerini ele alarak bakmışlardır. Fakat ben algoritmayı piyasaların asıl patlama yapacağı yeri tespit etmek için kullandım. Örneğin SMA' ları kullanmak yerine Hacim Ağırlıklı Hareketli Ortalamaları ve Hull MA' ları kullanarak onları Linerar Regresyon Eğrisinde stress testine tabi tuttum. Buda bana daha duyarlı bir algoritma geliştirmem ve asıl patlamanın olacağı yerleri tespit etmem için fırsat verdi. Orta hattaki Gri Daireler, piyasanın yeni bir sıkışmaya girdiğini gösteriyor ( Bollinger Bantları ve Keltner Kanalı'nda). Bu, düşük volatilite anlamına gelir, piyasa kendisini patlayıcı bir harekete hazırlar (yukarı veya aşağı). Beyaz Daireler ise sıkışmadan çıkmak üzere olduğu anlamına gelir. Hiç kimsenin hesap edemediği Mavi Daireler ise artık sıkışmadan çıkıldığını ve patlamanın gerçekleştiğini haber verir.
Mr.Carter, gri bir çarpı işaretinden sonra ilk griye kadar beklemenizi ve momentum yönünde bir pozisyon almanızı önerir (örneğin, momentum değeri sıfırın üstünde ise, rahat olun). Momentum değiştiğinde pozisyondan çıkın (artırma veya azaltma, bunu o bir renk değişikliği ile belirtilir). Bu algoritmada ben, ADX ve WaveTrend gibi ek bir gösterge kullanarak iyi giriş noktalarıelde etmeye çalıştım. Histogramı çizmek için ise Linear Regresyon tabanlı farklı bir yöntem kullandım. Mr.Carter basit bir momentum göstergesi kullanır. Göstergeye algoritmik işlemlerde optimizasyon yapabilmeniz için strateji, alrmlar ve sinyaller eklenmiştir.
Özetle bu algoritma ek 4-5 göstergenin harmanlandığı sıkı bir algoritmadır. Herkese Kolaylıklar dilerim...
릴리즈 노트
Changed the Input Values to better represent it task. And Pine Script has been updated to v5.초대 전용 스크립트
이 스크립트에 대한 접근은 작성자가 승인한 사용자로 제한되며, 일반적으로 지불이 필요합니다. 즐겨찾기에 추가할 수 있지만 권한을 요청하고 작성자에게 권한을 받은 후에만 사용할 수 있습니다. 자세한 내용은 nFinans에게 문의하거나 아래의 작성자의 지시사항을 따르십시오.
트레이딩뷰는 스크립트 작성자를 100% 신뢰하고 스크립트 작동 원리를 이해하지 않는 한 스크립트 비용을 지불하고 사용하는 것을 권장하지 않습니다. 대부분의 경우 커뮤니티 스크립트에서 무료로 좋은 오픈소스 대안을 찾을 수 있습니다.
작성자 지시 사항
″Access to this script is limited to users authorized by me and usually requires payment. You will only be able to use it after asking permission from me and purchasing it. For more information send a private message to premiumalgodev@gmail.com
차트에 이 스크립트를 사용하시겠습니까?
경고: 액세스를 요청하기 전에 읽어 보시기 바랍니다.
Buy & Look Into Algo & Indicator List: bit.ly/40i1Jqk
Join Our Discord Community: discord.com/invite/c9bwqrKxm3
Indicators Tuttorial:
youtube.com/watch?v=rSwz1ISU9r0&list=PL6r4M5EOm1fMCJZxE7RDafk-DnrxLJY5y
Join Our Discord Community: discord.com/invite/c9bwqrKxm3
Indicators Tuttorial:
youtube.com/watch?v=rSwz1ISU9r0&list=PL6r4M5EOm1fMCJZxE7RDafk-DnrxLJY5y
면책사항
이 정보와 게시물은 TradingView에서 제공하거나 보증하는 금융, 투자, 거래 또는 기타 유형의 조언이나 권고 사항을 의미하거나 구성하지 않습니다. 자세한 내용은 이용 약관을 참고하세요.