OPEN-SOURCE SCRIPT
Constantly Applied Pressure Index (CAP index)
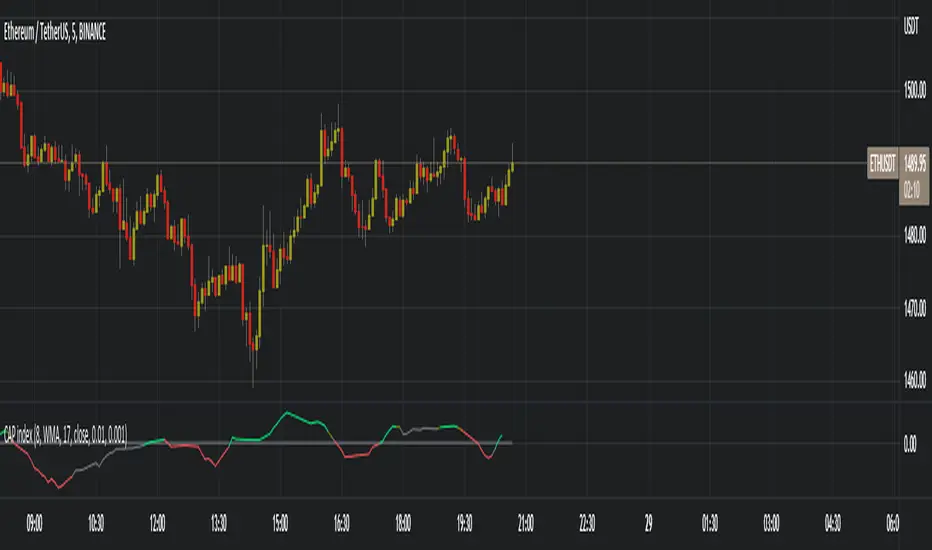
The CAP index is my own homebrew trend indicator made to help traders see the slightly bigger picture, because we all know that as traders we can tend to hyper-focus in on a few candles and end up making a stupid trade because of it, or is it just me ? On a more serious note this indicator helps you find the short term trend by looking at bullish and bearish candles comparing their sizes, volumes and predominance.
The indicator has many technical settings for you to play around with but on the defaults it will render in a few colors which I will explain. Gray means no trend or that the current trend has died, bright green or red mean that a trend has formed, is playing out or that there is a good change a strong trend is about to form. Obviously green means bullish and red means bearish. Finally darker green and red mean a weak or weakening trend, this serves as a warning if you are about to take a trade in the trend direction.
The way I recommend using the indicator is the same way many trend indicators are used, as a filter to either a different indicator creating trading signals or to your own strategy's signals. I would add an illustration here that I prepared but I cannot because of tradingview's reputation rules
오픈 소스 스크립트
트레이딩뷰의 진정한 정신에 따라, 이 스크립트의 작성자는 이를 오픈소스로 공개하여 트레이더들이 기능을 검토하고 검증할 수 있도록 했습니다. 작성자에게 찬사를 보냅니다! 이 코드는 무료로 사용할 수 있지만, 코드를 재게시하는 경우 하우스 룰이 적용된다는 점을 기억하세요.
면책사항
해당 정보와 게시물은 금융, 투자, 트레이딩 또는 기타 유형의 조언이나 권장 사항으로 간주되지 않으며, 트레이딩뷰에서 제공하거나 보증하는 것이 아닙니다. 자세한 내용은 이용 약관을 참조하세요.
오픈 소스 스크립트
트레이딩뷰의 진정한 정신에 따라, 이 스크립트의 작성자는 이를 오픈소스로 공개하여 트레이더들이 기능을 검토하고 검증할 수 있도록 했습니다. 작성자에게 찬사를 보냅니다! 이 코드는 무료로 사용할 수 있지만, 코드를 재게시하는 경우 하우스 룰이 적용된다는 점을 기억하세요.
면책사항
해당 정보와 게시물은 금융, 투자, 트레이딩 또는 기타 유형의 조언이나 권장 사항으로 간주되지 않으며, 트레이딩뷰에서 제공하거나 보증하는 것이 아닙니다. 자세한 내용은 이용 약관을 참조하세요.