INVITE-ONLY SCRIPT
REDWOOD MTF Stochastic RSI
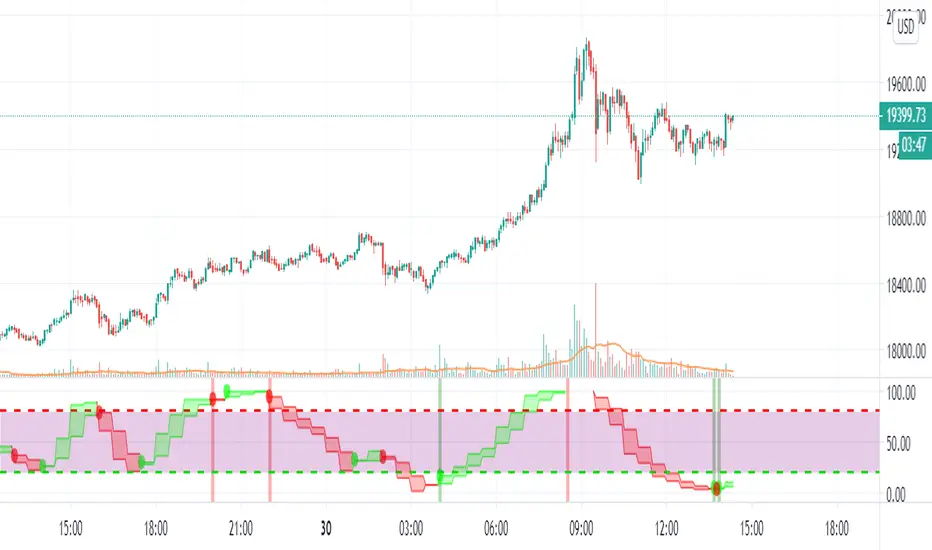
This MTF Stochastic RSI is custom made to help give you an edge while trading.
As you see the MTF Stochastic RSI is colored depending on the trend and if "K" is above or below "D".
This indicator shows the crossover or crossunder of these values with the colored circles that
are plotted. This can be a very useful indicator to show you Oversold or Overbought areas of an
asset, giving you ideas of when to take profit or enter a new trade.
For more information on Stochastic RSI in general (for reference) Please see the detailed
description here : https://www.investopedia.com/terms/s/stochrsi.asp#:~:text=The%20Stochastic%20RSI%20(StochRSI)%20is,than%20to%20standard%20price%20data.
This Stochastic RSI is a Multi Time frame Stochastic, meaning it can show you higher or lower
timeframes of the Stochastic RSI no matter what current time frame your chart is on. This is
applied in the settings of the indicator by default, with a default timeframe of 1hr.
You can easily change back to the current time frame by checking the box "Use current Timeframe?".
This can be very useful to get into a trend early, entering or exiting on low time frame bars while
seeing the live Long time frame Stoch RSI.
All inputs of K, D, RSIlength, Stochlength, Overbought and Oversold areas can be customized to
your liking. By default these run on the recommended Stoch RSI settings and values on tradingview
with overbought and oversold areas at 80 & 20.
There are inputs that will color the bars depending on if the Stoch is showing Overbought(red) or
Oversold(lime) regions, and a separate color setting that colors bars with the color of the Stoch
itself, showing when K is over D and vise versa.
For trading with this indicator, it works very well with a indicator confirming the position or
potential change that is happening, I recommend the MacD. Specifically, the REDWOOD MTF MacD.
When K crosses D and is showing the Stoch green or lime, this is when to take a Long or buy
position.
When D crosses K and is showing the Stoch red, this is when to take a short or sell position.
To filter out false crosses or trades, this is where I recommend the MacD, taking trades on the
Stoch when the MacD is showing signs of a reversal or crosses itself. These provide the strongest
signals and buy and sell positions.
This is recommended as a swing indicator, but can be used for scalping at your own risk.
As for recommended time frames to use for the MTF settings, I would stick to longer timeframes to
show the overall trend. With that being said, it can be used on shorter timeframes as well and
works good. I would sick to the 1hr or 4hr timeframes, and for lower I recommend the 15min or
30min timeframes. The lower you go the more signals will be provided, but with that lots more
false signals will show as well if the asset is volatile.
All settings, colors, and plots can be customized, and all are labeled to make it easy for you.
Alerts for each setting will be added in the future for simplicity, as of now the alerts can be
made as usual, having the indicator plot K crossing the indicator plot D, telling you of a change
in the Stoch.
This can be a very useful indicator, and I'm sure some may find settings that work even better
than the default or recommended settings.
This indicator works on all markets, forex, cryptocurrency, and stocks.
For access to this and all indicators available, please DM me here or See profile. We are here
to help each other succeed! The more one succeeds the more we all succeed! We are all in this
together and every person deserves to be financially independent and confident when taking trades
and investing.
초대 전용 스크립트
이 스크립트에 대한 접근은 작성자가 승인한 사용자로 제한되며, 일반적으로 지불이 필요합니다. 즐겨찾기에 추가할 수 있지만 권한을 요청하고 작성자에게 권한을 받은 후에만 사용할 수 있습니다. 자세한 내용은 REDW00D에게 문의하거나 아래의 작성자의 지시사항을 따르십시오.
트레이딩뷰는 스크립트 작성자를 100% 신뢰하고 스크립트 작동 원리를 이해하지 않는 한 스크립트 비용을 지불하고 사용하는 것을 권장하지 않습니다. 대부분의 경우 커뮤니티 스크립트에서 무료로 좋은 오픈소스 대안을 찾을 수 있습니다.
작성자 지시 사항
″
차트에 이 스크립트를 사용하시겠습니까?
경고: 액세스를 요청하기 전에 읽어 보시기 바랍니다.
면책사항
이 정보와 게시물은 TradingView에서 제공하거나 보증하는 금융, 투자, 거래 또는 기타 유형의 조언이나 권고 사항을 의미하거나 구성하지 않습니다. 자세한 내용은 이용 약관을 참고하세요.