INVITE-ONLY SCRIPT
SB Master Chart
업데이트됨
A free 14 day trial is available upon request.
This is the SB Master Chart. I have combined my Swing Traders Serenity filter to this indicator as a filter for even better trade entries and exits.
SB Master Chart was designed with a minimalist appearance, but is able to provide a trader with all the information he needs at a glance to make informed trading decisions. This chart utilizes the alert() function so the trader can be alerted even while away from a computer to a potential trade opportunity.
The visual display of the chart utilizes the following indicators.
The alert condition utilizes a combination of the above to form its overbought/oversold conditions.
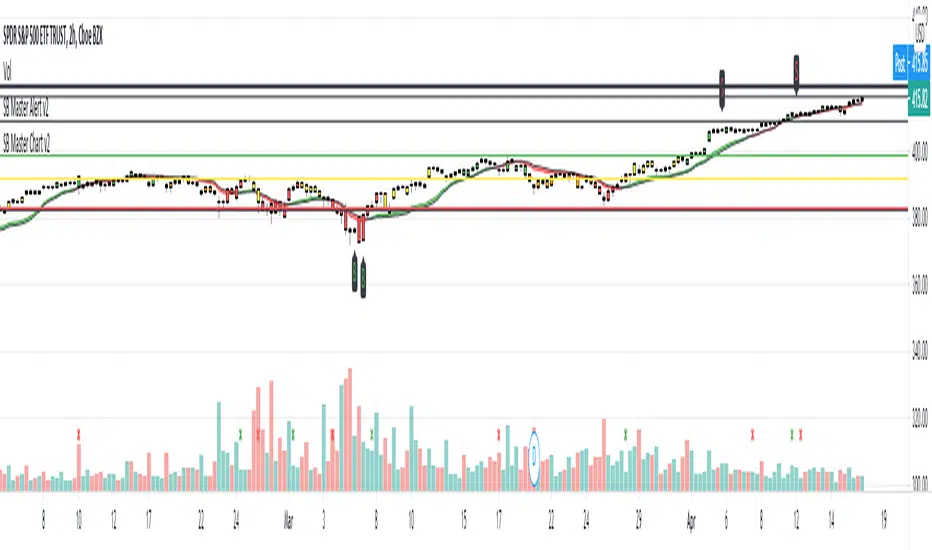
The bar colors are determined by the three moving averages the chart tracks, MA5 , MA20, and MA50.
If the bars are green, a clear uptrend is happening, red represents downtrend.
Yellow bars indicate MA5 is in an uptrend and Orange indicates that MA5 is in a downtrend.
The x's at the bottom of the chart represent macd crossovers and crossunders.
The following dynamic support and resistance lines are as follows.
The settings for the chart include the following.
This is the SB Master Chart. I have combined my Swing Traders Serenity filter to this indicator as a filter for even better trade entries and exits.
SB Master Chart was designed with a minimalist appearance, but is able to provide a trader with all the information he needs at a glance to make informed trading decisions. This chart utilizes the alert() function so the trader can be alerted even while away from a computer to a potential trade opportunity.
The visual display of the chart utilizes the following indicators.
- Bollinger
- MACD
- RSI
- Stochastic
- Session SMA5, SMA20, SMA50
- Daily VWAP20, VWAP50, VWAP100
The alert condition utilizes a combination of the above to form its overbought/oversold conditions.
The bar colors are determined by the three moving averages the chart tracks, MA5 , MA20, and MA50.
If the bars are green, a clear uptrend is happening, red represents downtrend.
Yellow bars indicate MA5 is in an uptrend and Orange indicates that MA5 is in a downtrend.
The x's at the bottom of the chart represent macd crossovers and crossunders.
The following dynamic support and resistance lines are as follows.
- The black horizontal lines are the current bars upper and lower Bollinger Band.
- The green horizonal line is the 20 day VWAP.
- The yellow horizonal line is the 50 day VWAP.
- The red horizonal line is the 100 day VWAP.
The settings for the chart include the following.
- Options for the chart include the ability to disable oversold or overbought alerts.
- The ability to turn off most of the visual settings.
- A multi time frame filter called "Swing Traders Serenity" to filter out trades that do not meet uptrend/downtrend criteria on higher time frames/periods.
- A sympathy play. Sometimes when a stock moves, other stocks move with it. Be alerted when a sympathy play is about to happen by tracking another ticker.
릴리즈 노트
Added additional alertcondition() to make the script compatible with webhook bots.릴리즈 노트
Updated a bug with the background color interfering with the new alertcondition() functions.초대 전용 스크립트
이 스크립트에 대한 접근은 작성자가 승인한 사용자로 제한되며, 일반적으로 지불이 필요합니다. 즐겨찾기에 추가할 수 있지만 권한을 요청하고 작성자에게 권한을 받은 후에만 사용할 수 있습니다. 자세한 내용은 StuBuzzzini에게 문의하거나 아래의 작성자의 지시사항을 따르십시오.
트레이딩뷰는 스크립트 작성자를 100% 신뢰하고 스크립트 작동 원리를 이해하지 않는 한 스크립트 비용을 지불하고 사용하는 것을 권장하지 않습니다. 대부분의 경우 커뮤니티 스크립트에서 무료로 좋은 오픈소스 대안을 찾을 수 있습니다.
작성자 지시 사항
″You can find more information at https://www.sbmasterchart.com
14 day trials are available upon request.
차트에 이 스크립트를 사용하시겠습니까?
경고: 액세스를 요청하기 전에 읽어 보시기 바랍니다.
면책사항
이 정보와 게시물은 TradingView에서 제공하거나 보증하는 금융, 투자, 거래 또는 기타 유형의 조언이나 권고 사항을 의미하거나 구성하지 않습니다. 자세한 내용은 이용 약관을 참고하세요.