INVITE-ONLY SCRIPT
업데이트됨 Spartan
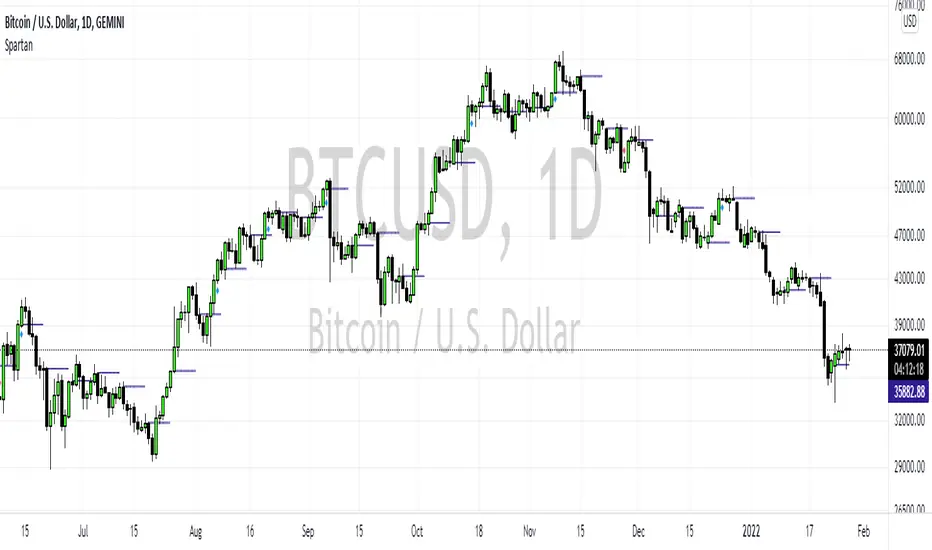
The Spartan Strategy.
This is a momentum strategy which attempts to identify when buying pressure or selling pressure is present in the markets.
How to trade the long side:
Once a blue candle appears, enter Long on pullbacks into a blue candle for longs
Place your stop loss on the opposite side of the blue candle.
Target a previous high for longs
How to trade the short side:
Once a red candle appears, enter Short on pullbacks into a red candle for shorts
Place your stop on the opposite side of the red candle.
Target a previous low for shorts
릴리즈 노트
Adds strong buy and sell zones to script. 릴리즈 노트
Removes red line from chart image. 릴리즈 노트
Adds the following features:Support and Resistance levels shown as:
- Previous Day Highs/Lows
- Previous Week Highs/Lows
- Previous Month Highs/Lows
릴리즈 노트
Removes daily / weekly / monthly levels as it makes chart too congested. 릴리즈 노트
Assigns grades to strong buying and strong selling pressure. A blue candle combined with a blue circle = High Strength Buying Pressure.
A blue candle combined with a orange circle = Medium Strength Buying Pressure.
A blue candle combined with a yellow circle = Low Strength Buying Pressure.
A red candle combined with a red circle = High Strength Selling Pressure.
A red candle combined with a orange circle = Medium Strength Selling Pressure.
A red candle combined with a yellow circle = Low Strength Selling Pressure.
릴리즈 노트
Removed colors초대 전용 스크립트
이 스크립트는 작성자가 승인한 사용자만 접근할 수 있습니다. 사용하려면 요청 후 승인을 받아야 하며, 일반적으로 결제 후에 허가가 부여됩니다. 자세한 내용은 아래 작성자의 안내를 따르거나 LiquidityTracker에게 직접 문의하세요.
트레이딩뷰는 스크립트의 작동 방식을 충분히 이해하고 작성자를 완전히 신뢰하지 않는 이상, 해당 스크립트에 비용을 지불하거나 사용하는 것을 권장하지 않습니다. 커뮤니티 스크립트에서 무료 오픈소스 대안을 찾아보실 수도 있습니다.
작성자 지시 사항
contact me via trading view messages
면책사항
해당 정보와 게시물은 금융, 투자, 트레이딩 또는 기타 유형의 조언이나 권장 사항으로 간주되지 않으며, 트레이딩뷰에서 제공하거나 보증하는 것이 아닙니다. 자세한 내용은 이용 약관을 참조하세요.
초대 전용 스크립트
이 스크립트는 작성자가 승인한 사용자만 접근할 수 있습니다. 사용하려면 요청 후 승인을 받아야 하며, 일반적으로 결제 후에 허가가 부여됩니다. 자세한 내용은 아래 작성자의 안내를 따르거나 LiquidityTracker에게 직접 문의하세요.
트레이딩뷰는 스크립트의 작동 방식을 충분히 이해하고 작성자를 완전히 신뢰하지 않는 이상, 해당 스크립트에 비용을 지불하거나 사용하는 것을 권장하지 않습니다. 커뮤니티 스크립트에서 무료 오픈소스 대안을 찾아보실 수도 있습니다.
작성자 지시 사항
contact me via trading view messages
면책사항
해당 정보와 게시물은 금융, 투자, 트레이딩 또는 기타 유형의 조언이나 권장 사항으로 간주되지 않으며, 트레이딩뷰에서 제공하거나 보증하는 것이 아닙니다. 자세한 내용은 이용 약관을 참조하세요.