INVITE-ONLY SCRIPT
MXV-BSzone

Summary: averaging down the cost of capital with lines and color zones
The strategy can include many long entries when the market is bullish or many short entries when the market is bearish hourly. And we put a stoploss order with same value for all of them.
For me, it is always dificult to detect when and at which best price exactly to stop loss and to take profit after I make an buy or sell entry in hourly time frame, so i make may entry at different price values. And i prefer make only one stoploss price for all the entries
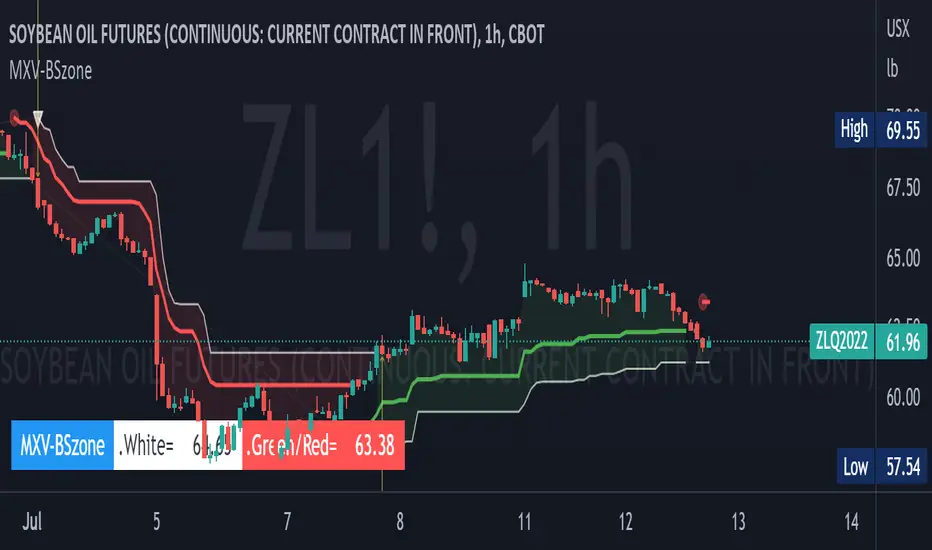
I use 2 visual trailing lines to determine zone of stop loss or take profit in same chart.
Every 60 minutes 2 visual horizontal line will permanently stamp on the charts: red and white.
When to Sell
- When the market is bearish in daily time frame, red line will be marked in H1 time frame as for sell zone. And when candles move up near or cut cross over the red line (we call it: action moment), it is recommended that we should short and make a stoploss at price of the white line (white line in this situation is higher than the red line). I can take profit whenever I have time to watch chart.
When to buy
- When the market is bullish in daily time frame, green line will be marked in H1 time frame as for buy zone. And when candles move down near or cut cross over the green line (we call it: action moment), it is recommended that we should long and make a stoploss at price of the white line (white line in this situation is beneath the green line). I can take profit whenever I have time to watch chart.
* When I miss an action moment, i will need to wait until the next action moments appear and make an entry (or many) then rapidly make an trailing exit with white line value (price) reducing risk
The strategy works fine
초대 전용 스크립트
이 스크립트에 대한 접근은 작성자가 승인한 사용자로 제한되며, 일반적으로 지불이 필요합니다. 즐겨찾기에 추가할 수 있지만 권한을 요청하고 작성자에게 권한을 받은 후에만 사용할 수 있습니다. 자세한 내용은 muzikalink에게 문의하거나 아래의 작성자의 지시사항을 따르십시오.
트레이딩뷰는 스크립트 작성자를 100% 신뢰하고 스크립트 작동 원리를 이해하지 않는 한 스크립트 비용을 지불하고 사용하는 것을 권장하지 않습니다. 대부분의 경우 커뮤니티 스크립트에서 무료로 좋은 오픈소스 대안을 찾을 수 있습니다.
작성자 지시 사항
″Not ready to earth contact !
차트에 이 스크립트를 사용하시겠습니까?
경고: 액세스를 요청하기 전에 읽어 보시기 바랍니다.
면책사항
이 정보와 게시물은 TradingView에서 제공하거나 보증하는 금융, 투자, 거래 또는 기타 유형의 조언이나 권고 사항을 의미하거나 구성하지 않습니다. 자세한 내용은 이용 약관을 참고하세요.