INVITE-ONLY SCRIPT
Flux Charts MTF Supply and Demand Zones (Premium)
업데이트됨
Indicator Overview
The Multi-Timeframe Supply & Demand Zones indicator by Flux Charts displays supply and demand zones on multiple timeframes with two different zone detection methods. These zones are commonly known as areas where there are lots of buyers/sellers present in the market.
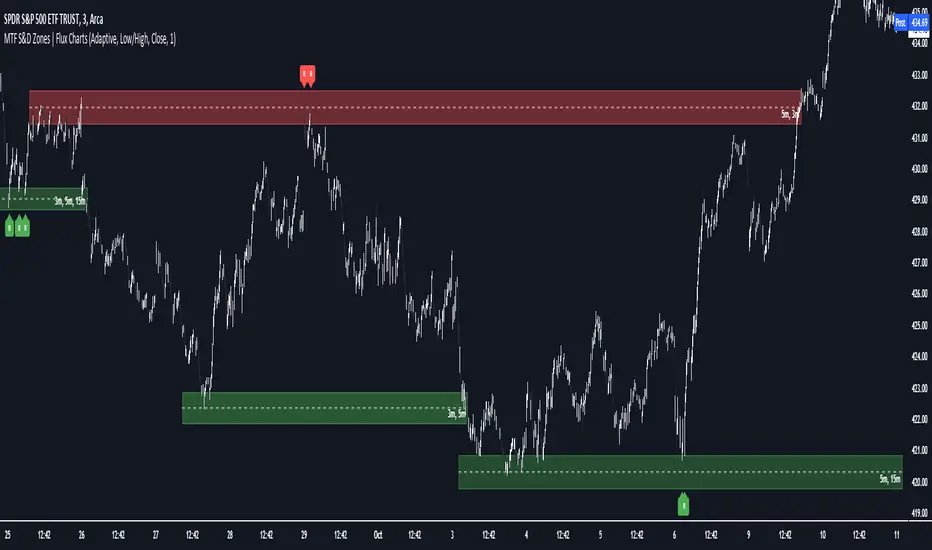
Adaptive Detection Method

 SPY 5m timeframe, October 8 2023
Indicator Settings: (Timeframe: Chart & 15m, Method: Adaptive, Zone Multiplier: 1)
Many times supply and demand scripts try and precisely define conditions that qualify for supply and demand zones. People, however, when locating supply and demand zones manually generally do not take a quantitative approach, rather looking for qualities in price action that have generalized qualities and trends. The adaptive algorithm uniqueness comes from adapting the human approach to work computationally. It generalizes the qualities of supply and demand zones and locates areas in the chart with an acceptable similarity. Specifically, it looks for consolidated areas within the chart that are preceded by a rise or fall in price. The rise or fall length has to be a certain ratio to the consolidation length. If the criteria are met it will draw the zone, if a zone already exists at that price level it will ignore it or merge them if they are different timeframes. This results in a much more consistent ability to identify areas of supply and demand.
Basic Detection Method

The basic detection method looks for areas where price made drastic movements within a small period of time, which could indicate a high level of buyers/sellers at the spot. Thus, these zones are formed and can be used as areas of trading where money is going in/out of the markets.
Multi-Timeframe (MTF) S&D
Flux Charts supply and demand script utilizes MTF. This allows for displaying zones from different timeframes on one chart. Utilizing higher timeframes is a common practice in trading, and it can be easy to forget about key levels & zones on higher timeframes which could cause reversals/bounces.


Here is an example of a 15 minute supply zone formed on the NASDAQ, and with this indicator, you can also see this same 15 minute supply zone while being on a 5 minute candlestick chart, since you have the 15 minute zones enabled in the settings. This indicator offers supply & demand zones on multiple timeframes including the 5 minute, 15 minute, 30 minute, 1 hour, and 4 hour.
Settings

Method:
Zone Retests:
Zone Invalidation:
Zone multiplier:
Timeframe:
Zone Appearance:
Display Labels:
Notifications:
The Multi-Timeframe Supply & Demand Zones indicator by Flux Charts displays supply and demand zones on multiple timeframes with two different zone detection methods. These zones are commonly known as areas where there are lots of buyers/sellers present in the market.
Adaptive Detection Method
Indicator Settings: (Timeframe: Chart & 15m, Method: Adaptive, Zone Multiplier: 1)
Many times supply and demand scripts try and precisely define conditions that qualify for supply and demand zones. People, however, when locating supply and demand zones manually generally do not take a quantitative approach, rather looking for qualities in price action that have generalized qualities and trends. The adaptive algorithm uniqueness comes from adapting the human approach to work computationally. It generalizes the qualities of supply and demand zones and locates areas in the chart with an acceptable similarity. Specifically, it looks for consolidated areas within the chart that are preceded by a rise or fall in price. The rise or fall length has to be a certain ratio to the consolidation length. If the criteria are met it will draw the zone, if a zone already exists at that price level it will ignore it or merge them if they are different timeframes. This results in a much more consistent ability to identify areas of supply and demand.
Basic Detection Method
The basic detection method looks for areas where price made drastic movements within a small period of time, which could indicate a high level of buyers/sellers at the spot. Thus, these zones are formed and can be used as areas of trading where money is going in/out of the markets.
Multi-Timeframe (MTF) S&D
Flux Charts supply and demand script utilizes MTF. This allows for displaying zones from different timeframes on one chart. Utilizing higher timeframes is a common practice in trading, and it can be easy to forget about key levels & zones on higher timeframes which could cause reversals/bounces.
Here is an example of a 15 minute supply zone formed on the NASDAQ, and with this indicator, you can also see this same 15 minute supply zone while being on a 5 minute candlestick chart, since you have the 15 minute zones enabled in the settings. This indicator offers supply & demand zones on multiple timeframes including the 5 minute, 15 minute, 30 minute, 1 hour, and 4 hour.
Settings
Method:
- Choose between the Supply & Demand zones detection (Basic / Adaptive)
Zone Retests:
- Choose how retests should be considered. You can choose between a high/low candle wick entering a zone, or a candle closing inside of a zone to be considered a valid retest.
Zone Invalidation:
- Choose how zones are invalidated. You can choose between a high/low candle wick exiting a zone, or a candle closing outside of a zone to be considered a zone invalidation.
Zone multiplier:
- Adjust zone size (1 is recommended)
Timeframe:
- Choose the timeframes you would like Supply & Demand zones to be displayed from.
Zone Appearance:
- Adjust the colors of Supply/Demand zones
- Enable/Disable the center dashed line in zones
Display Labels:
- Choose to toggle on/off retest & break labels
Notifications:
- Choose what alerts you would like to receive. You can choose to have new zone formations, zone breaks, and zone retests.
릴리즈 노트
Updated timeframe settings to increase script speed.릴리즈 노트
Zones out of range are no longer deleted but hidden until price is within range again.릴리즈 노트
Added Zone Visibility Range setting to allow users to adjust the distance from price where zones become hidden.릴리즈 노트
- Added more information to tooltips
- Added relative to price label spacing
릴리즈 노트
- Added historical zone toggle setting which allows users to hide old zones which have been invalidated.
- Added support for referencing zones of any length in history.
릴리즈 노트
Added option to change the reference size for historical bars.릴리즈 노트
- Added zone size filtering option.
- General updates to detection algorithm.
릴리즈 노트
Added support for charts with no volume information.릴리즈 노트
Removed Basic Detection method.릴리즈 노트
Zone Detection Algorithm Update- Algorithm now can run on 20,000 bars
- Algorithms detection accuracy significantly improved, fixing issues with highly volatile charts
릴리즈 노트
Retest are now triggered if price is within the zone then on the next bar price closes outside the zone. 릴리즈 노트
- NEW "Detection Method" setting now lets you choose between Momentum and Regression for supply and demand zone detection. Regression mirrors the previous version, while Momentum uses momentum candles to identify zones.
- NEW "Sensitivity" setting allows you to adjust detection sensitivity, with lower settings identifying fewer but stronger zones.
- Added "Minimum Zone Width" and "Minimum Zone Length" settings to define the minimum size and number of candles required for a zone.
- Optimized script for faster and smoother performance across multiple timeframes.
릴리즈 노트
- Fixed an issue where zone sizes were incorrectly linked to the maximum zone width setting
릴리즈 노트
- Revised Regression Detection Method logic
초대 전용 스크립트
이 스크립트에 대한 접근은 작성자가 승인한 사용자로 제한되며, 일반적으로 지불이 필요합니다. 즐겨찾기에 추가할 수 있지만 권한을 요청하고 작성자에게 권한을 받은 후에만 사용할 수 있습니다. 자세한 내용은 fluxchart에게 문의하거나 아래의 작성자의 지시사항을 따르십시오.
트레이딩뷰는 스크립트 작성자를 100% 신뢰하고 스크립트 작동 원리를 이해하지 않는 한 스크립트 비용을 지불하고 사용하는 것을 권장하지 않습니다. 대부분의 경우 커뮤니티 스크립트에서 무료로 좋은 오픈소스 대안을 찾을 수 있습니다.
작성자 지시 사항
″Get instant access here: https://fluxcharts.com/?via=tv
차트에 이 스크립트를 사용하시겠습니까?
경고: 액세스를 요청하기 전에 읽어 보시기 바랍니다.
Access Flux Charts' exclusive indicators: FluxCharts.com/?via=tv
Join our FREE Discord for live trading sessions, signals, & trading resources: discord.gg/FluxCharts
Join our FREE Discord for live trading sessions, signals, & trading resources: discord.gg/FluxCharts
면책사항
이 정보와 게시물은 TradingView에서 제공하거나 보증하는 금융, 투자, 거래 또는 기타 유형의 조언이나 권고 사항을 의미하거나 구성하지 않습니다. 자세한 내용은 이용 약관을 참고하세요.