INVITE-ONLY SCRIPT
Flow of Fund Divergence with alert
업데이트됨

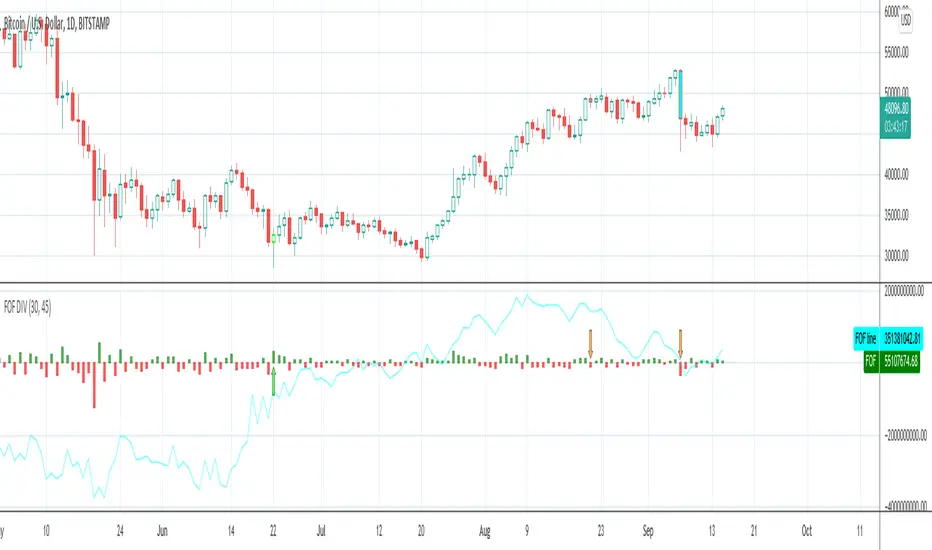
The Flow of fund(FOF) divergence signal indicator consists of the following parts: The Flow of fund histogram, FOF trend line and divergence signal. The signal is instantly drawn on current bar and will not repaint.
HISTOGRAM shows an approximate amount of money get in or out of the market within 1 bar. If selling pressure is stronger than buying pressure, it will be a red histogram, otherwise, it will be a green histogram.
Flow of fund trend line indicates the short or long term movement of the flow, determined by the "Length of FOF" input you set.
Divergence
The divergence signal has two types, bearish and bullish.
A bullish divergence occurs when the price hit a lower low and the FOF line is in uptrend. A down arrow will be drawn above the current FOF line when there is a bearish divergence between FOF and price trend.
A bearish divergence occurs when the price hit a higher high and the FOF line is in downtrend. A up arrow will be drawn below price candle bar when there is a bullish divergence between FOF and price trend.
릴리즈 노트
Solved a minor issue.초대 전용 스크립트
이 스크립트에 대한 접근은 작성자가 승인한 사용자로 제한되며, 일반적으로 지불이 필요합니다. 즐겨찾기에 추가할 수 있지만 권한을 요청하고 작성자에게 권한을 받은 후에만 사용할 수 있습니다. 자세한 내용은 Patternsmart에게 문의하거나 아래의 작성자의 지시사항을 따르십시오.
트레이딩뷰는 스크립트 작성자를 100% 신뢰하고 스크립트 작동 원리를 이해하지 않는 한 스크립트 비용을 지불하고 사용하는 것을 권장하지 않습니다. 대부분의 경우 커뮤니티 스크립트에서 무료로 좋은 오픈소스 대안을 찾을 수 있습니다.
작성자 지시 사항
″"Please Use the link below to obtain access to this indicator".
차트에 이 스크립트를 사용하시겠습니까?
경고: 액세스를 요청하기 전에 읽어 보시기 바랍니다.
면책사항
이 정보와 게시물은 TradingView에서 제공하거나 보증하는 금융, 투자, 거래 또는 기타 유형의 조언이나 권고 사항을 의미하거나 구성하지 않습니다. 자세한 내용은 이용 약관을 참고하세요.