PROTECTED SOURCE SCRIPT
업데이트됨 Mean Reversion Indicator
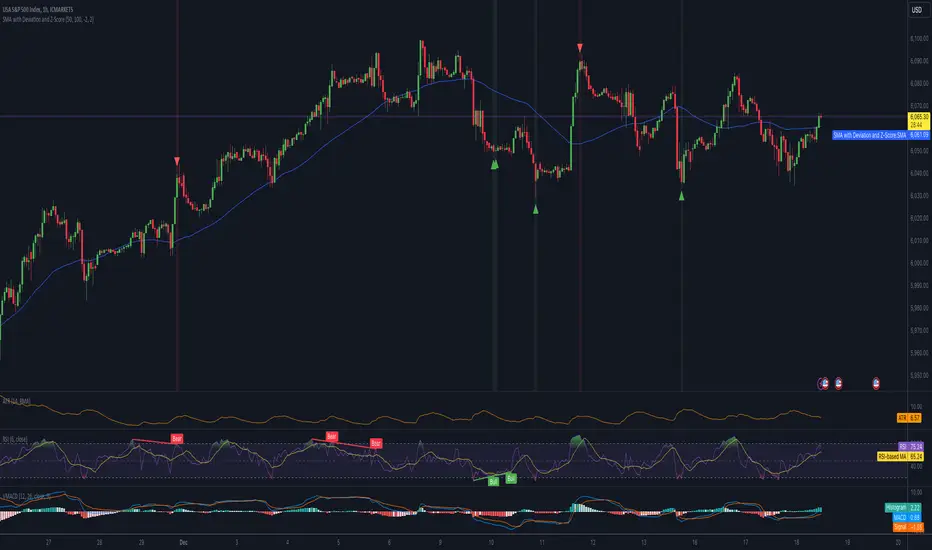
SMA with Deviation and Z-Score Indicator
Overview:
This indicator combines the Simple Moving Average (SMA) with statistical measures of price deviation to identify potential buy and sell signals based on mean reversion principles. It calculates the Z-Score, which quantifies how far the current price is from its moving average in terms of standard deviations, helping traders spot when an asset might be overbought or oversold.
Key Features:
Signal Generation:
Visual Indicators:
Customizable Parameters:

 EURUSD EURUSD
Usage Tips:
This indicator is best used in conjunction with other forms of analysis for confirmation. Mean reversion does not always hold in trending markets.
Adjust the Z-Score thresholds based on asset volatility for more or less frequent signals.
Backtest with historical data to optimize settings for your specific trading approach.
Note: While this indicator can help identify potential trading opportunities based on statistical anomalies, it does not guarantee success and should be part of a broader trading strategy that includes risk management and market context understanding.
Overview:
This indicator combines the Simple Moving Average (SMA) with statistical measures of price deviation to identify potential buy and sell signals based on mean reversion principles. It calculates the Z-Score, which quantifies how far the current price is from its moving average in terms of standard deviations, helping traders spot when an asset might be overbought or oversold.
Key Features:
SMA Calculation: Uses a user-defined period to compute a Simple Moving Average, providing a baseline for price movement.
Z-Score: Measures the number of standard deviations the current price is from the SMA. This is crucial for identifying extreme price movements.
Formula: Z-Score = (Current Price - SMA) / Standard Deviation
Signal Generation:
Buy Signal: Generated when the Z-Score falls below a predefined threshold, suggesting the price is significantly below its mean and potentially undervalued.
Sell Signal: Triggered when the Z-Score exceeds another threshold, indicating the price is significantly above its mean and possibly overvalued.
Visual Indicators:
SMA Line: Plotted in blue on the chart for easy reference.
Z-Score Line: Available but hidden by default, can be shown if needed for deeper analysis.
Buy/Sell Signals: Represented by green up-arrows for buy signals and red down-arrows for sell signals.
Background Color: Changes to green or red subtly to indicate buy or sell zones based on Z-Score thresholds.
Z-Score Label: Provides the numerical Z-Score for each bar, aiding in precise decision-making.
Customizable Parameters:
SMA Length: Adjust the period over which the SMA is calculated.
Lookback Period: Set the number of periods for calculating the standard deviation and Z-Score.
Buy/Sell Z-Scores: Thresholds for generating buy and sell signals can be tailored to your strategy or market conditions.
Usage Tips:
This indicator is best used in conjunction with other forms of analysis for confirmation. Mean reversion does not always hold in trending markets.
Adjust the Z-Score thresholds based on asset volatility for more or less frequent signals.
Backtest with historical data to optimize settings for your specific trading approach.
Note: While this indicator can help identify potential trading opportunities based on statistical anomalies, it does not guarantee success and should be part of a broader trading strategy that includes risk management and market context understanding.
릴리즈 노트
SMA with Deviation and Z-Score IndicatorOverview:
This indicator combines the Simple Moving Average (SMA) with statistical measures of price deviation to identify potential buy and sell signals based on mean reversion principles. It calculates the Z-Score, which quantifies how far the current price is from its moving average in terms of standard deviations, helping traders spot when an asset might be overbought or oversold.
Key Features:
SMA Calculation: Uses a user-defined period to compute a Simple Moving Average, providing a baseline for price movement.
Z-Score: Measures the number of standard deviations the current price is from the SMA. This is crucial for identifying extreme price movements.
Formula: Z-Score = (Current Price - SMA) / Standard Deviation
Signal Generation:
Buy Signal: Generated when the Z-Score falls below a predefined threshold, suggesting the price is significantly below its mean and potentially undervalued.
Sell Signal: Triggered when the Z-Score exceeds another threshold, indicating the price is significantly above its mean and possibly overvalued.
Visual Indicators:
SMA Line: Plotted in blue on the chart for easy reference.
Z-Score Line: Available but hidden by default, can be shown if needed for deeper analysis.
Buy/Sell Signals: Represented by green up-arrows for buy signals and red down-arrows for sell signals.
Background Color: Changes to green or red subtly to indicate buy or sell zones based on Z-Score thresholds.
Z-Score Label: Provides the numerical Z-Score for each bar, aiding in precise decision-making.
Customizable Parameters:
SMA Length: Adjust the period over which the SMA is calculated.
Lookback Period: Set the number of periods for calculating the standard deviation and Z-Score.
Buy/Sell Z-Scores: Thresholds for generating buy and sell signals can be tailored to your strategy or market conditions.
Usage Tips:
This indicator is best used in conjunction with other forms of analysis for confirmation. Mean reversion does not always hold in trending markets.
Adjust the Z-Score thresholds based on asset volatility for more or less frequent signals.
Backtest with historical data to optimize settings for your specific trading approach.
Note: While this indicator can help identify potential trading opportunities based on statistical anomalies, it does not guarantee success and should be part of a broader trading strategy that includes risk management and market context understanding.
보호된 스크립트입니다
이 스크립트는 비공개 소스로 게시됩니다. 하지만 이를 자유롭게 제한 없이 사용할 수 있습니다 – 자세한 내용은 여기에서 확인하세요.
면책사항
해당 정보와 게시물은 금융, 투자, 트레이딩 또는 기타 유형의 조언이나 권장 사항으로 간주되지 않으며, 트레이딩뷰에서 제공하거나 보증하는 것이 아닙니다. 자세한 내용은 이용 약관을 참조하세요.
보호된 스크립트입니다
이 스크립트는 비공개 소스로 게시됩니다. 하지만 이를 자유롭게 제한 없이 사용할 수 있습니다 – 자세한 내용은 여기에서 확인하세요.
면책사항
해당 정보와 게시물은 금융, 투자, 트레이딩 또는 기타 유형의 조언이나 권장 사항으로 간주되지 않으며, 트레이딩뷰에서 제공하거나 보증하는 것이 아닙니다. 자세한 내용은 이용 약관을 참조하세요.