INVITE-ONLY SCRIPT
Flow of Trade [Orderflowing]
업데이트됨
Flow of Trade | Supply & Demand Zones | Turtle Soup Reversal Pattern Detection (+)
Built using Pine Script V5.
Introduction
The Flow of Trade indicator is a trading tool designed to leverage the principles of Supply and Demand, along with automatic “Turtle Soup” reversal pattern detection.
This indicator is made for traders who aim to identify potential market reversal points, supported by multi-timeframe analysis for a more complete market overview.
Core Concepts and Innovation
Supply and Demand (S&D) Zones
At the heart of the Flow of Trade indicator is the concept of Supply & Demand, along with Market Imbalance, which is sound for identifying the Supply and Demand zones.
The Turtle Soup Reversal Pattern Detection
Named after the ICT-derived trading pattern, the Flow of Trade script tries to find and plot these "failed breakout" reversals based on the user input configuration.
Inputs
The Flow of Trade indicator offers customization, allowing traders to fit the tool to their specific analysis needs and trading style.
How It Works
Imbalance Calculation.
The indicator looks at consecutive candles to measure the magnitude of price movement and volume imbalances.
A significant imbalance between buying and selling pressure is what defines a potential supply or demand zone.
Supply Zones Identification.
A supply zone is flagged when there's imbalance favoring sellers, typically after a notable price drop. It looks for a consolidation phase where the price fails to achieve a higher high, suggesting an area where sellers might regain control.
Demand Zones Identification.
A demand zone is marked in the presence of a buyer-dominated imbalance, especially after a significant price rally.
The indicator seeks periods of consolidation where the price doesn't make a lower low, indicating potential buyer accumulation.
Multi-Timeframe Imbalance Analysis.
The indicator extends its imbalance analysis across multiple timeframes of identified zones.
This multi-layered approach allows traders to discern the strength and relevance of supply and demand zones within a broader multi-timeframe market context.
Turtle Soup Reversal Pattern Detection.
The Turtle Soup pattern detection is fitted into the imbalance analysis.
The indicator scans for setups within or near the identified supply and demand zones, providing an additional layer of confirmation for potential reversals.
The Turtle Soup Pattern Logic
Attempts at detecting false breakouts within the zones. For example, a bearish Turtle Soup pattern emerges when the price dips below a demand zone but quickly reverses, indicating a failed breakout and potential upward momentum.
Integration and Practical Application
The Flow of Trade indicator integrates these elements, marking out S&D zones while also scanning for reversal patterns within or adjacent to these zones.
The added multi-timeframe analysis can help the traders understanding of broader market context, enabling you to find the relative strength of MTF zones and see how reversal setups perform in the specific asset.
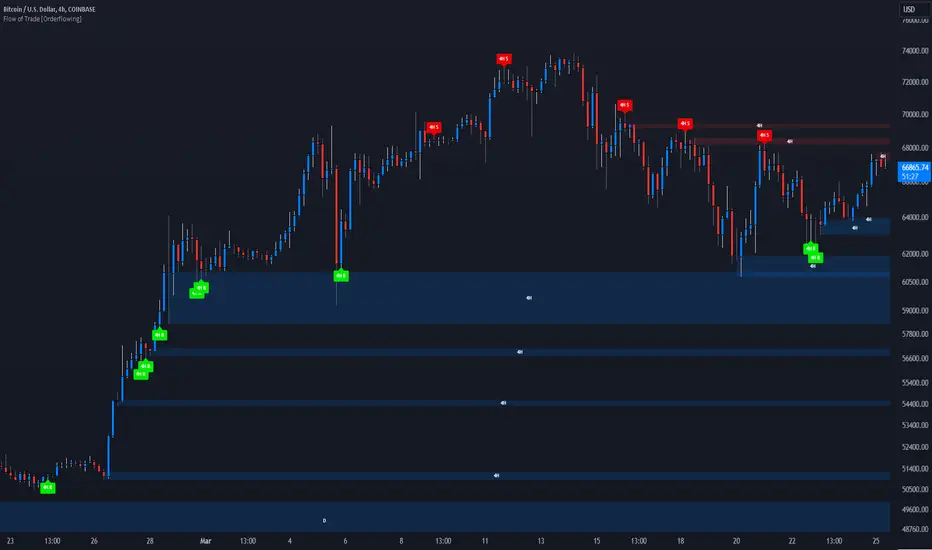
Example of High/Low (H/L) Quotes from Zones:

Example of MTF S&D Zones (4H/D/W):

Conclusion
The Flow of Trade indicator is of time-tested market principles and along with innovative pattern recognition, designed to offer traders a customizable method for more systematized view of supply and demand, along with reversal signals.
Its multi-timeframe analysis can be useful for decision-making and systemizing your trading layout.
Disclaimer
While the Flow of Trade Indicator is a useful tool for analysis, it is important for traders to remember that no single tool can guarantee success.
Past performance is not indicative of future results.
Do not solely rely on the signals from the Flow of Trade indicator.
The indicator is meant to be used as confluence to an existing strategy.
Built using Pine Script V5.
Introduction
The Flow of Trade indicator is a trading tool designed to leverage the principles of Supply and Demand, along with automatic “Turtle Soup” reversal pattern detection.
This indicator is made for traders who aim to identify potential market reversal points, supported by multi-timeframe analysis for a more complete market overview.
Core Concepts and Innovation
Supply and Demand (S&D) Zones
At the heart of the Flow of Trade indicator is the concept of Supply & Demand, along with Market Imbalance, which is sound for identifying the Supply and Demand zones.
The Turtle Soup Reversal Pattern Detection
Named after the ICT-derived trading pattern, the Flow of Trade script tries to find and plot these "failed breakout" reversals based on the user input configuration.
Inputs
The Flow of Trade indicator offers customization, allowing traders to fit the tool to their specific analysis needs and trading style.
- Zone Ratio: Determines the scale of imbalance required for a candle to be considered for a zone. A higher value indicates a need for a more significant imbalance, making zones less frequent but potentially more reliable.
- Zone Extension: Specifies how far to the right of the latest bar the zones should extend, providing a visual projection of potential future support and resistance areas.
- Display LTF Zones: Enables the visualization of zones from lower timeframes on the current chart, offering a multi-timeframe perspective on supply and demand areas.
- Supply and Demand Zone Colors: Customize the colors for supply (red) and demand (blue) zones, including opacity for chart visibility.
- Border Color: Adjust the border color to find a suitable view of the zones. Optionally disable the S&D colors with 0% opacity and only keep border colors for a border-only view.
- Text Display Settings: Options to display high/low quotes information within zones.
- Timeframe Options: Select which timeframes to include in the analysis, from shorter periods like 30M to longer ones like Daily (D) or Weekly (W), allowing for a complete view across different timeframes.
How It Works
Imbalance Calculation.
The indicator looks at consecutive candles to measure the magnitude of price movement and volume imbalances.
A significant imbalance between buying and selling pressure is what defines a potential supply or demand zone.
Supply Zones Identification.
A supply zone is flagged when there's imbalance favoring sellers, typically after a notable price drop. It looks for a consolidation phase where the price fails to achieve a higher high, suggesting an area where sellers might regain control.
Demand Zones Identification.
A demand zone is marked in the presence of a buyer-dominated imbalance, especially after a significant price rally.
The indicator seeks periods of consolidation where the price doesn't make a lower low, indicating potential buyer accumulation.
Multi-Timeframe Imbalance Analysis.
The indicator extends its imbalance analysis across multiple timeframes of identified zones.
This multi-layered approach allows traders to discern the strength and relevance of supply and demand zones within a broader multi-timeframe market context.
Turtle Soup Reversal Pattern Detection.
The Turtle Soup pattern detection is fitted into the imbalance analysis.
The indicator scans for setups within or near the identified supply and demand zones, providing an additional layer of confirmation for potential reversals.
The Turtle Soup Pattern Logic
Attempts at detecting false breakouts within the zones. For example, a bearish Turtle Soup pattern emerges when the price dips below a demand zone but quickly reverses, indicating a failed breakout and potential upward momentum.
Integration and Practical Application
The Flow of Trade indicator integrates these elements, marking out S&D zones while also scanning for reversal patterns within or adjacent to these zones.
The added multi-timeframe analysis can help the traders understanding of broader market context, enabling you to find the relative strength of MTF zones and see how reversal setups perform in the specific asset.
- Strategic Entry and Exit Points: Use the confluence of S&D zones and Turtle Soup patterns to find possible entry and exit points.
- Risk Management: Potentially leverage the defined zones for setting stop-loss levels and managing trade risk based on supply and demand concepts.
- Confirmation and Confluence: Apply multi-timeframe analysis to validate S&D zones and Turtle Soup patterns.
Example of High/Low (H/L) Quotes from Zones:
Example of MTF S&D Zones (4H/D/W):
Conclusion
The Flow of Trade indicator is of time-tested market principles and along with innovative pattern recognition, designed to offer traders a customizable method for more systematized view of supply and demand, along with reversal signals.
Its multi-timeframe analysis can be useful for decision-making and systemizing your trading layout.
Disclaimer
While the Flow of Trade Indicator is a useful tool for analysis, it is important for traders to remember that no single tool can guarantee success.
Past performance is not indicative of future results.
Do not solely rely on the signals from the Flow of Trade indicator.
The indicator is meant to be used as confluence to an existing strategy.
릴리즈 노트
V1.1 - Fixed Minor Bug in H/L Quote Calculation. High and Low quotes are rounded to the nearest tick size.
초대 전용 스크립트
이 스크립트에 대한 접근은 작성자가 승인한 사용자로 제한되며, 일반적으로 지불이 필요합니다. 즐겨찾기에 추가할 수 있지만 권한을 요청하고 작성자에게 권한을 받은 후에만 사용할 수 있습니다. 자세한 내용은 Orderflowing에게 문의하거나 아래의 작성자의 지시사항을 따르십시오.
트레이딩뷰는 스크립트 작성자를 100% 신뢰하고 스크립트 작동 원리를 이해하지 않는 한 스크립트 비용을 지불하고 사용하는 것을 권장하지 않습니다. 대부분의 경우 커뮤니티 스크립트에서 무료로 좋은 오픈소스 대안을 찾을 수 있습니다.
작성자 지시 사항
″To start using this script, please visit our site: https://orderflowing.com for access.
차트에 이 스크립트를 사용하시겠습니까?
경고: 액세스를 요청하기 전에 읽어 보시기 바랍니다.
William | Orderflowing
Develop Edge For Markets™
Indicators:
tradingview.com/u/Orderflowing/
orderflowing.com/indicators
Get Instant Access: orderflowing.com/pricing
Develop Edge For Markets™
Indicators:
tradingview.com/u/Orderflowing/
orderflowing.com/indicators
Get Instant Access: orderflowing.com/pricing
면책사항
이 정보와 게시물은 TradingView에서 제공하거나 보증하는 금융, 투자, 거래 또는 기타 유형의 조언이나 권고 사항을 의미하거나 구성하지 않습니다. 자세한 내용은 이용 약관을 참고하세요.