INVITE-ONLY SCRIPT
업데이트됨 Profit Accumulator Relative Volatility
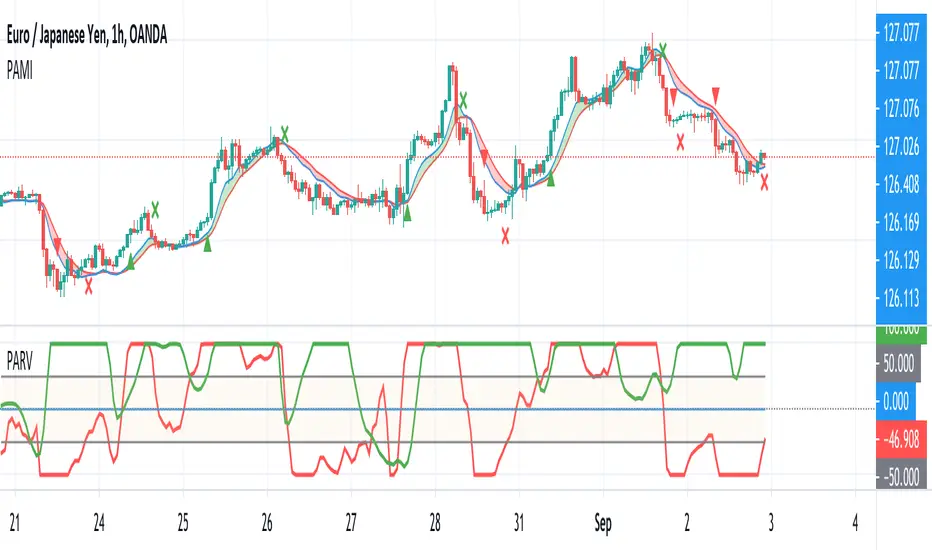
Relative Volatility Indicator
This is a support indicator to the Main Indicator which has also been published.
This indicator uses volatility to determine if the market is quiet, or trading sideways or if there is money in the market and the opportunity for a long or short signal. There is an adjustable bottom line (in this case 0.15) and anything near or below that would indicate that no trades should be taking place. Similarly, if the trend line is declining, this is another indication that any trades should not be taken.
The trend line as an adjustable maximum setting of 0.5 and an increasing trend line is indicative of volatility in the market and a long or short position should be considered. This indicator should be used with the other suite of indicators to provide confluence of the trade.
Whilst an actual alert function is not set for the indicator, the TradingView alert function can be used to trigger a message when the line crosses above 0.15.
I've been using this successfully on the one hour FX charts, but seems to work equally as well on higher or lower time frames (not less than 15min).
The other indicators which are part of the suite are shown on the website which is highlighted in my signature at the bottom of the page. Purchase of the main indicator gives access to the full suite of eight indicators. I use the other indicators to confirm the direction of the trade and to determine if I want to trade or not. I use it along with the 2min, 15min and 4hr timeframes to identify the best entry window and how long I'm likely to be in the trade.
Support can be provided via private message or in the comments below.
The links are provided below for access to the indicator.
릴리즈 노트
Simple moving average added to provide smoothing signal to the trend line. Smoothing length can be configured in the settings of the indicator.릴리즈 노트
Updated to comply with Pinescript House Rules. 릴리즈 노트
Changed the maximum/upper volatility filter so that it captures all currency pairs. The lower volatility filter may need adjusting for each currency pair.릴리즈 노트
This indicator now includes two scripts in one.The green line indicates the relative volatility. Anything above zero is an indication that the market is becoming more volatile and where trades should be considered. Ideal trades are where the value has dipped below zero and then breaks the zero horizontal.
The red line is relating to the % of the candle in relation to the Bollinger band width. The value of 100 would indicate a long trade should be considered and a value of -100 would indicate a short trade should be considered.
초대 전용 스크립트
이 스크립트는 작성자가 승인한 사용자만 접근할 수 있습니다. 사용하려면 요청을 보내고 승인을 받아야 합니다. 일반적으로 결제 후에 승인이 이루어집니다. 자세한 내용은 아래 작성자의 지침을 따르거나 Mikeo82에게 직접 문의하세요.
트레이딩뷰는 스크립트 작성자를 완전히 신뢰하고 스크립트 작동 방식을 이해하지 않는 한 스크립트 비용을 지불하거나 사용하지 않는 것을 권장하지 않습니다. 무료 오픈소스 대체 스크립트는 커뮤니티 스크립트에서 찾을 수 있습니다.
작성자 지시 사항
면책사항
이 정보와 게시물은 TradingView에서 제공하거나 보증하는 금융, 투자, 거래 또는 기타 유형의 조언이나 권고 사항을 의미하거나 구성하지 않습니다. 자세한 내용은 이용 약관을 참고하세요.