OPEN-SOURCE SCRIPT
업데이트됨 On Balance Volume Modified
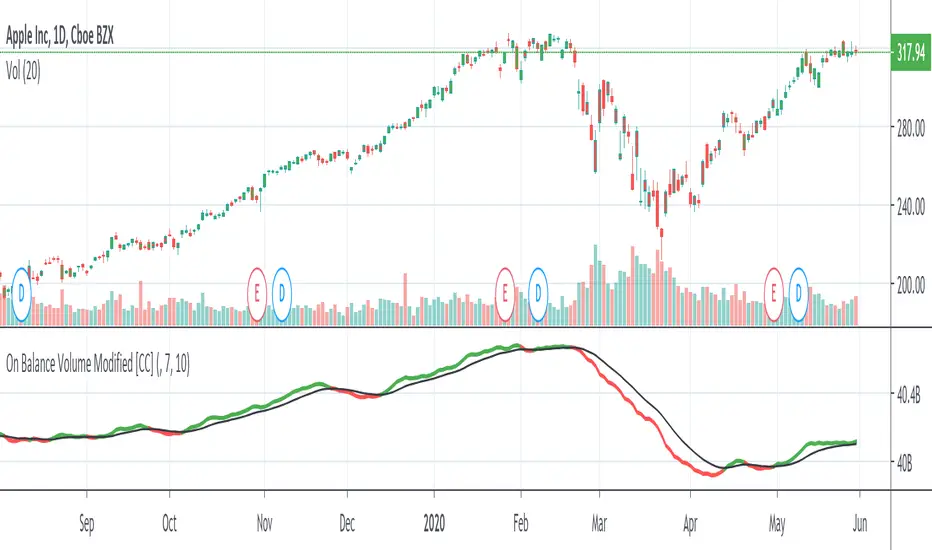
Here is a smoothed version of the classic OBV indicator with a signal line. You can use it to look for signal line crossovers and divergences. The signal line is a 10-day EMA of the OBVM line. Typically, the signal line can vary from 10 to 50.
This was just published by Vitali Apirine in the latest issue of Stocks & Commodities (April 2020) p22-25
Please let me know if you want me to publish any other indicators or if you have any questions!
This was just published by Vitali Apirine in the latest issue of Stocks & Commodities (April 2020) p22-25
Please let me know if you want me to publish any other indicators or if you have any questions!
릴리즈 노트
updated to match my other indicators릴리즈 노트
fixed issue with default resolution오픈 소스 스크립트
트레이딩뷰의 진정한 정신에 따라, 이 스크립트의 작성자는 이를 오픈소스로 공개하여 트레이더들이 기능을 검토하고 검증할 수 있도록 했습니다. 작성자에게 찬사를 보냅니다! 이 코드는 무료로 사용할 수 있지만, 코드를 재게시하는 경우 하우스 룰이 적용된다는 점을 기억하세요.
면책사항
해당 정보와 게시물은 금융, 투자, 트레이딩 또는 기타 유형의 조언이나 권장 사항으로 간주되지 않으며, 트레이딩뷰에서 제공하거나 보증하는 것이 아닙니다. 자세한 내용은 이용 약관을 참조하세요.
오픈 소스 스크립트
트레이딩뷰의 진정한 정신에 따라, 이 스크립트의 작성자는 이를 오픈소스로 공개하여 트레이더들이 기능을 검토하고 검증할 수 있도록 했습니다. 작성자에게 찬사를 보냅니다! 이 코드는 무료로 사용할 수 있지만, 코드를 재게시하는 경우 하우스 룰이 적용된다는 점을 기억하세요.
면책사항
해당 정보와 게시물은 금융, 투자, 트레이딩 또는 기타 유형의 조언이나 권장 사항으로 간주되지 않으며, 트레이딩뷰에서 제공하거나 보증하는 것이 아닙니다. 자세한 내용은 이용 약관을 참조하세요.