OPEN-SOURCE SCRIPT
DSL Trend Analysis [ChartPrime]
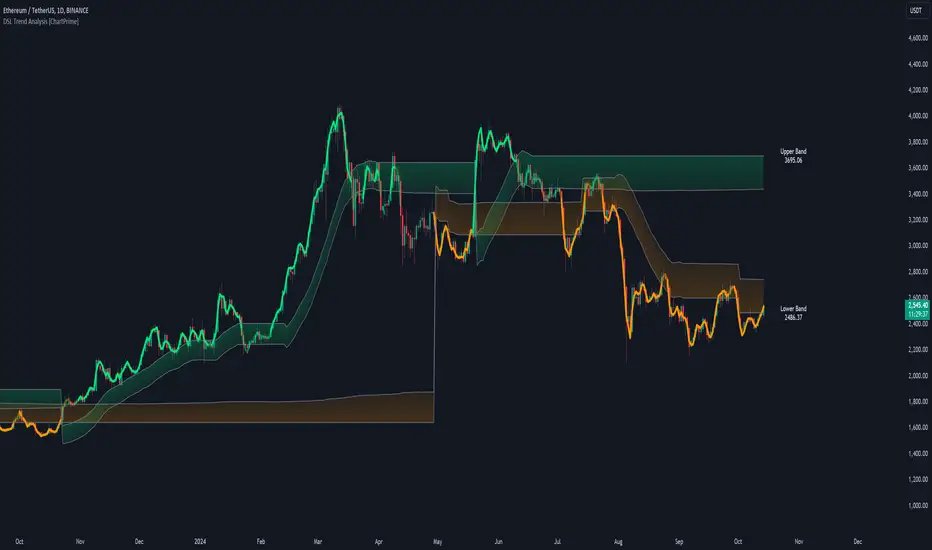
The DSL Trend Analysis [ChartPrime] indicator utilizes Discontinued Signal Lines (DSL) deployed directly on price, combined with dynamic bands, to analyze the trend strength and momentum of price movements. By tracking the high and low price values and comparing them to the DSL bands, it provides a visual representation of trend momentum, highlighting both strong and weakening phases of market direction.
⯁ KEY FEATURES AND HOW TO USE
⯁ USER INPUTS
⯁ CONCLUSION
The DSL Trend Analysis [ChartPrime] indicator is a powerful tool for assessing price momentum and trend strength. By combining Discontinued Signal Lines with dynamically calculated bands, traders can easily spot key moments when momentum shifts from strong to weak or vice versa. The color-coded lines and real-time price labels provide valuable insights for trading decisions in both trending and ranging markets.
⯁ KEY FEATURES AND HOW TO USE
- ⯌ DSL-Based Trend Detection:
This indicator uses Discontinued Signal Lines (DSL) to evaluate price action. When the high stays above the upper DSL band, the line turns lime, indicating strong upward momentum. Similarly, when the low stays below the lower DSL band, the line turns orange, indicating strong downward momentum. Traders can use these visual signals to identify strong trends in either direction. - ⯌ Bands for Trend Momentum:
The indicator plots dynamic bands around the DSL lines based on ATR (Average True Range). These bands provide a range within which price can fluctuate, helping to distinguish between strong and weakening trends. If the high remains within the upper band, the lime-colored line becomes transparent, showing weakening upward momentum. The same concept applies for the lower band, where the line turns orange with transparency, indicating weakening downward momentum.If high and low stays between bands line has no color
to make sure indicator catches only strong momentum of price
- ⯌ Real-Time Band Price Labels:
The indicator places two labels on the chart, one at the upper DSL band and one at the lower DSL band, displaying the real-time price values of these bands. These labels help traders track the current price relative to the key bands, which are essential in determining potential breakout or reversal zones. - ⯌ Visual Confirmation of Momentum Shifts:
By monitoring the relationship between the high and low values of the price relative to the DSL bands, this indicator provides a reliable way to confirm whether the trend is gaining or losing strength. This allows traders to act accordingly, whether it's to enter or exit positions based on trend strength or weakness.
⯁ USER INPUTS
- Length: Defines the period used to calculate the DSL lines, influencing the sensitivity of the trend detection.
- Offset: Adjusts the offset applied to the upper and lower DSL bands, affecting how the thresholds for strong or weak momentum are set.
- Width (ATR Multiplier): Determines the width of the DSL bands based on an ATR multiplier, providing a dynamic range around the price for momentum analysis.
⯁ CONCLUSION
The DSL Trend Analysis [ChartPrime] indicator is a powerful tool for assessing price momentum and trend strength. By combining Discontinued Signal Lines with dynamically calculated bands, traders can easily spot key moments when momentum shifts from strong to weak or vice versa. The color-coded lines and real-time price labels provide valuable insights for trading decisions in both trending and ranging markets.
오픈 소스 스크립트
트레이딩뷰의 진정한 정신에 따라, 이 스크립트의 작성자는 이를 오픈소스로 공개하여 트레이더들이 기능을 검토하고 검증할 수 있도록 했습니다. 작성자에게 찬사를 보냅니다! 이 코드는 무료로 사용할 수 있지만, 코드를 재게시하는 경우 하우스 룰이 적용된다는 점을 기억하세요.
면책사항
해당 정보와 게시물은 금융, 투자, 트레이딩 또는 기타 유형의 조언이나 권장 사항으로 간주되지 않으며, 트레이딩뷰에서 제공하거나 보증하는 것이 아닙니다. 자세한 내용은 이용 약관을 참조하세요.
오픈 소스 스크립트
트레이딩뷰의 진정한 정신에 따라, 이 스크립트의 작성자는 이를 오픈소스로 공개하여 트레이더들이 기능을 검토하고 검증할 수 있도록 했습니다. 작성자에게 찬사를 보냅니다! 이 코드는 무료로 사용할 수 있지만, 코드를 재게시하는 경우 하우스 룰이 적용된다는 점을 기억하세요.
면책사항
해당 정보와 게시물은 금융, 투자, 트레이딩 또는 기타 유형의 조언이나 권장 사항으로 간주되지 않으며, 트레이딩뷰에서 제공하거나 보증하는 것이 아닙니다. 자세한 내용은 이용 약관을 참조하세요.