INVITE-ONLY SCRIPT
Bursa Index KLCI VS Stock/Equity (MI08)
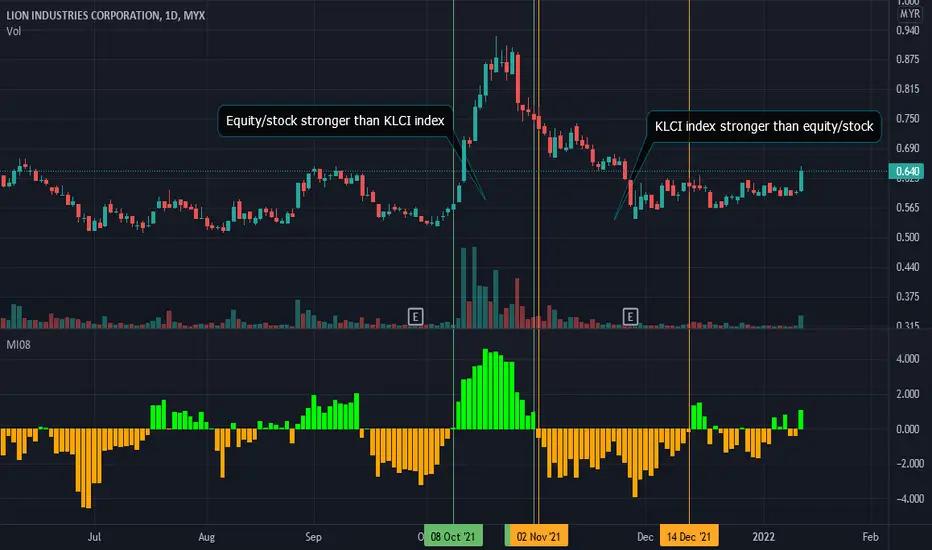
Bursa index KLCI versus stock indicator can be used as a benchmark to help investors compare the performance of the KLCI index and individual equity/stock.
The Green bar indicates that the stock has outperformed the KLCI index.
The Orange bar indicates that the stock has underperformed the KLCI index.
This indicator is not appropriate for comparing to the stock that is a component of the FBM KLCI, as it is already included in the bursa index.
The length of the bar indicates the strength of the stock/index.
Do not reply exclusively on the indication to trade. It is merely an analytical technique to assit investors in determining the strength and weakness of particular equity/stock relative to the KLCI index.
Disclaimer:
This script indicator is solely for the purpose of education / opinion sharing only, and should not be construed as investment advice or recommendations to buy or sell any security.
Get your trade advise from a legit broker, you are responsible on your own trade.
Thank you.
초대 전용 스크립트
이 스크립트에 대한 접근은 작성자가 승인한 사용자로 제한되며, 일반적으로 지불이 필요합니다. 즐겨찾기에 추가할 수 있지만 권한을 요청하고 작성자에게 권한을 받은 후에만 사용할 수 있습니다. 자세한 내용은 magicswings에게 문의하거나 아래의 작성자의 지시사항을 따르십시오.
트레이딩뷰는 스크립트 작성자를 100% 신뢰하고 스크립트 작동 원리를 이해하지 않는 한 스크립트 비용을 지불하고 사용하는 것을 권장하지 않습니다. 대부분의 경우 커뮤니티 스크립트에서 무료로 좋은 오픈소스 대안을 찾을 수 있습니다.
작성자 지시 사항
″Please send message or comment to request for free trial & subscription details.
Thank you. :)
차트에 이 스크립트를 사용하시겠습니까?
경고: 액세스를 요청하기 전에 읽어 보시기 바랍니다.
면책사항
이 정보와 게시물은 TradingView에서 제공하거나 보증하는 금융, 투자, 거래 또는 기타 유형의 조언이나 권고 사항을 의미하거나 구성하지 않습니다. 자세한 내용은 이용 약관을 참고하세요.