INVITE-ONLY SCRIPT
업데이트됨 Trend Analyzer - SwingSwiss Suite

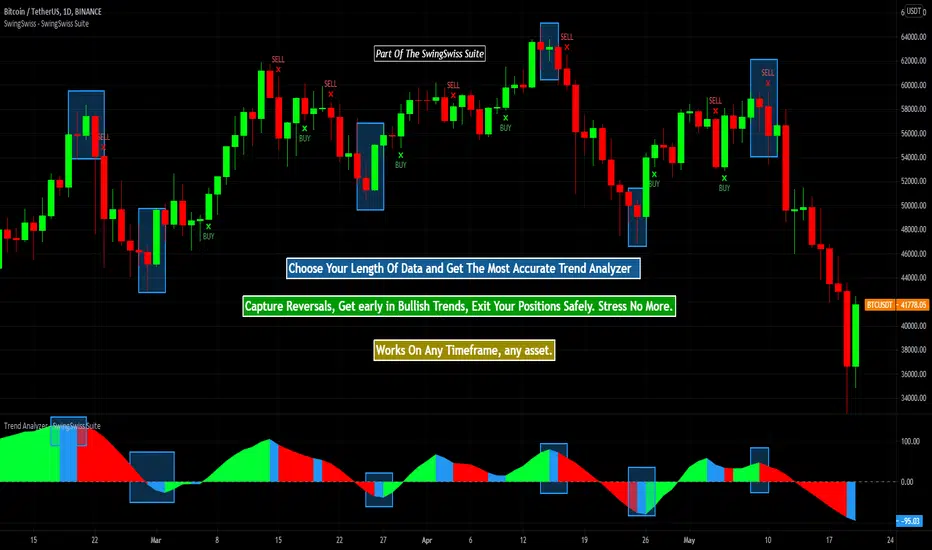
Trend Analyzer aims to define and analyze the trend of a particular asset at a given time using MACD, mathematical functions, and moving average.
It comes in very handy when determining an overall strategy or when you need to decide on whether a trade makes sense or not.
Finally, you can build a complete strategy around the indicator.
QUICK OVERVIEW
When the histogram is green, it means that the asset is currently bullish. Blue shows a possible reversal while red is synonymous with a bearish trend.
In the configuration panel, you can change the length of the data analysis.
The lower the number, the more recent the data captured is. Therefore, it's more predictive.
USE CASES
- You want to make a long trade on a 30mn chart but the indicator is red on the 30mn chart but also in the lower charts showing that the trend is not likely to reverse... You should think twice about that trade.
- You want to short the market on a 2h chart but on the lower charts, the green indicator is showing... Wait for a little bit, you might short at a higher price.
POSSIBLE STRATEGY
Let's take the BTCUSDT Future on the 2h chart :
You can display the indicator twice.
The first one with a length of 5, the second one with a length of 4.
To enter a long trade, wait for the green on length 5 and exit it at blue or red on length 4! It works like magic ;)
Disclaimer:
Trading and investing in the financial markets involves substantial risk of loss and is not suitable for every investor.
All trading strategies are used at your own risk.
Trend Analyzer is part of the SwingSwiss Suite, contact me for more info
릴리즈 노트
- alertes VERT/ROUGE/BLEU sur Trend Analyzer et la possibilité d'ajouter une seconde TF de TA dans le background- - GREEN/RED/BLUE alerts on Trend Analyzer and the possibility to add a second TF to TA in the background
릴리즈 노트
- BUY/SELL signals from Cypher in TA !!!릴리즈 노트
- Added alerts for when TA "TURNED" a color- Added the Stoch Line From Cypher
릴리즈 노트
- fix size릴리즈 노트
- Afficher le RSI dans le Trend Analyzer (pour faire kiffer les comptes gratuits et pro) ✅ 릴리즈 노트
- Automate TAx2 !릴리즈 노트
- bug fix릴리즈 노트
- bug fix릴리즈 노트
- Updated Alerts- Fixed bug with seconds and HTF
릴리즈 노트
Update- Support seconds
- Fixed TA IS BLUE alert
- TA background x2 alerts
- TA background x4 alerts
초대 전용 스크립트
이 스크립트는 작성자가 승인한 사용자만 접근할 수 있습니다. 사용하려면 요청 후 승인을 받아야 하며, 일반적으로 결제 후에 허가가 부여됩니다. 자세한 내용은 아래 작성자의 안내를 따르거나 WiseStrat에게 직접 문의하세요.
트레이딩뷰는 스크립트의 작동 방식을 충분히 이해하고 작성자를 완전히 신뢰하지 않는 이상, 해당 스크립트에 비용을 지불하거나 사용하는 것을 권장하지 않습니다. 커뮤니티 스크립트에서 무료 오픈소스 대안을 찾아보실 수도 있습니다.
작성자 지시 사항
Trend Analyzer Is Part Of The SwingSwiss Suite. Contact me for more info.
면책사항
해당 정보와 게시물은 금융, 투자, 트레이딩 또는 기타 유형의 조언이나 권장 사항으로 간주되지 않으며, 트레이딩뷰에서 제공하거나 보증하는 것이 아닙니다. 자세한 내용은 이용 약관을 참조하세요.